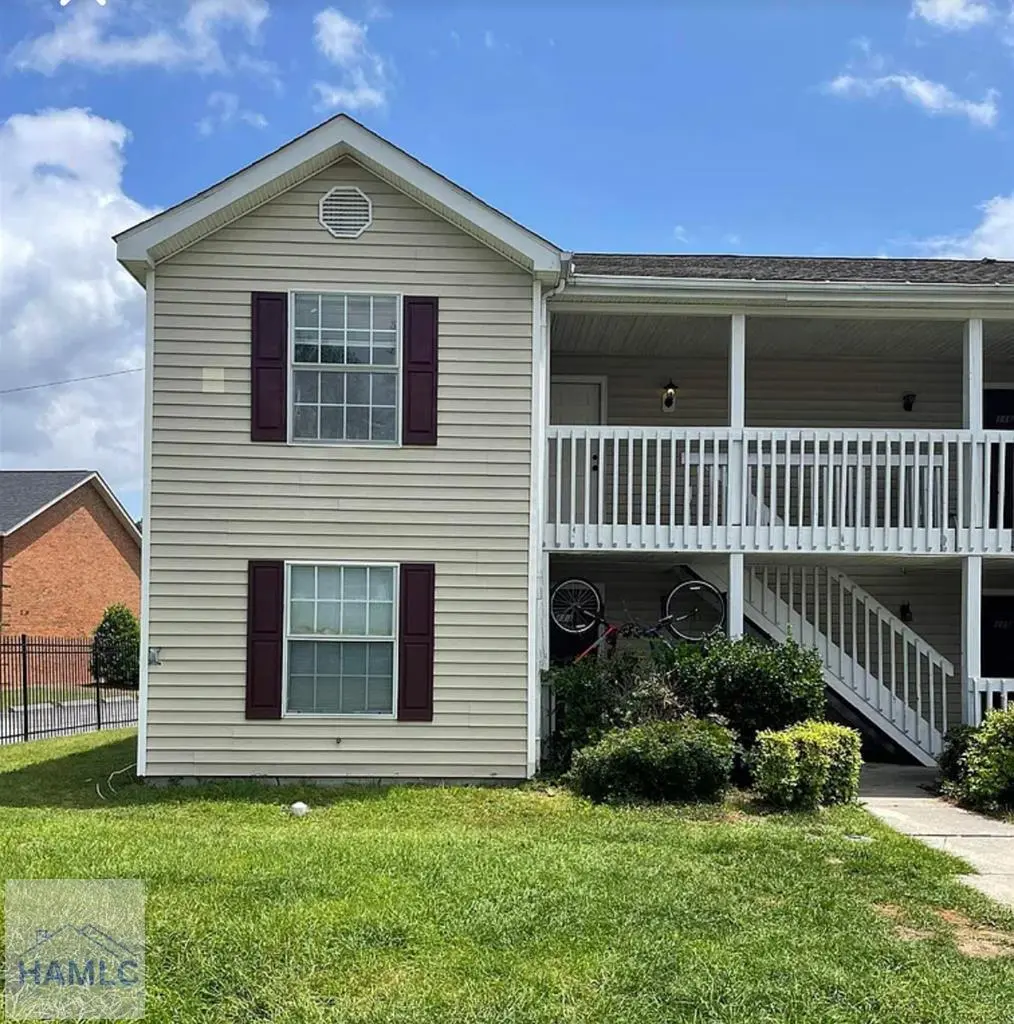
222 Lanier Dr #113 · Statesboro, GA
Flood risk No data
- FEMA flood zone
- —
- Chance of flooding over 30 yrs
- —
- Est. flood insurance / yr
- —
Fire risk No data
- Est. fire insurance / yr
- —
Heat risk No data
- Hot days now (above threshold)
- —
- Hot days in 30 yrs
- —
Wind risk No data
- Chance of severe wind over 30 yrs
- —
Air-quality risk No data
- Unhealthy air days now
- —
- Unhealthy air days in 30 yrs
- —
Risk factors via First Street. Map © Google.
Why this score? — see what drove the D grade
The composite is a weighted blend of 9 inputs, each scored 0–100. Each bar is that input's sub-score; the figure is the points it added to the 100-point composite (weight × sub-score).
- Cash flow +20.3/30.0
- DSCR +6.4/10.0
- 1% rule +5.0/10.0
- Livability +3.4/5.0
- Rent growth +2.9/5.0
- Schools +2.7/10.0
- Condition / age +2.5/5.0
- ARV discount +0.0/15.0
- Appreciation +0.0/10.0
$110,000
🖨 Deal sheet 📄 Offer letter ✓ Due diligence
Listing remarks MLS
This 2-bed 2-bath townhome is an excellent investment located in a prime area near the campus. It boasts a competitive rental rate of $775 per month. We encourage you to call us today to schedule a tour.
Key facts
- Established area
- Bottom floor
- End unit
Tags
Property features AI
Finance
- HOA & community: Homeowners association with an annual fee of $540 (approximately $45/month); Community sidewalks
Exterior
- Parking: Paved parking
- Utilities: Public water; Public sewer
- Home design: Residential townhouse/condo; Corner lot
- Construction: Vinyl siding; Shingle roof; Slab foundation; Built recently (year not specified)
- Exterior features: No notable exterior features; No fencing
Interior
- Kitchen: Dishwasher; Electric oven; Range hood; Refrigerator
- Flooring: Vinyl
- Bathrooms: 2 full bathrooms; 9 half bathrooms
- Heating & cooling: Central heating; Heat pump; Central air conditioning; Ceiling fans
- Interior features: Ceiling fans
- Laundry & utility: Stacked washer/dryer; Electric water heater
Neighborhood map
What this means for you Summary
Snapshot
- This is a 2-bed/2.0-bath single-family listed at $110k.
Deal economics
- At list price, monthly cash flow is $141 ($2k/yr) — positive.
- The deal already cash-flows at list — no discount required.
- Meets the 1% rule at list price ($1k rent vs $110k).
- Cap rate 7.8% vs local median 3.6% in Statesboro — top-decile yield for the area; either an underpriced asset or a hidden risk that comps aren't pricing in. Stress-test before assuming the spread holds.
Location & tenants
- Location reads 68/100 on livability (#151 in GA) — a middle-class / working-renter tenant base. Strengths: cost of living A+, health & safety A+, housing B+; Watch: amenities C-, crime D+, schools D-.
- Bulloch County (rural): math 32% / reading 33% proficiency, ranked #85 of 174 in GA (top 49%) — families likely to look elsewhere, expect single-tenant / working-renter base with shorter leases.
- Market conditions: Rents rising (+1.6%/yr); 335 active listings in the ZIP; 14 comparable units currently listed for rent nearby; rentals lingering (median 44d on market — plan ~5-8 weeks vacancy on turnover, expect pricing pressure); 100% of comp listings sitting > 30 days — soft ceiling on asking rent; 668 units permitted in Bulloch County in 2024 (6 in 5+ unit buildings).
Forward outlook
- Local home prices are declining (-3.0%/yr); year-one equity from $761 of loan paydown is wiped out by about $3k of value loss. Plan a longer hold.
- Bulloch County population projected at +18% by 2050 — long-run rental-demand tailwind backs the buy-and-hold thesis.
Negotiation context
- Only 1 days on market — expect competitive offers; lowballing is unlikely to land.
- 7 sale attempts since 9y ago with the ask held roughly flat each time — persistent listings suggest the price (not the market) is what's stuck; bring a comps-based counter.
- Current owner paid $82k; 33% above their basis — modest negotiation headroom, anchor on the comps not their cost.
Questions for the listing agent
- What does the HOA fee cover, when was the last increase, and are there any pending special assessments or reserve-fund shortfalls?
- Is there a deadline driving the sale (1031 exchange, divorce, estate, relocation)? That informs how much negotiation room exists.
- Schools are D-rated, which usually means shorter tenancies and higher turnover. Who's the typical renter profile here, and what's been the actual vacancy rate?
- Crime grade is D in this area — have there been break-ins, vandalism, or insurance claims at this property in the last 3 years? What carrier currently insures it and at what premium?
- The area grade is low — what's the realistic commute time and amenity access for the typical tenant pool here? Any planned neighborhood developments (good or bad) we should know about?
- What's the average days-on-market for RENTAL listings here right now (not sales)? A rising rental-DOM trend means longer vacancies and softer asking-rent achievability than the comps imply.
- What's the recent tenant-quality profile in this submarket — average credit score on applications, eviction rate, late-payment / NSF rate, and stable-employment percentage? A property-management company in the area should have these aggregated.
- How much new for-sale + rental construction is in the pipeline within 1–3 miles? Heavy new supply typically softens prices + rents 12–24 months out; constrained supply supports both.
Investment metrics
- 1% rule
- 1.00% ✓
- Cap rate
- 7.83%
- Cash-on-cash
- 5.48%
- DSCR
- 1.24
- GRM
- 8.3
CMA / ARV
- ARV (on-the-fly)
- $93,280
- Comps found
- 2
Show comp detail 2 sales within ~0.75 mi
| Address | Dist | Beds/Ba | Sqft | Sold | Price | $/sf | Match |
|---|---|---|---|---|---|---|---|
| 230 Lanier Dr #113 | 0.19mi | 2/2.0 | 825 (-6%) | 3mo | $87,500 | $106 | 78 |
| 230 Lanier Dr #192 | 0.19mi | 2/2.0 | 825 (-6%) | 4mo | $85,000 | $103 | 78 |
Match score weights: distance 35% · size 25% · config 20% · recency 20%. Top-matched comps best support the ARV.
Projected returns pro-forma
-3.0% appreciation · 1.62% rent growth · sell at horizon
- IRR
- -9.3%
- Equity multiple
- 0.66×
- Total profit
- $-10,382
- Equity at exit
- $16,401
- IRR
- -1.8%
- Equity multiple
- 0.88×
- Total profit
- $-3,543
- Equity at exit
- $9,511
Cash invested: $30,800 (down + closing). Projections, not guarantees.
Landlord ↔ Tenant lean methodology
- Overall (STATE)
- 90 Strongly Landlord-Friendly
- State Georgia
- 90 Strongly Landlord-Friendly · R+3
- County
- — inherits STATE
- City
- — inherits STATE
ZIP-level market 30458
- Home prices YoY
- -32.1%
- Rents YoY
- 1.6%
- Active inventory
- 335
- Price-to-rent
- 8.3×
Monthly cashflow live
- Estimated rent
- $1,102 high interval (Pro) →
- Mortgage (P&I)
- −$577
- Tax from tax record
- −$63 /mo · $751/yr
- Insurance
- −$46
- HOA
- −$45
- Vacancy / Maint / Mgmt
- −$231
- Net cashflow
- $141
Break-even live
UW: 25.0% down · 7.5% · 30yr · 1.5% tax · 5.0% vac · 8.0% maint · 8.0% mgmt
Financing live
Cash to close
- Down payment
- $27,500
- Closing costs
- $3,300
- Reserves months
- —
- Total cash needed
- —
Loan-product check · same deal, 3 products live
Conventional
25% down · 7.5% · 30yr
- Down + closing
- —
- Monthly P&I
- —
- Monthly cashflow
- —
- DSCR
- —
- Eligible?
- —
Personal DTI + credit; lowest rate.
DSCR
20% down · 8.5% · 30yr
- Down + closing
- —
- Monthly P&I
- —
- Monthly cashflow
- —
- DSCR
- —
- Eligible?
- —
No personal income docs; deal must DSCR.
Hard money
10% down · 12.0% · 12mo
- Down + closing
- —
- Monthly P&I
- —
- Monthly cashflow
- —
- DSCR
- —
- Eligible?
- —
Short-term bridge; refi at stabilization.
Rent comps 14 comps
| Address | Beds | Baths | Sqft | Rent | $/sqft | DOM | Units | Dist |
|---|---|---|---|---|---|---|---|---|
| 230 Lanier Dr Unit 221 Statesboro, GA | 2.0 | 2.0 | 850 | $925 | $1.09 | 43d | 1 | 0.21mi |
| 230 Lanier Dr #74 Statesboro, GA | 2.0 | 2.0 | 997 | $950 | $0.95 | 43d | 1 | 0.21mi |
| 223 Lanier Dr Unit 1 Statesboro, GA | 1.0 | 1.0 | 650 | $895 | $1.38 | 43d | 1 | 0.24mi |
| 140 Lanier Dr Unit 141 Statesboro, GA | 2.0 | 1.0 | 825 | $950 | $1.15 | 43d | 1 | 0.27mi |
| 140 Lanier Dr #91 Statesboro, GA | 2.0 | 1.0 | 850 | $925 | $1.09 | 43d | 1 | 0.27mi |
| 1150 Brampton Ave Statesboro, GA | 2.0–3.0 | 2.0–3.0 | 1025 | $1,500 | $1.46 | 43d | 11 | 0.32mi |
| 819 Robin Hood Trl Statesboro, GA | 2.0 | 2.0 | 860 | $1,134 | $1.32 | 43d | 8 | 0.38mi |
| 2000 Stambuk Ln Statesboro, GA | 1.0–4.0 | 1.0–4.0 | 1030 | $929 | $0.90 | 43d | 26 | 0.62mi |
| 1801 Chandler Rd Unit 57 Statesboro, GA | 2.0 | 1.0 | 750 | $900 | $1.20 | 43d | 1 | 0.65mi |
| 20 University Pl Statesboro, GA | 3.0 | 2.0 | 1120 | $1,500 | $1.34 | 43d | 1 | 0.67mi |
| 251 Knight Dr #7 Statesboro, GA | 2.0 | 1.5 | 1050 | $1,050 | $1.00 | 43d | 1 | 0.72mi |
| 17931 Highway 67 Statesboro, GA | 3.0 | 1.0–3.0 | 775 | $1,035 | $1.34 | 43d | 2 | 0.74mi |
| 100 Lanier Dr #17 Statesboro, GA | 2.0 | 1.0 | 750 | $900 | $1.20 | 43d | 1 | 0.82mi |
| 109 Harvey Dr Statesboro, GA | 1.0 | 1.0 | 685 | $965 | $1.41 | 43d | 2 | 0.84mi |
HOA detail
- Monthly dues
- $45 · $540/yr
Listing history 3 events
-
2026-06-05status $110,000 Pending 1 DOM
-
2026-06-03remarks 519-char remark
-
2026-06-03$110,000 Active 1 DOM
ⓘ Source: listings_history table (triggers on properties + properties_extension) + one-shot
backfill from property_details.listing_events for pre-trigger history.
Tax reassessment forecast GA · Resets to sale price
- Current annual tax
- $751 · $63/mo
- Projected year-2 tax
- $1,012 · $84/mo
- Expected delta
- +$261/yr (+$22/mo · 34.8%)
ⓘ Screening estimate from a state-policy table — verify with the county assessor before closing.
Nearby sold comps map
Loading sold comps map…
Walkable amenities ~0.75 mi
Loading nearby amenities…
Taxation est. · year 1
- Rental income
- $13,228
- − Mortgage interest
- −$6,162
- − Property taxes
- −$751
- − Insurance
- −$550
- − Repairs & maintenance
- −$1,058
- − Management
- −$1,058
- − HOA
- −$540
- − Depreciation
- −$3,200
- Taxable loss
- −$91
- Est. tax savings @ 24.0%
- +$22
- After-tax cash flow
- $1,709/yr
For passive investors: Depreciation is non-cash, so a rental often shows a tax loss while cash-flowing — sheltering income. Rental losses are passive: they offset passive income freely, and up to $25,000/yr can offset ordinary (W-2) income if you actively participate and your MAGI is under $100k (phasing out to $0 by $150k); unused losses carry forward. On sale, claimed depreciation is recaptured at up to 25%, and gains may owe capital-gains tax (a 1031 exchange can defer both). Figures are a year-1 estimate at your 24.0% rate — not tax advice; consult a CPA.
Schools (NCES district)
- District
- Bulloch County
- NCES district ID
- 1300630
- Math proficiency
- 32% ▼ -11.00%
- Reading proficiency
- 33% ▼ -8.00%
- Median HH income
- $36,335
- Composite
- 26.97/100
- National rank
- #7074
- State rank
- #85 of 174 in GA
Livability — Statesboro
- Score
- 68/100
- State rank
- #151
- US rank
- #9809
Category grades
Schools grade is shown separately in the Schools card above.
Census & demographics
- Census place
- Statesboro, GA
- County
- Bulloch County · 73,507 people
- City population
- 67,164
- Metro
- Statesboro, GA
- Population (ZIP)
- 49,717
- Household income
- $52,038
- Rent vs Own
- Severe rent burden
- 3020.0
Population outlook (Bulloch County) Hauer SSP2
- Today (2025)
- 79,935 people
- By 2030
- 83,796 · +4.8%
- By 2040
- 89,717 · +12.2%
- By 2050
- 94,558 · +18.3%
- By 2075
- 104,376 · +30.6%
- By 2100
- 112,857 · +41.2%
Race, ethnicity, and origin ACS 2023
- Neighborhood character
- Diverse neighborhood (Simpson 0.58)
- Race & ethnicity
- White 53% Black 36% Two or more races 6% Hispanic / Latino 5% Asian 2%
- Hispanic origin (detail)
- Mexican 2% Puerto Rican 1%
- Common ancestry
- Italian 2% Slovak 1% Romanian 1%
- Foreign-born
- 4% · Canada
- Languages at home
- 94% English-only · Spanish 3%
Political lean MEDSL · Bulloch
- 2024 margin
- Strong R (+29.0) · D 35.3% · R 64.3%
- 2008→2024 swing
- -9.8pp toward R · 2008: -19.2pp · 2024: -29.0pp
- All cycles
- 2024: R+29.0 2020: R+23.7 2016: R+23.4 2012: R+19.1 2008: R+19.2
Not yet ingested
- Civics
- —
Market trends
- HPI YoY
- ▼ -95.47%
- Current HPI
- 201.6684
- Rent YoY
- ▲ 1.62%
- Metro
- Statesboro, GA
- State GDP YoY
- ▲ 2.66%
- F500 in state
- 28
Industry mix (Fortune 500 HQ in GA)
| Industry | F500 HQs | Revenue |
|---|---|---|
| Paper / Packaging | 2 | $29B |
|
||
| Retail | 1 | $160B |
|
||
| Transportation / Logistics | 1 | $91B |
|
||
| Airlines | 1 | $62B |
|
||
| Consumer Goods | 1 | $47B |
|
||
| Utilities | 1 | $25B |
|
||
Price history
+300.0% since first listed21 events — show timeline
- 2026-06-02 Listed $110,000 HABR
- 2025-06-26 Price Changed $110,000 HABR
- 2025-05-21 Price Changed $115,000 HABR
- 2024-06-06 Rental Removed $975 APPFOLIO
- 2024-05-21 Listed for Rent $975 APPFOLIO
- 2024-01-16 Rental Removed $1,050 Avail
- 2023-12-01 Listed for Rent $1,050 Avail
- 2023-06-06 Sold (Public Records) $82,500 Public Records
- 2023-05-30 Sold (MLS) $82,500 GAMLS
- 2023-05-24 Pending — GAMLS
- 2023-04-28 Sold (Public Records) $123,000 Public Records
- 2023-04-28 Listed $82,500 GAMLS
- 2021-12-03 Listing Removed — GAMLS
- 2021-12-01 Sold (Public Records) $51,000 Public Records
- 2021-11-24 Sold (MLS) $51,000 GAMLS
- 2021-10-06 Pending — GAMLS
- 2021-09-10 Listed $54,900 GAMLS
- 2019-02-18 Sold (MLS) $30,000 GAMLS
- 2018-09-24 Listed $32,500 GAMLS
- 2017-07-14 Sold (MLS) $27,500 GAMLS
- 2017-03-03 Listed $27,500 GAMLS
Property tax history
+10.8%/yrLatest (2025): $751 · +33.2% YoY. Source: county tax records.
Cash-flow waterfall
monthlySold comps — $/sqft
last 12 mo · ≤1 miLoading sold comps…