108 Furrs Mill Rd · East Lexington, VA
Flood risk No data
- FEMA flood zone
- —
- Chance of flooding over 30 yrs
- —
- Est. flood insurance / yr
- —
Fire risk No data
- Est. fire insurance / yr
- —
Heat risk No data
- Hot days now (above threshold)
- —
- Hot days in 30 yrs
- —
Wind risk No data
- Chance of severe wind over 30 yrs
- —
Air-quality risk No data
- Unhealthy air days now
- —
- Unhealthy air days in 30 yrs
- —
Risk factors via First Street. Map © Google.
Why this score? — see what drove the D+ grade
The composite is a weighted blend of 9 inputs, each scored 0–100. Each bar is that input's sub-score; the figure is the points it added to the 100-point composite (weight × sub-score).
- Cash flow +17.2/30.0
- ARV discount +8.8/15.0
- DSCR +5.4/10.0
- Schools +4.7/10.0
- Livability +3.6/5.0
- 1% rule +3.5/10.0
- Rent growth +2.5/5.0
- Condition / age +2.5/5.0
- Appreciation +0.0/10.0
$185,000
🖨 Deal sheet 📄 Offer letter ✓ Due diligence
Listing remarks MLS
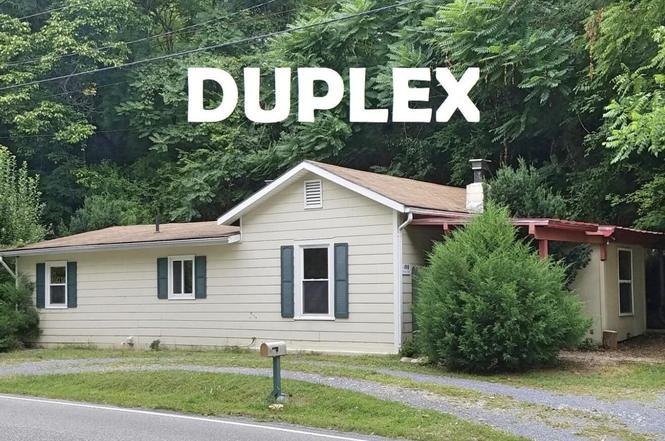
Rock Cliff Cottage! Exciting opportunity to own a home or investment within walking distance to downtown, the Maury River, and Chessie Nature Trail access. This cottage is currently used divided as a 2 bedroom apartment and a studio apartment with 2 kitchens and two baths but could easily be converted back to single family residence. The home additionally has space for more parking and two private outdoor decks . Don't miss this unique cottage!
Key facts
- 0.36 acre lot
- Built 1966
- Listed 144 days
Neighborhood map
What this means for you Summary
Snapshot
- This is a 2-bed/2.0-bath single-family listed at $185k.
Deal economics
- At list price, monthly cash flow is $134 ($2k/yr) — positive.
- The deal already cash-flows at list — no discount required.
- To meet the 1% rule (rent ≥ 1% of price), the offer needs to be $157k (15.1% below list).
- Recommended offer: $157k (15.1% below list) — sets the bar for 1% rule.
- Cap rate 7.2% vs local median 2.7% in East Lexington — top-decile yield for the area; either an underpriced asset or a hidden risk that comps aren't pricing in. Stress-test before assuming the spread holds.
Location & tenants
- Location reads 71/100 on livability (#218 in VA) — a middle-class / working-renter tenant base. Strengths: crime A+, health & safety A+, cost of living A; Watch: housing C-, employment D, amenities F.
- Rockbridge County Public School District (town): math 43% / reading 67% proficiency, ranked #80 of 131 in VA (top 61%) — acceptable for families but not a draw, mixed tenant base, ~2y average lease.
- Zoned schools: Central Elementary (math 37% / reading 62%, grade D, #742 of 1,108 statewide, top 70%, 452 students, 70% FRL); Maury River Middle (math 38% / reading 63%, grade C, #226 of 342 statewide, top 67%, 502 students, 70% FRL); Rockbridge County High (math 52% / reading 82%, grade B, #185 of 319 statewide, top 61%, 994 students, 66% FRL) — zoned schools average 69% FRL vs 37% district-wide (31 pts higher); higher-poverty schools than district average — tighter screening recommended.
- Market conditions: 146 active listings in the ZIP; 5 comparable units currently listed for rent nearby; rentals at typical pace (median 15d on market — plan ~3-4 weeks tenant-placement turnaround); solid renter incomes; 85 units permitted in Rockbridge County in 2024 (0 in 5+ unit buildings).
Forward outlook
- Local home prices are declining (-3.0%/yr); year-one equity from $1k of loan paydown is wiped out by about $6k of value loss. Plan a longer hold.
- Rockbridge County population projected at -11% by 2050 — secular population decline; favor cash flow + early exit over multi-decade hold.
Negotiation context
- It's been on market 144 days — a 12% lower offer ($163k) is reasonable based on typical stale-listing flexibility.
- 4 sale attempts since 7y ago with the ask held roughly flat each time — persistent listings suggest the price (not the market) is what's stuck; bring a comps-based counter.
- Current owner paid $86k; list at $185k implies a 116% gain — meaningful room to come down on a strong offer.
Questions for the listing agent
- It's been on market 144 days. Have you received any prior offers? Is the seller open to a 15% concession, seller financing, or rate buy-down credit?
- Built in 1966 — when were the roof, HVAC, electrical panel, plumbing, and water heater last replaced?
- Why hasn't it sold? Are there any deal-killer items the seller is aware of (foundation, flood, title, zoning, code violations)?
- Is there a deadline driving the sale (1031 exchange, divorce, estate, relocation)? That informs how much negotiation room exists.
- Schools are F-rated, which usually means shorter tenancies and higher turnover. Who's the typical renter profile here, and what's been the actual vacancy rate?
- The area grade is low — what's the realistic commute time and amenity access for the typical tenant pool here? Any planned neighborhood developments (good or bad) we should know about?
- What's the average days-on-market for RENTAL listings here right now (not sales)? A rising rental-DOM trend means longer vacancies and softer asking-rent achievability than the comps imply.
- What's the recent tenant-quality profile in this submarket — average credit score on applications, eviction rate, late-payment / NSF rate, and stable-employment percentage? A property-management company in the area should have these aggregated.
- How much new for-sale + rental construction is in the pipeline within 1–3 miles? Heavy new supply typically softens prices + rents 12–24 months out; constrained supply supports both.
Investment metrics
- 1% rule
- 0.85% ✗
- Cap rate
- 7.16%
- Cash-on-cash
- 3.10%
- DSCR
- 1.14
- GRM
- 9.8
CMA / ARV
- ARV (on-the-fly)
- $190,650
- Comps found
- 4
Show comp detail 4 sales within ~0.75 mi
| Address | Dist | Beds/Ba | Sqft | Sold | Price | $/sf | Match |
|---|---|---|---|---|---|---|---|
| 402 Mary Ln | 0.61mi | 2/1.0 | 1,054 (+3%) | 10mo | $170,000 | $161 | 55 |
| 408 Maury St | 0.61mi | 2/1.0 | 1,075 (+5%) | 6mo | $216,000 | $201 | 54 |
| 249 Campbell Ln | 0.41mi | 3/1.0 (+1) | 995 (-3%) | 20mo | $185,000 | $186 | 50 |
| 708 Mccorkle Dr | 0.43mi | 2/1.0 | 891 (-13%) | 12mo | $159,000 | $178 | 44 |
Match score weights: distance 35% · size 25% · config 20% · recency 20%. Top-matched comps best support the ARV.
Projected returns pro-forma
-3.0% appreciation · 3.0% rent growth · sell at horizon
- IRR
- -11.5%
- Equity multiple
- 0.58×
- Total profit
- $-21,541
- Equity at exit
- $27,584
- IRR
- -2.3%
- Equity multiple
- 0.84×
- Total profit
- $-8,120
- Equity at exit
- $15,995
Cash invested: $51,800 (down + closing). Projections, not guarantees.
Landlord ↔ Tenant lean methodology
- Overall (STATE)
- 55 Moderately Landlord-Leaning
- State Virginia
- 55 Moderately Landlord-Leaning · D+2
- County
- — inherits STATE
- City
- — inherits STATE
ZIP-level market 24450
- Home prices YoY
- -22.8%
- Active inventory
- 146
- Price-to-rent
- 9.8×
Monthly cashflow live
- Estimated rent
- $1,571 high interval (Pro) →
- Mortgage (P&I)
- −$970
- Tax from tax record
- −$60 /mo · $720/yr
- Insurance
- −$77
- HOA
- −$0
- Vacancy / Maint / Mgmt
- −$330
- Net cashflow
- $134
Break-even live
UW: 25.0% down · 7.5% · 30yr · 1.5% tax · 5.0% vac · 8.0% maint · 8.0% mgmt
Financing live
Cash to close
- Down payment
- $46,250
- Closing costs
- $5,550
- Reserves months
- —
- Total cash needed
- —
Loan-product check · same deal, 3 products live
Conventional
25% down · 7.5% · 30yr
- Down + closing
- —
- Monthly P&I
- —
- Monthly cashflow
- —
- DSCR
- —
- Eligible?
- —
Personal DTI + credit; lowest rate.
DSCR
20% down · 8.5% · 30yr
- Down + closing
- —
- Monthly P&I
- —
- Monthly cashflow
- —
- DSCR
- —
- Eligible?
- —
No personal income docs; deal must DSCR.
Hard money
10% down · 12.0% · 12mo
- Down + closing
- —
- Monthly P&I
- —
- Monthly cashflow
- —
- DSCR
- —
- Eligible?
- —
Short-term bridge; refi at stabilization.
Rent comps 5 comps
| Address | Beds | Baths | Sqft | Rent | $/sqft | DOM | Units | Dist |
|---|---|---|---|---|---|---|---|---|
| 45 Holly Park Ln #222 Lexington, VA | 2.0 | 2.0 | 1254 | $1,450 | $1.16 | 14d | 1 | 0.09mi |
| 3 Jean Francis DR Lexington, VA | 3.0 | 2.0 | 1200 | $2,200 | $1.83 | 14d | 1 | 1.02mi |
| 204 S Jefferson St Lexington, VA | 2.0 | 1.0 | 792 | $1,400 | $1.77 | 14d | 1 | 1.15mi |
| 203 Myers St Apt B Lexington, VA | 2.0 | 1.0 | 1000 | $1,400 | $1.40 | 14d | 1 | 1.21mi |
| 23 Triple Crown Dr Unit 25 Lexington, VA | 3.0 | 2.5 | 1300 | $2,100 | $1.62 | 14d | 1 | 1.47mi |
Listing history 10 events
-
2026-04-26status Pending
-
2025-12-08status Active
-
2025-11-26status Pending
-
2025-11-21$185,000 Active
-
2023-11-24historical $625
-
2023-11-10$625
-
2022-08-12price $575
-
2020-03-06soldstatus $85,500
-
2020-02-28soldstatus $85,500 452-char remark
Show marketing remark (452 chars)
Rock Cliff Cottage! Exciting opportunity to own a home or investment within walking distance to downtown, the Maury River, and Chessie Nature Trail access. This cottage is currently used divided as a 2 bedroom apartment and a studio apartment with 2 kitchens and two baths but could easily be converted back to single family residence. The home additionally has space for more parking and two private outdoor decks . Don't miss this unique cottage!
-
2019-10-23$88,000 452-char remark
Show marketing remark (452 chars)
Rock Cliff Cottage! Exciting opportunity to own a home or investment within walking distance to downtown, the Maury River, and Chessie Nature Trail access. This cottage is currently used divided as a 2 bedroom apartment and a studio apartment with 2 kitchens and two baths but could easily be converted back to single family residence. The home additionally has space for more parking and two private outdoor decks . Don't miss this unique cottage!
ⓘ Source: listings_history table (triggers on properties + properties_extension) + one-shot
backfill from property_details.listing_events for pre-trigger history.
Tax reassessment forecast VA · Resets to sale price
- Current annual tax
- $720 · $60/mo
- Projected year-2 tax
- $1,517 · $126/mo
- Expected delta
- +$797/yr (+$66/mo · 110.7%)
ⓘ Screening estimate from a state-policy table — verify with the county assessor before closing.
Nearby sold comps map
Loading sold comps map…
Walkable amenities ~0.75 mi
Loading nearby amenities…
Taxation est. · year 1
- Rental income
- $18,850
- − Mortgage interest
- −$10,363
- − Property taxes
- −$720
- − Insurance
- −$925
- − Repairs & maintenance
- −$1,508
- − Management
- −$1,508
- − Depreciation
- −$5,382
- Taxable loss
- −$1,555
- Est. tax savings @ 24.0%
- +$373
- After-tax cash flow
- $1,978/yr
For passive investors: Depreciation is non-cash, so a rental often shows a tax loss while cash-flowing — sheltering income. Rental losses are passive: they offset passive income freely, and up to $25,000/yr can offset ordinary (W-2) income if you actively participate and your MAGI is under $100k (phasing out to $0 by $150k); unused losses carry forward. On sale, claimed depreciation is recaptured at up to 25%, and gains may owe capital-gains tax (a 1031 exchange can defer both). Figures are a year-1 estimate at your 24.0% rate — not tax advice; consult a CPA.
Schools (NCES district)
- District
- Rockbridge County Public School District
- NCES district ID
- 5103370
- Math proficiency
- 43% ▼ -41.00%
- Reading proficiency
- 67% ▼ -12.00%
- Median HH income
- $48,021
- Composite
- 46.65/100
- National rank
- #2408
- State rank
- #80 of 131 in VA
Livability — East Lexington
- Score
- 71/100
- State rank
- #218
- US rank
- #7157
Category grades
Schools grade is shown separately in the Schools card above.
Census & demographics
- Census place
- East Lexington, VA
- County
- Rockbridge County · 17,714 people
- Metro
- nan
- Population (ZIP)
- 17,714
- Household income
- $76,587
- Rent vs Own
- Severe rent burden
- 429.0
Population outlook (Rockbridge County) Hauer SSP2
- Today (2025)
- 22,549 people
- By 2030
- 22,381 · -0.7%
- By 2040
- 21,488 · -4.7%
- By 2050
- 20,054 · -11.1%
- By 2075
- 16,228 · -28.0%
- By 2100
- 11,598 · -48.6%
Race, ethnicity, and origin ACS 2023
- Neighborhood character
- Predominantly White (86%)
- Race & ethnicity
- White 86% Two or more races 5% Black 4% Hispanic / Latino 3% Asian 2%
- Common ancestry
- Serbian 4% Italian 2% Slovak 2%
- Foreign-born
- 4% · China, Canada, South Korea
- Languages at home
- 95% English-only · Spanish 2% Chinese 1% Korean 1%
Political lean MEDSL · Rockbridge
- 2024 margin
- Solid R (+33.8) · D 32.6% · R 66.4%
- 2008→2024 swing
- -20.2pp toward R · 2008: -13.6pp · 2024: -33.8pp
- All cycles
- 2024: R+33.8 2020: R+32.4 2016: R+29.6 2012: R+17.8 2008: R+13.6
Not yet ingested
- Civics
- —
Market trends
- HPI YoY
- ▼ -83.84%
- Current HPI
- 283.7394
- Rent YoY
- —
- Metro
- nan
- State GDP YoY
- ▲ 2.40%
- F500 in state
- 50
Industry mix (Fortune 500 HQ in VA)
| Industry | F500 HQs | Revenue |
|---|---|---|
| Aerospace / Defense | 4 | $236B |
|
||
| Technology / Defense | 3 | $32B |
|
||
| Financial Services | 2 | $176B |
|
||
| Utilities | 2 | $27B |
|
||
| Insurance | 2 | $25B |
|
||
| Technology | 2 | $15B |
|
||
Price history
+110.2% since first listed10 events — show timeline
- 2026-04-26 Pending — RHR
- 2025-12-08 Relisted — RHR
- 2025-11-26 Pending — RHR
- 2025-11-21 Listed $185,000 RHR
- 2023-11-24 Rental Removed $625 APPFOLIO
- 2023-11-10 Listed for Rent $625 APPFOLIO
- 2022-08-12 Price Changed $575 APPFOLIO
- 2020-03-06 Sold (Public Records) $85,500 Public Records
- 2020-02-28 Sold (MLS) $85,500 RHR
- 2019-10-23 Listed $88,000 RHR
Property tax history
+1.8%/yrLatest (2025): $720 · +4.9% YoY. Source: county tax records.
Cash-flow waterfall
monthlySold comps — $/sqft
last 12 mo · ≤1 miLoading sold comps…