 Duplex
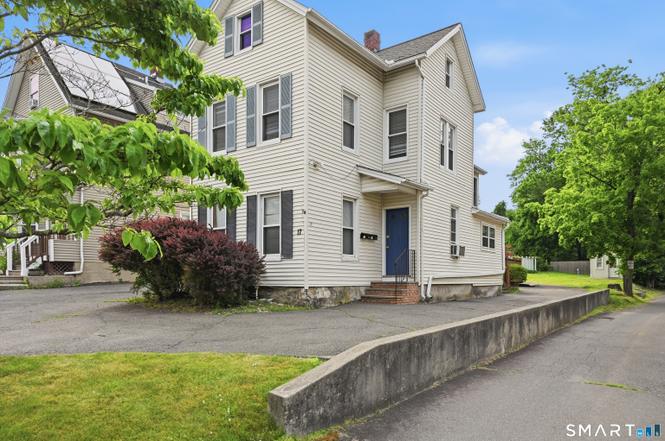
17 Lake Ave · Danbury, CT
Flood risk 1/10 · Minimal
- FEMA flood zone
- X (unshaded)
- Chance of flooding over 30 yrs
- 0.0%
- Est. flood insurance / yr
- $473 – $860
Fire risk 1/10 · Minimal
- Est. fire insurance / yr
- $829 – $1,539
Heat risk 5/10 · Moderate
- Hot days now (above 99°F)
- 7 days/yr
- Hot days in 30 yrs
- 16 days/yr
Wind risk 5/10 · Moderate
- Chance of severe wind over 30 yrs
- 26.0%
Air-quality risk 3/10 · Minor
- Unhealthy air days now
- 3 days/yr
- Unhealthy air days in 30 yrs
- 4 days/yr
Risk factors via First Street. Map © Google.
Why this score? — see what drove the C- grade
The composite is a weighted blend of 9 inputs, each scored 0–100. Each bar is that input's sub-score; the figure is the points it added to the 100-point composite (weight × sub-score).
- Cash flow +16.5/30.0
- ARV discount +14.6/15.0
- DSCR +5.1/10.0
- 1% rule +4.2/10.0
- Livability +3.8/5.0
- Rent growth +3.3/5.0
- Condition / age +2.5/5.0
- Schools +2.4/10.0
- Appreciation +0.0/10.0
$525,000
🖨 Deal sheet (PDF) 📄 Offer letter ✓ Due diligence
Multi-family units
County records classify this as Multi-Family (2-4 Unit). Listing-text estimate: 2 units. confirmed
Listing remarks MLS
Two Family Home In Central Danbury, 1 Br On Main Level 2 Br On Second Floor, Needs Work, All Separate Utilities, Verification Of Funds, Pre-Approval And Cmls Contract Form Needed For Submission. Off Street Parking
Key facts
- Oversized deck
- In-unit laundry
- Storage shed
Tags
Property features AI
Exterior
- Parking: Off-street parking including driveway; Total of 4 parking spaces
- Utilities: Public water connected; Public sewer connected; Natural gas service
- Home design: Multi-family property (2-family); Frame construction; White exterior
- Construction: Asphalt shingle roof; Vinyl siding; Masonry/stone foundation
- Exterior features: Level lot; Shed; Deck; Gutters; Exterior lighting; Private paved driveway
Interior
- Bedrooms: Three bedrooms (total for the property)
- Bathrooms: Two full bathrooms
- Heating & cooling: Hot air heating; Natural gas hot water
- Interior features: Nine total rooms; Full, unfinished basement with interior access; Attic with finished, floored storage space and walk-up access
- Laundry & utility: Laundry located within each unit; All units have laundry hook-ups
Neighborhood map
What this means for you Summary
Snapshot
- This is a 2 × 3-bed/2.0-bath units multifamily listed at $525k.
Deal economics
- At list price, monthly cash flow is $304 ($4k/yr) — positive. Per door: $152/mo.
- The deal already cash-flows at list — no discount required.
- To meet the 1% rule (rent ≥ 1% of price), the offer needs to be $482k (8.1% below list).
- Recommended offer: $482k (8.1% below list) — sets the bar for 1% rule.
- Cap rate 7.0% vs local median 3.6% in Danbury — top-decile yield for the area; either an underpriced asset or a hidden risk that comps aren't pricing in. Stress-test before assuming the spread holds.
Location & tenants
- Location reads 76/100 on livability (#51 in CT, #3,379 nationally) — a middle-class / working-renter tenant base. Strengths: commute A+, housing A+, health & safety A+; Watch: amenities F, cost of living F.
- Danbury School District (urban): math 19% / reading 32% proficiency, ranked #131 of 153 in CT (top 86%) — low school quality limits family demand, transient renter base, plan for 1-2y turnover.
- Zoned schools: Danbury High School (math 19% / reading 41%, grade F, #137 of 194 statewide, top 70%, 3,590 students, 48% FRL).
- Market conditions: Rents rising (+3.1%/yr); 200 active listings in the ZIP; 9 comparable units currently listed for rent nearby; rentals at typical pace (median 16d on market — plan ~3-4 weeks tenant-placement turnaround); solid renter incomes; 1,151 units permitted in Western Connecticut Planning Region in 2024 (714 in 5+ unit buildings).
- At $4,825/mo this rent would consume 75% of the median local household income ($77k/yr) (locally 3255% of renters already pay >50% of income on rent) — very limited rent-growth headroom before tenants either downsize or default.
Forward outlook
- Local home prices are declining (-3.0%/yr); year-one equity from $4k of loan paydown is wiped out by about $16k of value loss. Plan a longer hold.
Negotiation context
- Only 6 days on market — expect competitive offers; lowballing is unlikely to land.
- 8 sale attempts since 33y ago with the ask held roughly flat each time — persistent listings suggest the price (not the market) is what's stuck; bring a comps-based counter.
- Current owner paid $180k; list at $525k implies a 192% gain — meaningful room to come down on a strong offer.
Risks & watch-outs
- Watch-outs: built in 1900 — expect roof / HVAC / electrical / plumbing capex.
- Climate carrying-cost: moderate wind risk, 26% chance of damaging wind over 30y; extreme-heat days projected 7→16/yr by 2055 (HVAC capex compounding) — expect insurance premiums to compound above CPI over the hold.
Questions for the listing agent
- Can we see the unit-by-unit rent roll, current vacancy, and any below-market leases? What's the average tenancy length?
- What capital expenditures (roof, boiler, parking lot, exteriors) have been made in the last 5 years, and what's planned in the next 2?
- Built in 1900 — when were the roof, HVAC, electrical panel, plumbing, and water heater last replaced?
- Is there a deadline driving the sale (1031 exchange, divorce, estate, relocation)? That informs how much negotiation room exists.
- Schools are D-rated, which usually means shorter tenancies and higher turnover. Who's the typical renter profile here, and what's been the actual vacancy rate?
- What's the average days-on-market for RENTAL listings here right now (not sales)? A rising rental-DOM trend means longer vacancies and softer asking-rent achievability than the comps imply.
- What's the recent tenant-quality profile in this submarket — average credit score on applications, eviction rate, late-payment / NSF rate, and stable-employment percentage? A property-management company in the area should have these aggregated.
- How much new apartment / multifamily construction is in the pipeline within 1–3 miles? Heavy new supply (>2% of stock underway) typically softens rents 12–24 months out; light construction supports rent growth.
Investment metrics
- 1% rule
- 0.92% ✗
- Cap rate
- 6.99%
- Cash-on-cash
- 2.48%
- DSCR
- 1.11
- GRM
- 9.1
CMA / ARV
- ARV (on-the-fly)
- $623,360
- Comps found
- 3
Show comp detail 3 sales within ~0.75 mi
| Address | Dist | Beds/Ba | Sqft | Sold | Price | $/sf | Match |
|---|---|---|---|---|---|---|---|
| 35 Merrimac St | 0.35mi | 4/3.0 (+1) | 1,911 (-2%) | 9mo | $550,000 | $288 | 64 |
| 11 Roger Ave | 0.16mi | 4/2.0 (+1) | 1,664 (-15%) | 5mo | $640,000 | $385 | 59 |
| 2 Edgewood St | 0.51mi | 2/2.0 (-1) | 1,688 (-13%) | 10mo | $540,000 | $320 | 41 |
Match score weights: distance 35% · size 25% · config 20% · recency 20%. Top-matched comps best support the ARV.
Projected returns pro-forma
-3.0% appreciation · 3.08% rent growth · sell at horizon
- IRR
- -12.3%
- Equity multiple
- 0.56×
- Total profit
- $-65,312
- Equity at exit
- $78,279
- IRR
- -3.1%
- Equity multiple
- 0.79×
- Total profit
- $-30,334
- Equity at exit
- $45,392
Cash invested: $147,000 (down + closing). Projections, not guarantees.
Landlord ↔ Tenant lean methodology
- Overall (STATE)
- 27 Tenant-Leaning
- State Connecticut
- 27 Tenant-Leaning · D+7
- County
- — inherits STATE
- City
- — inherits STATE
ZIP-level market 06810
- Rents YoY
- 3.1%
- Active inventory
- 200
- Price-to-rent
- 18.1×
Monthly cashflow live
- Estimated rent
- $4,825 high interval (Pro) →
- Mortgage (P&I)
- −$2,753
- Tax from tax record
- −$536 /mo · $6,428/yr
- Insurance
- −$219
- HOA
- −$0
- Vacancy / Maint / Mgmt
- −$1,013
- Net cashflow
- $304
Break-even live
Sensitivity live
| Price | -10% $601 | -5% $453 | +0% $304 | +5% $156 | +10% $7 |
|---|---|---|---|---|---|
| Rent | -10% $-77 | -5% $114 | +0% $304 | +5% $495 | +10% $685 |
| Rate | -1.0pp $569 | -0.5pp $438 | base $304 | +0.5pp $168 | +1.0pp $30 |
2-unit breakdown (identical units grouped — click to expand)
| Units | Beds | Baths | Est. rent |
|---|---|---|---|
| 2× units | 3 | 2 | $4,826 |
| #1 | 3 | 2 | $2,413 |
| #2 | 3 | 2 | $2,413 |
| Total (2 units) | $4,825 | ||
UW: 25.0% down · 7.5% · 30yr · 1.5% tax · 5.0% vac · 8.0% maint · 8.0% mgmt
Financing live
Cash to close
- Down payment
- $131,250
- Closing costs
- $15,750
- Reserves months
- —
- Total cash needed
- —
Loan-product check · same deal, 3 products live
Conventional
25% down · 7.5% · 30yr
- Down + closing
- —
- Monthly P&I
- —
- Monthly cashflow
- —
- DSCR
- —
- Eligible?
- —
Personal DTI + credit; lowest rate.
DSCR
20% down · 8.5% · 30yr
- Down + closing
- —
- Monthly P&I
- —
- Monthly cashflow
- —
- DSCR
- —
- Eligible?
- —
No personal income docs; deal must DSCR.
Hard money
10% down · 12.0% · 12mo
- Down + closing
- —
- Monthly P&I
- —
- Monthly cashflow
- —
- DSCR
- —
- Eligible?
- —
Short-term bridge; refi at stabilization.
Rent comps 9 comps
| Address | Beds | Baths | Sqft | Rent | $/sqft | DOM | Units | Dist |
|---|---|---|---|---|---|---|---|---|
| 8 Rose St Unit 24-6 Danbury, CT | 2.0 | 1.5 | 1285 | $2,300 | $1.79 | 21d | 1 | 0.64mi |
| 8 Rose St Unit 26-14 Danbury, CT | 3.0 | 1.5 | 1370 | $3,000 | $2.19 | 5d | 1 | 0.64mi |
| 22 Irving Pl Danbury, CT | 3.0 | 1.0 | 1995 | $3,000 | $1.50 | 25d | 1 | 0.64mi |
| 12 Irving Pl Unit A Danbury, CT | 3.0 | 1.5 | 2500 | $2,700 | $1.08 | 13d | 1 | 0.65mi |
| 68 Grand St Danbury, CT | 3.0 | 1.0 | 1480 | $1,900 | $1.28 | 4d | 1 | 0.85mi |
| 38 Starr Ave Danbury, CT | 2.0 | 1.0 | 1948 | $2,250 | $1.16 | 45d | 1 | 0.86mi |
| 15 Scuppo Rd #1504 Danbury, CT | 2.0 | 1.5 | 2025 | $2,800 | $1.38 | 45d | 1 | 0.88mi |
| 6 Barnum Ct #6 Danbury, CT | 3.0 | 2.5 | 1620 | $3,200 | $1.98 | 16d | 1 | 0.94mi |
| 10 Clapboard Ridge Rd Danbury, CT | 1.0–3.0 | 1.0–2.0 | 1061 | $3,308 | $3.12 | 4d | 20 | 1.02mi |
Listing history 5 events
-
2026-06-22days on market $525,000 Active 6 DOM
-
2026-06-18days on market $525,000 Active 3 DOM
-
2026-06-17days on market $525,000 Active 2 DOM
-
2026-06-15remarks 699-char remark
-
2026-06-15$525,000 Active 1 DOM
ⓘ Source: listings_history table (triggers on properties + properties_extension) + one-shot
backfill from property_details.listing_events for pre-trigger history.
Tax reassessment forecast CT · Partial reset (capped growth)
- Current annual tax
- $6,428 · $536/mo
- Projected year-2 tax
- $8,832 · $736/mo
- Expected delta
- +$2,404/yr (+$200/mo · 37.4%)
ⓘ Screening estimate from a state-policy table — verify with the county assessor before closing.
Climate risk First Street
- Flood 1/10 Low FEMA zone X (unshaded) · 0% chance over 30 yrs
- Wildfire 1/10 Low
- Heat 5/10 Major 7 d/yr ≥99°F today · 16 d/yr by 30 yrs out
- Wind 5/10 Major 26% chance of damaging wind over 30 yrs
- Air quality 3/10 Moderate 3 unhealthy d/yr today · 4 by 30 yrs out
Nearby sold comps map
Loading sold comps map…
Walkable amenities ~0.75 mi
Loading nearby amenities…
Taxation est. · year 1
- Rental income
- $57,900
- − Mortgage interest
- −$29,408
- − Property taxes
- −$6,428
- − Insurance
- −$2,625
- − Repairs & maintenance
- −$4,632
- − Management
- −$4,632
- − Depreciation
- −$15,273
- Taxable loss
- −$5,098
- Est. tax savings @ 24.0%
- +$1,223
- After-tax cash flow
- $4,874/yr
For passive investors: Depreciation is non-cash, so a rental often shows a tax loss while cash-flowing — sheltering income. Rental losses are passive: they offset passive income freely, and up to $25,000/yr can offset ordinary (W-2) income if you actively participate and your MAGI is under $100k (phasing out to $0 by $150k); unused losses carry forward. On sale, claimed depreciation is recaptured at up to 25%, and gains may owe capital-gains tax (a 1031 exchange can defer both). Figures are a year-1 estimate at your 24.0% rate — not tax advice; consult a CPA.
Schools (NCES district)
- District
- Danbury School District
- NCES district ID
- 0901020
- Math proficiency
- 19% ▼ -17.00%
- Reading proficiency
- 32% ▼ -16.00%
- Median HH income
- $65,793
- Composite
- 23.93/100
- National rank
- #7784
- State rank
- #131 of 153 in CT
Livability — Danbury
- Score
- 76/100
- State rank
- #51
- US rank
- #3379
Category grades
Schools grade is shown separately in the Schools card above.
Census & demographics
- Census place
- Danbury, CT
- County
- Fairfield County · 765,532 people
- City population
- 87,061
- Metro
- Bridgeport-Stamford-Norwalk, CT
- Population (ZIP)
- 55,833
- Household income
- $76,933
- Rent vs Own
- Severe rent burden
- 3255.0
Population outlook (Western Connecticut County) Hauer SSP2
- By 2040
- 685,031
Race, ethnicity, and origin ACS 2023
- Neighborhood character
- Highly diverse neighborhood (Simpson 0.72)
- Race & ethnicity
- Hispanic / Latino 37% White 35% Two or more races 19% Black 12% Asian 5%
- Hispanic origin (detail)
- Mexican 4% Puerto Rican 3% Dominican 6%
- Common ancestry
- Estonian 8% Russian 4% Romanian 3%
- Foreign-born
- 41% · Canada, Jamaica, Dominican Republic
- Languages at home
- 48% English-only · Spanish 32% Other Indo-European 16% Other Asian/Pacific 1%
Political lean MEDSL · Western Connecticut
- 2024 margin
- D (+19.1) · D 58.8% · R 39.7% · Other 1.6%
- All cycles
- 2024: D+19.1
Not yet ingested
- Civics
- —
Market trends
- HPI YoY
- ▼ -309.71%
- Current HPI
- 286.5484
- Rent YoY
- ▲ 3.08%
- Metro
- Bridgeport-Stamford-Norwalk, CT
- State GDP YoY
- ▲ 1.06%
- F500 in state
- 38
Industry mix (Fortune 500 HQ in CT)
| Industry | F500 HQs | Revenue |
|---|---|---|
| Industrial Machinery | 4 | $38B |
|
||
| Insurance | 3 | $71B |
|
||
| Financial Services | 2 | $25B |
|
||
| Transportation / Logistics | 2 | $18B |
|
||
| Healthcare | 1 | $247B |
|
||
| Telecommunications | 1 | $55B |
|
||
Price history
+208.8% since first listed20 events — show timeline
- 2026-06-15 Listed $525,000 Smart MLS
- 2012-12-27 Sold (MLS) $180,000 Smart MLS
- 2012-03-13 Listed $225,000 Smart MLS
- 2007-12-17 Listing Removed — Smart MLS
- 2007-02-06 Listed $498,000 Smart MLS
- 2006-11-21 Listing Removed — Smart MLS
- 2006-04-14 Listed $525,000 Smart MLS
- 2004-08-30 Sold (Public Records) $358,000 Public Records
- 2004-08-27 Sold (MLS) $358,000 Smart MLS
- 2004-07-02 Listed $360,000 Smart MLS
- 2002-11-18 Sold (Public Records) $275,000 Public Records
- 2002-11-18 Sold (MLS) $275,000 Smart MLS
- 2002-07-11 Listed $280,000 Smart MLS
- 1995-01-18 Sold (Public Records) $165,000 Public Records
- 1995-01-18 Sold (MLS) $165,000 Smart MLS
- 1994-07-26 Listed $168,500 Smart MLS
- 1993-12-30 Sold (Public Records) $55,000 Public Records
- 1993-12-17 Sold (MLS) $55,000 Smart MLS
- 1993-09-20 Listed $99,900 Smart MLS
- 1990-08-03 Sold (Public Records) $170,000 Public Records
Property tax history
+6.8%/yrLatest (2023): $6,428 · +35.8% YoY. Source: county tax records.
Cash-flow waterfall
monthlySold comps — $/sqft
last 12 mo · ≤1 miLoading sold comps…