4521&4535 N Nc 242 Hwy · Roseboro, NC
Flood risk 7/10 · Major
- FEMA flood zone
- X (unshaded)
- Chance of flooding over 30 yrs
- 0.99%
- Est. flood insurance / yr
- $507 – $1,088
Fire risk 6/10 · Moderate
- Est. fire insurance / yr
- $906 – $1,684
Heat risk 7/10 · Major
- Hot days now (above 106°F)
- 7 days/yr
- Hot days in 30 yrs
- 16 days/yr
Wind risk 8/10 · Major
- Chance of severe wind over 30 yrs
- 80.0%
Air-quality risk 1/10 · Minimal
- Unhealthy air days now
- 0 days/yr
- Unhealthy air days in 30 yrs
- 0 days/yr
Risk factors via First Street. Map © Google.
Why this score? — see what drove the B grade
The composite is a weighted blend of 9 inputs, each scored 0–100. Each bar is that input's sub-score; the figure is the points it added to the 100-point composite (weight × sub-score).
- Cash flow +27.2/30.0
- DSCR +9.4/10.0
- Appreciation +9.1/10.0
- ARV discount +7.5/15.0
- 1% rule +7.4/10.0
- Schools +3.1/10.0
- Livability +3.1/5.0
- Rent growth +2.5/5.0
- Condition / age +2.2/5.0
$155,000
🖨 Deal sheet (PDF) 📄 Offer letter ✓ Due diligence
Listing remarks
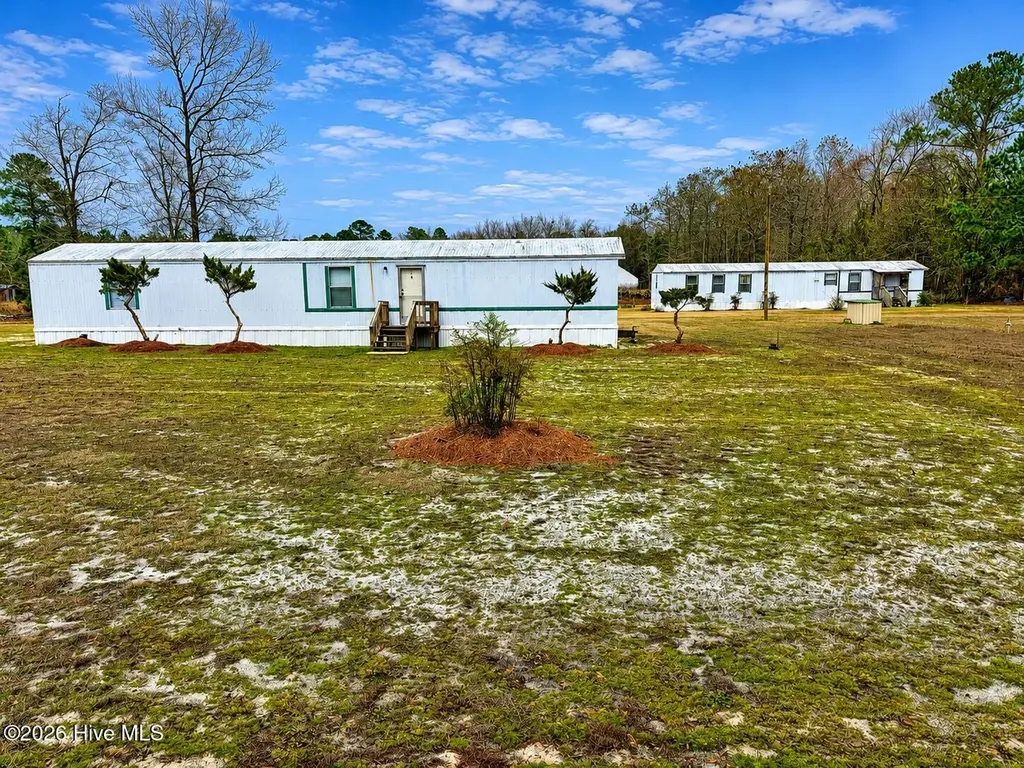
Excellent investment opportunity!! This property includes two well-maintained single-wide manufactured homes situated on approximately 3.5 acres, both currently occupied and generating a combined $1,600/month in rental income. Tenants are in place, offering immediate cash flow from day one. The property features two private wells, with one serving as a backup well for added security and reliability. Both homes are equipped with central heating and air, and one of the mobile homes recently had new flooring installed, reflecting ongoing maintenance and care. Being sold as-is and priced for investors! Don't miss a chance to secure income-producing property with land in Cumberland County
Key facts
- Private wells
- Central heating
- Air conditioning
Tags
Property features AI
Finance
- Other: Property is zoned Agricultural; Lot approximately 3.5 acres (326 x 530 x 270 x 530); Road frontage on city street and state road; Directions: Leave Roseboro on highway 242 toward Elizabethtown; property is approx. 8 miles on the left at the intersection of highway 210.
- Financial info: Tax amount not included per instructions
- HOA & community: Not in a subdivision
Exterior
- Parking: On-site parking
- Security: Security features not provided
- Utilities: Water available; Utility details otherwise not provided
- Home design: Manufactured home (residential); One level / single-story; Entry level: 1; Facing direction not provided
- Construction: Aluminum siding and frame construction; Other foundation type; Year built not provided
- Exterior features: Front porch; No fencing; Other roof type; Water available
Interior
- Kitchen: Kitchen details not provided
- Bedrooms: Bedrooms information not provided
- Flooring: Flooring details not provided
- Bathrooms: 2 full bathrooms
- Heating & cooling: Central Air; Electric heat with heat pump
- Interior features: Central air conditioning; Electric heating with heat pump; 7 total rooms; Has a view
- Laundry & utility: Laundry/utility details not provided
Neighborhood map
What this means for you Summary
Snapshot
- This is a 3-bed/2.0-bath manufactured listed at $155k. Condition is rated fair.
Deal economics
- At list price, monthly cash flow is $376 ($5k/yr) — positive.
- The deal already cash-flows at list — no discount required.
- Meets the 1% rule at list price ($2k rent vs $155k).
- Cap rate 9.7% vs local median 7.6% in Roseboro — meaningfully above typical; check what's discounted (condition, days-on-market, listing class) to confirm the premium yield is real.
Location & tenants
- Location reads 62/100 on livability (#445 in NC) — a middle-class / working-renter tenant base. Strengths: cost of living A+, crime A, housing A-; Watch: amenities F, commute F, employment F.
- Cumberland County Schools (urban): math 32% / reading 41% proficiency, ranked #126 of 178 in NC (top 71%) — families likely to look elsewhere, expect single-tenant / working-renter base with shorter leases.
- Zoned schools: Beaver Dam Elementary (math 70% / reading 70%, grade A-, #95 of 1,410 statewide, top 7%, 86 students, 96% FRL); Hope Mills Middle (math 27% / reading 34%, grade F, #331 of 475 statewide, top 70%, 514 students, 99% FRL) — zoned schools average 98% FRL vs 55% district-wide (43 pts higher); higher-poverty schools than district average — tighter screening recommended.
- Zoned-school proficiency averages 50% at this address vs 36% district-wide (+14 pts) — the actual schools serving this property are materially stronger than the Cumberland County Schools average implies; a family-tenant draw the district grade alone would hide.
- Market conditions: 42 active listings in the ZIP; 1,125 units permitted in Cumberland County in 2024 (104 in 5+ unit buildings).
Forward outlook
- In year one you build about $14k of equity ($1k loan paydown + $13k appreciation (8.3% local appreciation)).
- At projected returns (8.3% appreciation + 3.0% rent growth), your $43k cash investment doubles in ~3 years — after that, you're playing with house money.
- By year 3, paydown + projected appreciation supports a ~$35k cash-out refi (75% LTV) — recoverable capital for the next deal without selling this one.
Negotiation context
- Only 4 days on market — expect competitive offers; lowballing is unlikely to land.
Risks & watch-outs
- Watch-outs: flood insurance adds $66/mo.
- Climate carrying-cost: major flood risk; severe wind risk, 80% chance of damaging wind over 30y; major wildfire risk; extreme-heat days projected 7→16/yr by 2055 (HVAC capex compounding) — expect insurance premiums to compound above CPI over the hold.
Questions for the listing agent
- Have any recent inspections been done? Can we get a copy of the seller's disclosures and any deferred-maintenance estimates?
- What's the actual annual flood-insurance premium (NFIP or private), and is the property in a SFHA with mandatory coverage?
- Is there a deadline driving the sale (1031 exchange, divorce, estate, relocation)? That informs how much negotiation room exists.
- Schools are D-rated, which usually means shorter tenancies and higher turnover. Who's the typical renter profile here, and what's been the actual vacancy rate?
- What's the average days-on-market for RENTAL listings here right now (not sales)? A rising rental-DOM trend means longer vacancies and softer asking-rent achievability than the comps imply.
- What's the recent tenant-quality profile in this submarket — average credit score on applications, eviction rate, late-payment / NSF rate, and stable-employment percentage? A property-management company in the area should have these aggregated.
- How much new for-sale + rental construction is in the pipeline within 1–3 miles? Heavy new supply typically softens prices + rents 12–24 months out; constrained supply supports both.
Investment metrics
- 1% rule
- 1.24% ✓
- Cap rate
- 9.72%
- Cash-on-cash
- 12.24%
- DSCR
- 1.54
- GRM
- 6.7
CMA / ARV
No comps found within radius.
Projected returns pro-forma
8.27% appreciation · 3.0% rent growth · sell at horizon
- IRR
- 28.6%
- Equity multiple
- 3.09×
- Total profit
- $90,563
- Equity at exit
- $120,612
- IRR
- 25.5%
- Equity multiple
- 6.65×
- Total profit
- $245,246
- Equity at exit
- $242,188
Cash invested: $43,400 (down + closing). Projections, not guarantees.
Landlord ↔ Tenant lean methodology
- Overall (STATE)
- 85 Strongly Landlord-Friendly
- State North Carolina
- 85 Strongly Landlord-Friendly · R+3
- County
- — inherits STATE
- City
- — inherits STATE
ZIP-level market 28382
- Home prices YoY
- 3.0%
- Active inventory
- 42
- Price-to-rent
- 6.7×
Monthly cashflow live
- Estimated rent
- $1,916 medium interval (Pro) →
- Mortgage (P&I)
- −$813
- Tax est. 1.5%
- −$194 /mo · $2,325/yr
- Insurance
- −$65
- Flood insurance flood zone
- −$66 /mo · $798/yr
- HOA
- −$0
- Vacancy / Maint / Mgmt
- −$402
- Net cashflow
- $376
Break-even live
Sensitivity live
| Price | -10% $483 | -5% $430 | +0% $376 | +5% $323 | +10% $269 |
|---|---|---|---|---|---|
| Rent | -10% $225 | -5% $300 | +0% $376 | +5% $452 | +10% $528 |
| Rate | -1.0pp $454 | -0.5pp $416 | base $376 | +0.5pp $336 | +1.0pp $295 |
UW: 25.0% down · 7.5% · 30yr · 1.5% tax · 5.0% vac · 8.0% maint · 8.0% mgmt
Financing live
Cash to close
- Down payment
- $38,750
- Closing costs
- $4,650
- Reserves months
- —
- Total cash needed
- —
Loan-product check · same deal, 3 products live
Conventional
25% down · 7.5% · 30yr
- Down + closing
- —
- Monthly P&I
- —
- Monthly cashflow
- —
- DSCR
- —
- Eligible?
- —
Personal DTI + credit; lowest rate.
DSCR
20% down · 8.5% · 30yr
- Down + closing
- —
- Monthly P&I
- —
- Monthly cashflow
- —
- DSCR
- —
- Eligible?
- —
No personal income docs; deal must DSCR.
Hard money
10% down · 12.0% · 12mo
- Down + closing
- —
- Monthly P&I
- —
- Monthly cashflow
- —
- DSCR
- —
- Eligible?
- —
Short-term bridge; refi at stabilization.
Listing history 5 events
-
2026-06-02days on market $155,000 Active 4 DOM
-
2026-06-01days on market $155,000 Active 3 DOM
-
2026-05-31days on market $155,000 Active 2 DOM
-
2026-05-30remarks 699-char remark
-
2026-05-30$155,000 Active 1 DOM
ⓘ Source: listings_history table (triggers on properties + properties_extension) + one-shot
backfill from property_details.listing_events for pre-trigger history.
Climate risk First Street
- Flood 7/10 Severe FEMA zone X (unshaded) · 99% chance over 30 yrs
- Wildfire 6/10 Major
- Heat 7/10 Severe 7 d/yr ≥106°F today · 16 d/yr by 30 yrs out
- Wind 8/10 Severe 80% chance of damaging wind over 30 yrs
- Air quality 1/10 Low 0 unhealthy d/yr today · 0 by 30 yrs out
Nearby sold comps map
Loading sold comps map…
Walkable amenities ~0.75 mi
Loading nearby amenities…
Taxation est. · year 1
- Rental income
- $22,994
- − Mortgage interest
- −$8,682
- − Property taxes
- −$2,325
- − Insurance
- −$1,572
- − Repairs & maintenance
- −$1,840
- − Management
- −$1,840
- − Depreciation
- −$4,509
- Taxable income
- $2,226
- Est. tax owed @ 24.0%
- −$534
- After-tax cash flow
- $3,980/yr
For passive investors: Depreciation is non-cash, so a rental often shows a tax loss while cash-flowing — sheltering income. Rental losses are passive: they offset passive income freely, and up to $25,000/yr can offset ordinary (W-2) income if you actively participate and your MAGI is under $100k (phasing out to $0 by $150k); unused losses carry forward. On sale, claimed depreciation is recaptured at up to 25%, and gains may owe capital-gains tax (a 1031 exchange can defer both). Figures are a year-1 estimate at your 24.0% rate — not tax advice; consult a CPA.
Condition & rehab AI · 1 photo
This property offers a fair condition with moderate rehabilitation needs, primarily focusing on exterior repairs and landscaping improvements to enhance its resale and rental value.
Repairs flagged
- Major exterior siding — The siding is visibly weathered and in need of replacement.
- Major flooring — One home has new flooring, while the other likely needs replacement.
- Major landscaping — The landscaping is sparse and in need of improvement.
Value-add opportunities
- Both repair and paint exterior siding — Improves curb appeal and property value.
- Both replace flooring in one home — Enhances interior condition and rental appeal.
- Both landscaping improvements — Enhances curb appeal and property value.
- Rental HVAC maintenance — Ensures comfort and reduces maintenance costs for tenants.
Renovation cost estimate screening
| Repair item | Severity | Est. cost |
|---|---|---|
| exterior siding · The siding is visibly weathered and in need of replacement. | Major | $15,000–50,000 |
| flooring · One home has new flooring, while the other likely needs replacement. | Major | $15,000–50,000 |
| landscaping · The landscaping is sparse and in need of improvement. | Major | $15,000–50,000 |
| Total estimated repair cost · 3 items | $45,000–150,000 |
Value-add ROI direction
- Both repair and paint exterior siding — Improves curb appeal and property value. ↑
- Both replace flooring in one home — Enhances interior condition and rental appeal. ↑
- Both landscaping improvements — Enhances curb appeal and property value. ↑
- Rental HVAC maintenance — Ensures comfort and reduces maintenance costs for tenants. ↑
ⓘ Cost ranges are severity-bucket heuristics (US national rule-of-thumb). Get contractor quotes + a written scope before underwriting a rehab budget.
Schools (NCES district)
- District
- Cumberland County Schools
- NCES district ID
- 3700011
- Math proficiency
- 32% ▼ -2.00%
- Reading proficiency
- 41% ▼ -1.00%
- Median HH income
- $44,168
- Composite
- 31.0/100
- National rank
- #6096
- State rank
- #126 of 178 in NC
Livability — Roseboro
- Score
- 62/100
- State rank
- #445
- US rank
- #16397
Category grades
Schools grade is shown separately in the Schools card above.
Census & demographics
- Population (ZIP)
- 6,659
Population outlook (Cumberland County) Hauer SSP2
- Today (2025)
- 330,855 people
- By 2030
- 333,523 · +0.8%
- By 2040
- 335,583 · +1.4%
- By 2050
- 335,325 · +1.4%
- By 2075
- 342,853 · +3.6%
- By 2100
- 340,698 · +3.0%
Race, ethnicity, and origin ACS 2023
- Neighborhood character
- Diverse neighborhood (Simpson 0.58)
- Race & ethnicity
- White 60% Black 22% Hispanic / Latino 14% Two or more races 11%
- Hispanic origin (detail)
- Mexican 2%
- Common ancestry
- Slovak 2% Romanian 1% Serbian 1%
- Foreign-born
- 9% · Canada
- Languages at home
- 87% English-only · Spanish 12% Other Asian/Pacific 1%
Political lean MEDSL · Cumberland
- 2024 margin
- D (+13.4) · D 56.1% · R 42.7% · Other 1.2%
- 2008→2024 swing
- -4.3pp toward R · 2008: 17.7pp · 2024: 13.4pp
- All cycles
- 2024: D+13.4 2020: D+16.6 2016: D+16.0 2012: D+19.7 2008: D+17.7
Not yet ingested
- Civics
- —
Market trends
- HPI YoY
- ▲ 8.27%
- Current HPI
- 288.151
- Rent YoY
- —
- Metro
- —
- State GDP YoY
- ▲ 3.28%
- F500 in state
- 26
Industry mix (Fortune 500 HQ in NC)
| Industry | F500 HQs | Revenue |
|---|---|---|
| Financial Services | 2 | $213B |
|
||
| Retail | 2 | $95B |
|
||
| Industrial Conglomerate | 1 | $38B |
|
||
| Metals / Steel | 1 | $35B |
|
||
| Utilities | 1 | $30B |
|
||
| Industrial Machinery | 1 | $19B |
|
||
Price history
1 event — show timeline
- 2026-05-19 Listed $155,000 Hive MLS
Cash-flow waterfall
monthlySold comps — $/sqft
last 12 mo · ≤1 miLoading sold comps…