 🏗️ New Construction
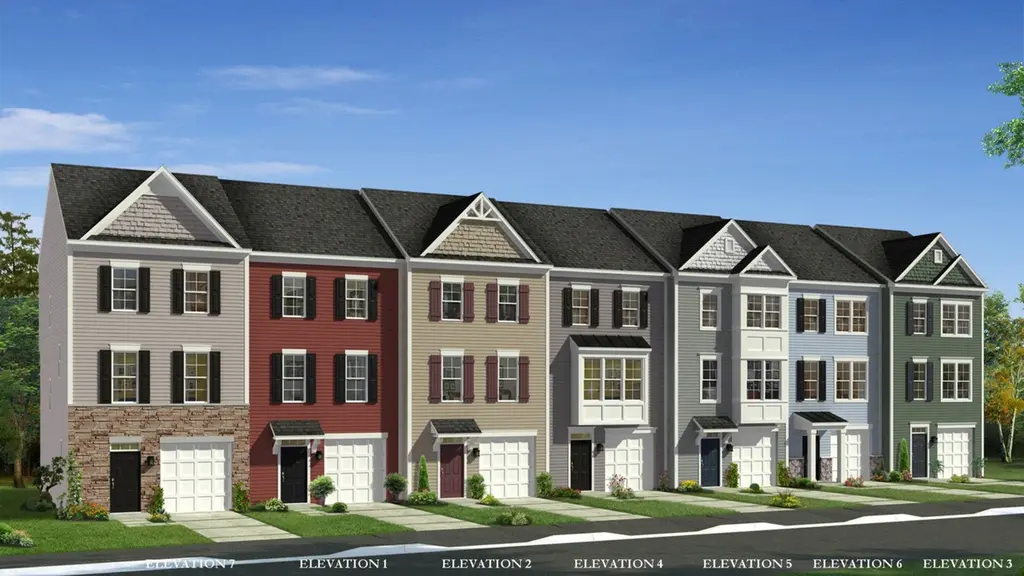
Deep Creek II - Garage Plan Plan · Charles Town, WV
Flood risk 1/10 · Minimal
- FEMA flood zone
- X (unshaded)
- Chance of flooding over 30 yrs
- 0.0%
- Est. flood insurance / yr
- $507 – $1,088
Fire risk 3/10 · Minor
- Est. fire insurance / yr
- $787 – $1,461
Heat risk 5/10 · Moderate
- Hot days now (above 103°F)
- 7 days/yr
- Hot days in 30 yrs
- 16 days/yr
Wind risk 2/10 · Minimal
- Chance of severe wind over 30 yrs
- 3.0%
Air-quality risk 2/10 · Minimal
- Unhealthy air days now
- 1 days/yr
- Unhealthy air days in 30 yrs
- 1 days/yr
Risk factors via First Street. Map © Google.
Why this score? — see what drove the D- grade
The composite is a weighted blend of 9 inputs, each scored 0–100. Each bar is that input's sub-score; the figure is the points it added to the 100-point composite (weight × sub-score).
- Cash flow +7.9/30.0
- ARV discount +7.5/15.0
- Appreciation +6.3/10.0
- Livability +3.8/5.0
- Rent growth +3.6/5.0
- Schools +3.4/10.0
- Condition / age +2.5/5.0
- 1% rule +2.4/10.0
- DSCR +2.0/10.0
$304,990
🖨 Deal sheet (PDF) 📄 Offer letter ✓ Due diligence
Listing remarks
The Deep Creek II offers open living spaces paired with flexible design option to suit your lifestyle. With seamless flow between the kitchen and main living areas, this home is built for both everyday living and entertaining. Optional features allow you to personalize the space to fit your needs. Home Features Attached 1-car garage or optional flex space Open -concept country kitchen with optional isalnd Alternate main-level layout available Optional study and fireplace Owner's suite with generous walk-in closet Owner's bath with dual vanity and seated shower Optional 4-foot rear extension Finished basement options available
Key facts
- Owner's bath
- Dual vanity
- Owner's suite
Tags
Property features AI
Finance
- Financial info: List price $304,990
Exterior
- Home design: New construction plan; Located in Charles Town, WV
- Exterior features: Living area approximately 2,060
Interior
- Bedrooms: 3 bedrooms
- Bathrooms: 2 full bathrooms and 1 half bathroom (2.5 total)
- Interior features: Plan home (Deep Creek II - Garage Plan)
Neighborhood map
What this means for you Summary
Snapshot
- This is a 3-bed/2.5-bath townhouse listed at $305k.
Deal economics
- At list price, monthly cash flow is $-338 ($-4k/yr) — negative.
- To cash-flow at today's rent, offer at most $270k (11.4% below list).
- To meet the 1% rule (rent ≥ 1% of price), the offer needs to be $236k (22.5% below list).
- Recommended offer: $236k (22.5% below list) — sets the bar for 1% rule.
- Cap rate 5.0% vs local median 3.4% in Charles Town — top-decile yield for the area; either an underpriced asset or a hidden risk that comps aren't pricing in. Stress-test before assuming the spread holds.
Location & tenants
- Location reads 76/100 on livability (#22 in WV, #3,460 nationally) — a middle-class / working-renter tenant base. Strengths: crime A+, housing A+, health & safety A+; Watch: schools D+, amenities D+, commute F.
- Jefferson County Schools (rural): math 29% / reading 46% proficiency, ranked #6 of 55 in WV (top 11%) — families likely to look elsewhere, expect single-tenant / working-renter base with shorter leases.
- Market conditions: Rents rising fast (+4.3%/yr); 382 active listings in the ZIP; 14 comparable units currently listed for rent nearby; rentals at typical pace (median 25d on market — plan ~3-4 weeks tenant-placement turnaround); solid renter incomes; 1,162 units permitted in Jefferson County in 2024 (360 in 5+ unit buildings).
Forward outlook
- In year one you build about $11k of equity ($2k loan paydown + $9k appreciation (2.7% local appreciation)).
- Jefferson County population projected at +13% by 2050 — modest demand growth; plan on rents tracking national, not racing it.
- By year 4, paydown + projected appreciation supports a ~$37k cash-out refi (75% LTV) — recoverable capital for the next deal without selling this one.
Negotiation context
- It's been on market 62 days — a 6% lower offer ($287k) is reasonable based on typical stale-listing flexibility.
Risks & watch-outs
- Climate carrying-cost: extreme-heat days projected 7→16/yr by 2055 (HVAC capex compounding) — expect insurance premiums to compound above CPI over the hold.
Questions for the listing agent
- What do current leases actually rent for vs. the listed asking? Can we see a recent rent roll and the last 12 months of T-12 income?
- It's been on market 62 days. Have you received any prior offers? Is the seller open to a 22% concession, seller financing, or rate buy-down credit?
- Why hasn't it sold? Are there any deal-killer items the seller is aware of (foundation, flood, title, zoning, code violations)?
- Is there a deadline driving the sale (1031 exchange, divorce, estate, relocation)? That informs how much negotiation room exists.
- Schools are D-rated, which usually means shorter tenancies and higher turnover. Who's the typical renter profile here, and what's been the actual vacancy rate?
- The area grade is low — what's the realistic commute time and amenity access for the typical tenant pool here? Any planned neighborhood developments (good or bad) we should know about?
- What's the average days-on-market for RENTAL listings here right now (not sales)? A rising rental-DOM trend means longer vacancies and softer asking-rent achievability than the comps imply.
- What's the recent tenant-quality profile in this submarket — average credit score on applications, eviction rate, late-payment / NSF rate, and stable-employment percentage? A property-management company in the area should have these aggregated.
- How much new for-sale + rental construction is in the pipeline within 1–3 miles? Heavy new supply typically softens prices + rents 12–24 months out; constrained supply supports both.
Investment metrics
- 1% rule
- 0.74% ✗
- Cap rate
- 5.02%
- Cash-on-cash
- -4.54%
- DSCR
- 0.80
- GRM
- 11.3
CMA / ARV
- ARV (on-the-fly)
- $319,300
- Comps found
- 12
Show comp detail 12 sales within ~0.75 mi
| Address | Dist | Beds/Ba | Sqft | Sold | Price | $/sf | Match |
|---|---|---|---|---|---|---|---|
| 621 Lord Fairfax St | 0.43mi | 3/2.5 | 2,068 (+0%) | 2mo | $320,000 | $155 | 77 |
| 233 Union Ridge Dr | 0.35mi | 3/3.0 | 2,108 (+2%) | 2mo | $359,000 | $170 | 76 |
| 759 Lord Fairfax St | 0.39mi | 3/3.5 | 2,100 (+2%) | 3mo | $335,000 | $160 | 72 |
| 793 Lord Fairfax St | 0.54mi | 3/3.5 | 2,106 (+2%) | 4mo | $359,990 | $171 | 63 |
| 37 Abigail St | 0.52mi | 3/3.5 | 2,123 (+3%) | 6mo | $305,000 | $144 | 62 |
| 638 Newbury St | 0.57mi | 3/3.5 | 2,106 (+2%) | 6mo | $349,990 | $166 | 60 |
| 45 Abigail St | 0.53mi | 3/3.5 | 2,169 (+5%) | 4mo | $310,000 | $143 | 59 |
| 11 Abigail St | 0.50mi | 3/3.5 | 2,235 (+8%) | 4mo | $334,990 | $150 | 55 |
| 33 Abigail St | 0.52mi | 3/3.5 | 2,235 (+8%) | 6mo | $332,249 | $149 | 52 |
| 75 Abigail St | 0.55mi | 3/3.5 | 2,233 (+8%) | 7mo | $320,000 | $143 | 51 |
| 83 Abigail St | 0.56mi | 3/3.5 | 2,233 (+8%) | 7mo | $320,000 | $143 | 50 |
| 71 Abigail St | 0.55mi | 3/3.5 | 1,810 (-12%) | 7mo | $290,000 | $160 | 45 |
Match score weights: distance 35% · size 25% · config 20% · recency 20%. Top-matched comps best support the ARV.
Projected returns pro-forma
2.67% appreciation · 4.35% rent growth · sell at horizon
- IRR
- 2.9%
- Equity multiple
- 1.16×
- Total profit
- $14,749
- Equity at exit
- $137,761
- IRR
- 7.1%
- Equity multiple
- 2.06×
- Total profit
- $94,656
- Equity at exit
- $207,895
Cash invested: $89,404 (down + closing). Projections, not guarantees.
Landlord ↔ Tenant lean methodology
- Overall (STATE)
- 83 Strongly Landlord-Friendly
- State West Virginia
- 83 Strongly Landlord-Friendly · R+22
- County
- — inherits STATE
- City
- — inherits STATE
ZIP-level market 25414
- Home prices YoY
- 0.9%
- Rents YoY
- 4.3%
- Active inventory
- 382
- Price-to-rent
- 10.7×
Monthly cashflow live
- Estimated rent
- $2,365 high interval (Pro) →
- Mortgage (P&I)
- −$1,674
- Tax est. 1.5%
- −$399 /mo · $4,790/yr
- Insurance
- −$133
- HOA
- −$0
- Vacancy / Maint / Mgmt
- −$497
- Net cashflow
- $-338
Break-even live
Sensitivity live
| Price | -10% $-118 | -5% $-228 | +0% $-338 | +5% $-449 | +10% $-559 |
|---|---|---|---|---|---|
| Rent | -10% $-525 | -5% $-432 | +0% $-338 | +5% $-245 | +10% $-151 |
| Rate | -1.0pp $-177 | -0.5pp $-257 | base $-338 | +0.5pp $-421 | +1.0pp $-505 |
UW: 25.0% down · 7.5% · 30yr · 1.5% tax · 5.0% vac · 8.0% maint · 8.0% mgmt
Financing live
Cash to close
- Down payment
- $79,825
- Closing costs
- $9,579
- Reserves months
- —
- Total cash needed
- —
Loan-product check · same deal, 3 products live
Conventional
25% down · 7.5% · 30yr
- Down + closing
- —
- Monthly P&I
- —
- Monthly cashflow
- —
- DSCR
- —
- Eligible?
- —
Personal DTI + credit; lowest rate.
DSCR
20% down · 8.5% · 30yr
- Down + closing
- —
- Monthly P&I
- —
- Monthly cashflow
- —
- DSCR
- —
- Eligible?
- —
No personal income docs; deal must DSCR.
Hard money
10% down · 12.0% · 12mo
- Down + closing
- —
- Monthly P&I
- —
- Monthly cashflow
- —
- DSCR
- —
- Eligible?
- —
Short-term bridge; refi at stabilization.
Rent comps 14 comps
| Address | Beds | Baths | Sqft | Rent | $/sqft | DOM | Units | Dist |
|---|---|---|---|---|---|---|---|---|
| 341 Bullskin St Charles Town, WV | 3.0 | 2.5 | 1976 | $2,725 | $1.38 | 25d | 1 | 0.23mi |
| 37 Abigail St Unit 1 Charles Town, WV | 3.0 | 3.5 | 2169 | $2,150 | $0.99 | 25d | 1 | 0.51mi |
| 109 Extrovert Dr Charles Town, WV | 3.0 | 4.0 | 2290 | $2,450 | $1.07 | 25d | 1 | 1.16mi |
| 454 Seeback Dr Charles Town, WV | 3.0 | 4.0 | 1952 | $2,100 | $1.08 | 25d | 1 | 1.19mi |
| 478 Seeback Dr Charles Town, WV | 3.0 | 2.5 | 1946 | $2,200 | $1.13 | 21d | 1 | 1.19mi |
| 450 Seeback Dr Charles Town, WV | 3.0 | 2.5 | 1793 | $2,050 | $1.14 | 13d | 1 | 1.19mi |
| 439 Seeback Dr Unit 255 Charles Town, WV | 3.0 | 2.5 | 1920 | $2,100 | $1.09 | 21d | 1 | 1.19mi |
| 458 Seeback Dr Charles Town, WV | 3.0 | 2.5 | 1946 | $2,100 | $1.08 | 25d | 1 | 1.19mi |
| 470 Seeback Dr Charles Town, WV | 3.0 | 2.5 | 1946 | $2,100 | $1.08 | 25d | 1 | 1.19mi |
| 10 Telluride Way Charles Town, WV | 3.0 | 4.0 | 2097 | $2,300 | $1.10 | 25d | 1 | 1.33mi |
| 19 Winterplace Dr Charles Town, WV | 4.0 | 3.5 | 2095 | $2,100 | $1.00 | 13d | 1 | 1.33mi |
| 509 Seeback Dr Charles Town, WV | 3.0 | 2.5 | 1946 | $2,150 | $1.10 | 25d | 1 | 1.37mi |
| 135 Telluride Way Charles Town, WV | 4.0 | 3.5 | 2097 | $2,400 | $1.14 | 25d | 1 | 1.38mi |
| 114 Telluride Way Charles Town, WV | 3.0 | 2.5 | 1700 | $2,090 | $1.23 | 25d | 1 | 1.40mi |
Listing history 8 events
-
2026-06-09days on market $304,990 Active 62 DOM
-
2026-06-08days on market $304,990 Active 61 DOM
-
2026-06-07days on market $304,990 Active 60 DOM
-
2026-06-04days on market $304,990 Active 57 DOM
-
2026-06-03days on market $304,990 Active 56 DOM
-
2026-06-02days on market $304,990 Active 55 DOM
-
2026-06-01days on market $304,990 Active 54 DOM
-
2026-05-31days on market $304,990 Active 53 DOM
ⓘ Source: listings_history table (triggers on properties + properties_extension) + one-shot
backfill from property_details.listing_events for pre-trigger history.
Climate risk First Street
- Flood 1/10 Low FEMA zone X (unshaded) · 0% chance over 30 yrs
- Wildfire 3/10 Moderate
- Heat 5/10 Major 7 d/yr ≥103°F today · 16 d/yr by 30 yrs out
- Wind 2/10 Low 3% chance of damaging wind over 30 yrs
- Air quality 2/10 Low 1 unhealthy d/yr today · 1 by 30 yrs out
Nearby sold comps map
Loading sold comps map…
Walkable amenities ~0.75 mi
Loading nearby amenities…
Taxation est. · year 1
- Rental income
- $28,380
- − Mortgage interest
- −$17,886
- − Property taxes
- −$4,790
- − Insurance
- −$1,596
- − Repairs & maintenance
- −$2,270
- − Management
- −$2,270
- − Depreciation
- −$9,289
- Taxable loss
- −$9,721
- Est. tax savings @ 24.0%
- +$2,333
- After-tax cash flow
- $-1,726/yr
For passive investors: Depreciation is non-cash, so a rental often shows a tax loss while cash-flowing — sheltering income. Rental losses are passive: they offset passive income freely, and up to $25,000/yr can offset ordinary (W-2) income if you actively participate and your MAGI is under $100k (phasing out to $0 by $150k); unused losses carry forward. On sale, claimed depreciation is recaptured at up to 25%, and gains may owe capital-gains tax (a 1031 exchange can defer both). Figures are a year-1 estimate at your 24.0% rate — not tax advice; consult a CPA.
Schools (NCES district)
- District
- Jefferson County Schools
- NCES district ID
- 5400570
- Math proficiency
- 29% ▼ -13.00%
- Reading proficiency
- 46% ▼ -7.00%
- Median HH income
- $67,038
- Composite
- 33.98/100
- National rank
- #5322
- State rank
- #6 of 55 in WV
Livability — Charles Town
- Score
- 76/100
- State rank
- #22
- US rank
- #3460
Category grades
Schools grade is shown separately in the Schools card above.
Census & demographics
- Census place
- Charles Town, WV
- County
- Jefferson County · 28,403 people
- City population
- 21,073
- Metro
- Washington-Arlington-Alexandria, DC-VA-MD-WV
- Population (ZIP)
- 21,073
- Household income
- $105,500
- Rent vs Own
- Severe rent burden
- 290.0
Population outlook (Jefferson County) Hauer SSP2
- Today (2025)
- 61,715 people
- By 2030
- 64,052 · +3.8%
- By 2040
- 67,713 · +9.7%
- By 2050
- 69,843 · +13.2%
- By 2075
- 72,679 · +17.8%
- By 2100
- 71,872 · +16.5%
Race, ethnicity, and origin ACS 2023
- Neighborhood character
- Predominantly White (78%)
- Race & ethnicity
- White 78% Two or more races 10% Black 7% Hispanic / Latino 7% Asian 1%
- Hispanic origin (detail)
- Mexican 2% Puerto Rican 1%
- Common ancestry
- Romanian 3% Slovak 2% Lithuanian 2%
- Foreign-born
- 5% · Canada, Jamaica
- Languages at home
- 93% English-only · Spanish 5% Other Indo-European 1%
Political lean MEDSL · Jefferson
- 2024 margin
- R (+15.8) · D 41.0% · R 56.8% · Other 2.1%
- 2008→2024 swing
- -20.6pp toward R · 2008: 4.8pp · 2024: -15.8pp
- All cycles
- 2024: R+15.8 2020: R+10.5 2016: R+15.3 2012: R+4.0 2008: D+4.8
Not yet ingested
- Civics
- —
Market trends
- HPI YoY
- ▲ 2.67%
- Current HPI
- 296.8007
- Rent YoY
- ▲ 4.35%
- Metro
- Washington-Arlington-Alexandria, DC-VA-MD-WV
- State GDP YoY
- —
- F500 in state
- 0
Cash-flow waterfall
monthlySold comps — $/sqft
last 12 mo · ≤1 miLoading sold comps…