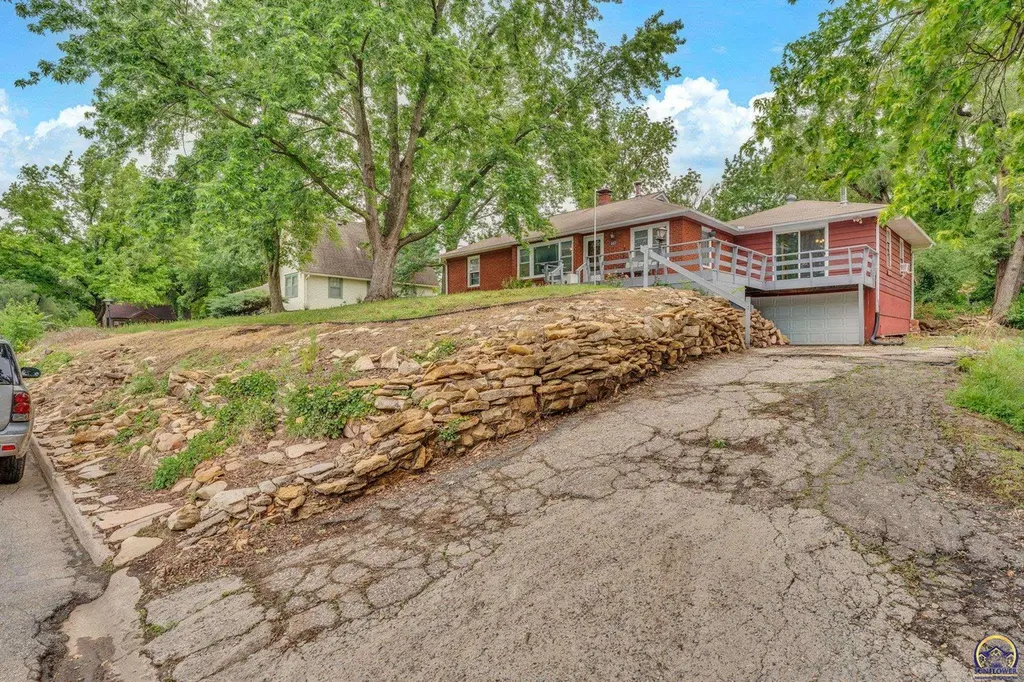
2431 SW Bradbury Ave · Topeka, KS
Flood risk 1/10 · Minimal
- FEMA flood zone
- X (unshaded)
- Chance of flooding over 30 yrs
- 0.0%
- Est. flood insurance / yr
- $473 – $860
Fire risk 1/10 · Minimal
- Est. fire insurance / yr
- $1,154 – $2,142
Heat risk 5/10 · Moderate
- Hot days now (above 107°F)
- 7 days/yr
- Hot days in 30 yrs
- 17 days/yr
Wind risk 2/10 · Minimal
- Chance of severe wind over 30 yrs
- —
Air-quality risk 3/10 · Minor
- Unhealthy air days now
- 3 days/yr
- Unhealthy air days in 30 yrs
- 4 days/yr
Risk factors via First Street. Map © Google.
Why this score? — see what drove the D grade
The composite is a weighted blend of 9 inputs, each scored 0–100. Each bar is that input's sub-score; the figure is the points it added to the 100-point composite (weight × sub-score).
- Cash flow +12.3/30.0
- ARV discount +11.6/15.0
- DSCR +3.7/10.0
- Livability +3.5/5.0
- 1% rule +3.1/10.0
- Rent growth +2.5/5.0
- Condition / age +2.5/5.0
- Schools +1.7/10.0
- Appreciation +0.0/10.0
$159,900
🖨 Deal sheet 📄 Offer letter ✓ Due diligence
Listing remarks MLS
Brick ranch with 3 bedrooms and 2 baths, nice family room above the garage. Newer roof, water heater, paint, and other extras. Furnace is about 12 years old.
Key facts
- Updated bathrooms
- Lvp flooring
- Lvt flooring
Tags
Property features AI
Exterior
- Parking: Attached garage (1 car)
- Utilities: Public water; Public sewer
- Home design: Single-family residence (single house)
- Construction: Brick and wood siding construction
- Exterior features: Deck; Screened porch; Composition roof; Brick and wood siding exterior
Interior
- Kitchen: Refrigerator
- Flooring: Hardwood floors; Vinyl flooring
- Bathrooms: 2 full bathrooms
- Heating & cooling: Wall furnace heating; Central air; Window unit(s) for cooling
- Interior features: Gas water heater; Fireplace (wood burning) with pellet stove insert; One fireplace located in the master bedroom; Basement with walk-out access (concrete, full, unfinished)
- Laundry & utility: Washer and dryer; Laundry located in the basement
Neighborhood map
What this means for you Summary
Snapshot
- This is a 3-bed/2.0-bath single-family listed at $160k.
Deal economics
- At list price, monthly cash flow is $-29 ($-345/yr) — negative.
- To cash-flow at today's rent, offer at most $155k (3.2% below list).
- To meet the 1% rule (rent ≥ 1% of price), the offer needs to be $130k (18.6% below list).
- Recommended offer: $130k (18.6% below list) — sets the bar for 1% rule.
- Cap rate 6.1% vs local median 4.3% in Topeka — top-decile yield for the area; either an underpriced asset or a hidden risk that comps aren't pricing in. Stress-test before assuming the spread holds.
Location & tenants
- Location reads 69/100 on livability (#195 in KS) — a middle-class / working-renter tenant base. Strengths: cost of living A+, housing A+, health & safety A+; Watch: employment C-, crime F, commute F.
- Topeka Public Schools (urban): math 17% / reading 23% proficiency, ranked #158 of 169 in KS (top 94%) — low school quality limits family demand, transient renter base, plan for 1-2y turnover; 69% free/reduced lunch — lower-income household profile, screen leases tightly.
- Zoned schools: Highland Park Central (math 8% / reading 12%, grade F, #660 of 684 statewide, top 98%, 308 students, 92% FRL); Jardine Middle School (math 13% / reading 23%, grade F, #164 of 219 statewide, top 76%, 542 students, 79% FRL); Topeka High (math 11% / reading 20%, grade F, #248 of 327 statewide, top 76%, 1,514 students, 72% FRL).
- Market conditions: 49 active listings in the ZIP; 8 comparable units currently listed for rent nearby; rentals at typical pace (median 21d on market — plan ~3-4 weeks tenant-placement turnaround); 219 units permitted in Shawnee County in 2024 (25 in 5+ unit buildings).
Forward outlook
- Local home prices are declining (-3.0%/yr); year-one equity from $1k of loan paydown is wiped out by about $5k of value loss. Plan a longer hold.
- Shawnee County population projected to shrink 7% by 2050 — rents likely to lag national; underwrite the cash flow, not the appreciation.
Negotiation context
- Only 7 days on market — expect competitive offers; lowballing is unlikely to land.
- 3 sale attempts since 13y ago with the ask held roughly flat each time — persistent listings suggest the price (not the market) is what's stuck; bring a comps-based counter.
Risks & watch-outs
- Watch-outs: built in 1950 — expect roof / HVAC / electrical / plumbing capex.
- Climate carrying-cost: extreme-heat days projected 7→17/yr by 2055 (HVAC capex compounding) — expect insurance premiums to compound above CPI over the hold.
Questions for the listing agent
- What do current leases actually rent for vs. the listed asking? Can we see a recent rent roll and the last 12 months of T-12 income?
- Built in 1950 — when were the roof, HVAC, electrical panel, plumbing, and water heater last replaced?
- Is there a deadline driving the sale (1031 exchange, divorce, estate, relocation)? That informs how much negotiation room exists.
- Schools are D-rated, which usually means shorter tenancies and higher turnover. Who's the typical renter profile here, and what's been the actual vacancy rate?
- Crime grade is F in this area — have there been break-ins, vandalism, or insurance claims at this property in the last 3 years? What carrier currently insures it and at what premium?
- The area grade is low — what's the realistic commute time and amenity access for the typical tenant pool here? Any planned neighborhood developments (good or bad) we should know about?
- What's the average days-on-market for RENTAL listings here right now (not sales)? A rising rental-DOM trend means longer vacancies and softer asking-rent achievability than the comps imply.
- What's the recent tenant-quality profile in this submarket — average credit score on applications, eviction rate, late-payment / NSF rate, and stable-employment percentage? A property-management company in the area should have these aggregated.
- How much new for-sale + rental construction is in the pipeline within 1–3 miles? Heavy new supply typically softens prices + rents 12–24 months out; constrained supply supports both.
Investment metrics
- 1% rule
- 0.81% ✗
- Cap rate
- 6.08%
- Cash-on-cash
- -0.77%
- DSCR
- 0.97
- GRM
- 10.2
CMA / ARV
- ARV (on-the-fly)
- $175,932
- Comps found
- 2
Show comp detail 2 sales within ~0.75 mi
| Address | Dist | Beds/Ba | Sqft | Sold | Price | $/sf | Match |
|---|---|---|---|---|---|---|---|
| 2058 SW Buchanan St | 0.74mi | 3/2.0 | 1,616 (-1%) | 2mo | $175,000 | $108 | 63 |
| 2310 SE Massachusetts Ave | 0.67mi | 3/1.0 | 1,428 (-12%) | 4mo | $100,000 | $70 | 41 |
Match score weights: distance 35% · size 25% · config 20% · recency 20%. Top-matched comps best support the ARV.
Projected returns pro-forma
-3.0% appreciation · 3.0% rent growth · sell at horizon
- IRR
- -17.6%
- Equity multiple
- 0.38×
- Total profit
- $-27,752
- Equity at exit
- $23,842
- IRR
- -9.7%
- Equity multiple
- 0.41×
- Total profit
- $-26,564
- Equity at exit
- $13,825
Cash invested: $44,772 (down + closing). Projections, not guarantees.
Landlord ↔ Tenant lean methodology
- Overall (STATE)
- 83 Strongly Landlord-Friendly
- State Kansas
- 83 Strongly Landlord-Friendly · R+10
- County
- — inherits STATE
- City
- — inherits STATE
ZIP-level market 66611
- Active inventory
- 49
- Price-to-rent
- 10.2×
Monthly cashflow live
- Estimated rent
- $1,302 high interval (Pro) →
- Mortgage (P&I)
- −$839
- Tax from tax record
- −$152 /mo · $1,826/yr
- Insurance
- −$67
- HOA
- −$0
- Vacancy / Maint / Mgmt
- −$273
- Net cashflow
- $-29
Break-even live
UW: 25.0% down · 7.5% · 30yr · 1.5% tax · 5.0% vac · 8.0% maint · 8.0% mgmt
Financing live
Cash to close
- Down payment
- $39,975
- Closing costs
- $4,797
- Reserves months
- —
- Total cash needed
- —
Loan-product check · same deal, 3 products live
Conventional
25% down · 7.5% · 30yr
- Down + closing
- —
- Monthly P&I
- —
- Monthly cashflow
- —
- DSCR
- —
- Eligible?
- —
Personal DTI + credit; lowest rate.
DSCR
20% down · 8.5% · 30yr
- Down + closing
- —
- Monthly P&I
- —
- Monthly cashflow
- —
- DSCR
- —
- Eligible?
- —
No personal income docs; deal must DSCR.
Hard money
10% down · 12.0% · 12mo
- Down + closing
- —
- Monthly P&I
- —
- Monthly cashflow
- —
- DSCR
- —
- Eligible?
- —
Short-term bridge; refi at stabilization.
Rent comps 8 comps
| Address | Beds | Baths | Sqft | Rent | $/sqft | DOM | Units | Dist |
|---|---|---|---|---|---|---|---|---|
| 501 SE 25th St Topeka, KS | 3.0 | 1.5 | 1200 | $1,295 | $1.08 | 21d | 1 | 0.56mi |
| 1316 SW 27th St Topeka, KS | 2.0 | 2.0 | 1456 | $1,150 | $0.79 | 21d | 1 | 0.72mi |
| 1936 SW Clay St Topeka, KS | 3.0 | 1.0 | 1572 | $1,000 | $0.64 | 21d | 1 | 0.76mi |
| 1624 SW Polk St Topeka, KS | 3.0 | 2.0 | 1288 | $1,350 | $1.05 | 21d | 1 | 0.89mi |
| 1116 SW 18th St Topeka, KS | 3.0 | 1.0 | 1105 | $1,175 | $1.06 | 21d | 1 | 0.96mi |
| 1647 SW Buchanan St Topeka, KS | 3.0 | 2.0 | 1550 | $1,395 | $0.90 | 21d | 1 | 1.05mi |
| 1415 SW Western Ave Topeka, KS | 4.0 | 1.0 | 1190 | $1,400 | $1.18 | 21d | 1 | 1.10mi |
| 1268 SW Western Ave Unit 1A Topeka, KS | 2.0 | 1.0 | 1404 | $1,000 | $0.71 | 21d | 1 | 1.29mi |
Listing history 5 events
-
2026-05-21$159,900 Active
-
2015-11-25soldstatus 157-char remark
Show marketing remark (157 chars)
Brick ranch with 3 bedrooms and 2 baths, nice family room above the garage. Newer roof, water heater, paint, and other extras. Furnace is about 12 years old.
-
2015-11-25soldstatus
Show marketing remark (157 chars)
Brick ranch with 3 bedrooms and 2 baths, nice family room above the garage. Newer roof, water heater, paint, and other extras. Furnace is about 12 years old.
-
2015-05-27$69,950 157-char remark
Show marketing remark (157 chars)
Brick ranch with 3 bedrooms and 2 baths, nice family room above the garage. Newer roof, water heater, paint, and other extras. Furnace is about 12 years old.
-
2013-02-08$89,950
ⓘ Source: listings_history table (triggers on properties + properties_extension) + one-shot
backfill from property_details.listing_events for pre-trigger history.
Tax reassessment forecast KS · Resets to sale price
- Current annual tax
- $1,826 · $152/mo
- Projected year-2 tax
- $2,255 · $188/mo
- Expected delta
- +$429/yr (+$36/mo · 23.5%)
ⓘ Screening estimate from a state-policy table — verify with the county assessor before closing.
Climate risk First Street
- Flood 1/10 Low FEMA zone X (unshaded) · 0% chance over 30 yrs
- Wildfire 1/10 Low
- Heat 5/10 Major 7 d/yr ≥107°F today · 17 d/yr by 30 yrs out
- Wind 2/10 Low
- Air quality 3/10 Moderate 3 unhealthy d/yr today · 4 by 30 yrs out
Nearby sold comps map
Loading sold comps map…
Walkable amenities ~0.75 mi
Loading nearby amenities…
Taxation est. · year 1
- Rental income
- $15,624
- − Mortgage interest
- −$8,957
- − Property taxes
- −$1,826
- − Insurance
- −$800
- − Repairs & maintenance
- −$1,250
- − Management
- −$1,250
- − Depreciation
- −$4,652
- Taxable loss
- −$3,110
- Est. tax savings @ 24.0%
- +$746
- After-tax cash flow
- $401/yr
For passive investors: Depreciation is non-cash, so a rental often shows a tax loss while cash-flowing — sheltering income. Rental losses are passive: they offset passive income freely, and up to $25,000/yr can offset ordinary (W-2) income if you actively participate and your MAGI is under $100k (phasing out to $0 by $150k); unused losses carry forward. On sale, claimed depreciation is recaptured at up to 25%, and gains may owe capital-gains tax (a 1031 exchange can defer both). Figures are a year-1 estimate at your 24.0% rate — not tax advice; consult a CPA.
Schools (NCES district)
- District
- Topeka Public Schools
- NCES district ID
- 2012260
- Math proficiency
- 17% ▼ -8.00%
- Reading proficiency
- 23% ▼ -2.00%
- Median HH income
- $37,405
- Composite
- 16.69/100
- National rank
- #9167
- State rank
- #158 of 169 in KS
Livability — Topeka
- Score
- 69/100
- State rank
- #195
- US rank
- #8848
Category grades
Schools grade is shown separately in the Schools card above.
Census & demographics
- Census place
- Topeka, KS
- County
- Shawnee County · 118,130 people
- City population
- 118,130
- Metro
- Topeka, KS
- Population (ZIP)
- 9,828
- Household income
- $55,837
- Rent vs Own
- Severe rent burden
- 501.0
Population outlook (Shawnee County) Hauer SSP2
- Today (2025)
- 179,277 people
- By 2030
- 177,762 · -0.8%
- By 2040
- 172,341 · -3.9%
- By 2050
- 166,330 · -7.2%
- By 2075
- 152,417 · -15.0%
- By 2100
- 134,782 · -24.8%
Race, ethnicity, and origin ACS 2023
- Neighborhood character
- Diverse neighborhood (Simpson 0.56)
- Race & ethnicity
- White 64% Hispanic / Latino 13% Black 12% Two or more races 12%
- Hispanic origin (detail)
- Mexican 8% Puerto Rican 4%
- Common ancestry
- Italian 2% Serbian 2% Lithuanian 2%
- Foreign-born
- 4% · Canada, China
- Languages at home
- 93% English-only · Spanish 5%
Political lean MEDSL · Shawnee
- 2024 margin
- Toss-up / Even · D 49.3% · R 48.8% · Other 2.0%
- 2008→2024 swing
- +0.8pp no change · 2008: -0.3pp · 2024: 0.5pp
- All cycles
- 2024: D+0.5 2020: D+3.0 2016: R+2.8 2012: R+1.7 2008: R+0.3
Not yet ingested
- Civics
- —
Market trends
- HPI YoY
- ▼ -142.03%
- Current HPI
- 213.2041
- Rent YoY
- —
- Metro
- Topeka, KS
- State GDP YoY
- —
- F500 in state
- 0
Price history
+77.8% since first listed5 events — show timeline
- 2026-05-21 Listed $159,900 Sunflower MLS as distributed by MLS GRID
- 2015-11-25 Sold (Public Records) — Public Records
- 2015-11-25 Sold (MLS) — Sunflower MLS as distributed by MLS GRID
- 2015-05-27 Listed $69,950 Sunflower MLS as distributed by MLS GRID
- 2013-02-08 Listed $89,950 Sunflower MLS as distributed by MLS GRID
Property tax history
+1.3%/yrLatest (2025): $1,826 · +6.1% YoY. Source: county tax records.
Cash-flow waterfall
monthlySold comps — $/sqft
last 12 mo · ≤1 miLoading sold comps…