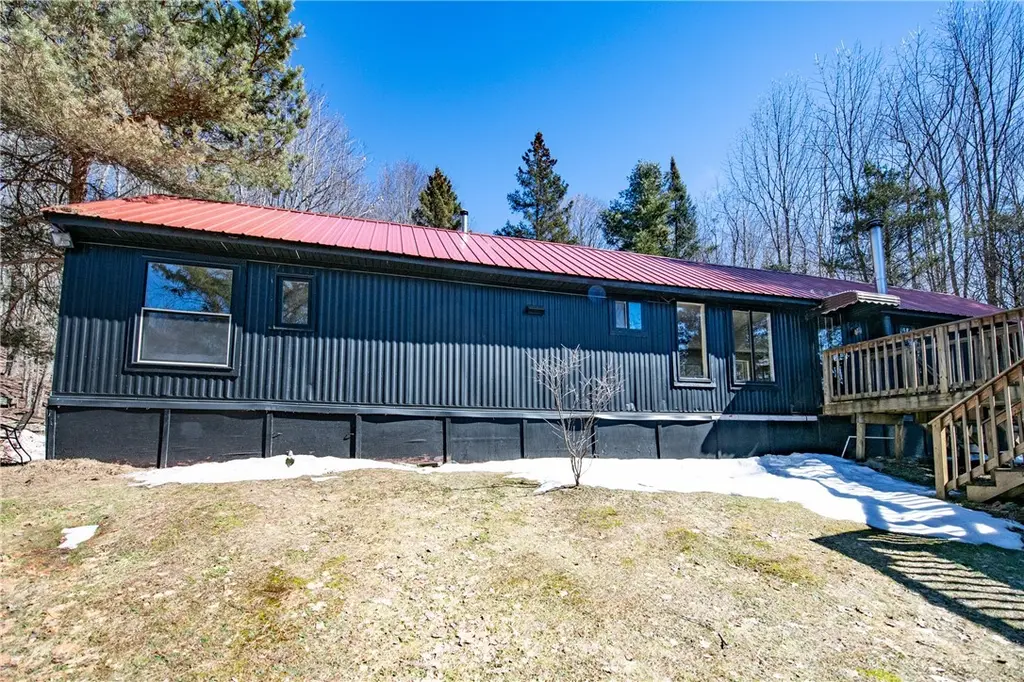
66 Blackberry Ln · Margaretville, NY
Flood risk 1/10 · Minimal
- FEMA flood zone
- X (unshaded)
- Chance of flooding over 30 yrs
- 0.0%
- Est. flood insurance / yr
- $473 – $860
Fire risk 2/10 · Minimal
- Est. fire insurance / yr
- $691 – $1,283
Heat risk 1/10 · Minimal
- Hot days now (above 85°F)
- 5 days/yr
- Hot days in 30 yrs
- 11 days/yr
Wind risk 2/10 · Minimal
- Chance of severe wind over 30 yrs
- 1.0%
Air-quality risk 2/10 · Minimal
- Unhealthy air days now
- 0 days/yr
- Unhealthy air days in 30 yrs
- 1 days/yr
Risk factors via First Street. Map © Google.
Why this score? — see what drove the B grade
The composite is a weighted blend of 9 inputs, each scored 0–100. Each bar is that input's sub-score; the figure is the points it added to the 100-point composite (weight × sub-score).
- Cash flow +29.5/30.0
- DSCR +10.0/10.0
- Appreciation +8.3/10.0
- ARV discount +7.5/15.0
- 1% rule +7.2/10.0
- Livability +3.2/5.0
- Schools +2.8/10.0
- Rent growth +2.5/5.0
- Condition / age +2.5/5.0
$199,000
🖨 Deal sheet (PDF) 📄 Offer letter ✓ Due diligence
Listing remarks
Dreaming of owning a couple of acres with a cozy cabin only 2.5 hours from the city? This secluded single story cabin is a successful year round Airbnb off the beautiful Barkaboom Rd, minutes from Big Pond and Little Pond and the Pepacton reservoir for swimming, fishing and hiking, and 30 minutes from Bellayre and Plattekill for skiing. Sunshine floods the large windowed 2 bedroom and 2 full bath creative retreat. Thoughtfully designed and updated by the artist and chef owners, each bedroom has it's own full bath for privacy, a built-in double bunk bed in the guest room. Chrome restaurant-grade counters, open shelving, and deep sink in the chef's kitchen complemented by a custom glass islan
Key facts
- Spacious deck
- Custom glass island
- Mountain views
Tags
Neighborhood map
What this means for you Summary
Snapshot
- This is a 2-bed/2.0-bath manufactured listed at $199k.
Deal economics
- At list price, monthly cash flow is $712 ($9k/yr) — positive.
- The deal already cash-flows at list — no discount required.
- Meets the 1% rule at list price ($2k rent vs $199k).
- Recommended offer: $196k (1.5% below list) — sets the bar for market timing.
- Cap rate 10.6% vs local median 4.0% in Margaretville — top-decile yield for the area; either an underpriced asset or a hidden risk that comps aren't pricing in. Stress-test before assuming the spread holds.
Location & tenants
- Location reads 65/100 on livability (#711 in NY) — a middle-class / working-renter tenant base. Strengths: health & safety A, cost of living A-; Watch: employment D, schools F, crime F.
- Andes Central School District (rural): math 40% / reading 20% proficiency, ranked #727 of 755 in NY (top 96%) — families likely to look elsewhere, expect single-tenant / working-renter base with shorter leases.
- Market conditions: 41 active listings in the ZIP; 66 units permitted in Delaware County in 2024 (0 in 5+ unit buildings).
Forward outlook
- In year one you build about $15k of equity ($1k loan paydown + $13k appreciation (6.6% local appreciation)).
- Delaware County population projected at -27% by 2050 — secular population decline; favor cash flow + early exit over multi-decade hold.
- At projected returns (6.6% appreciation + 3.0% rent growth), your $56k cash investment doubles in ~3 years — after that, you're playing with house money.
- By year 3, paydown + projected appreciation supports a ~$36k cash-out refi (75% LTV) — recoverable capital for the next deal without selling this one.
Negotiation context
- It's been on market 25 days — a 2% lower offer ($196k) is reasonable based on typical stale-listing flexibility.
- 6 sale attempts since 6y ago with the ask held roughly flat each time — persistent listings suggest the price (not the market) is what's stuck; bring a comps-based counter.
- Current owner paid $130k; list at $199k implies a 53% gain — meaningful room to come down on a strong offer.
Questions for the listing agent
- Is there a deadline driving the sale (1031 exchange, divorce, estate, relocation)? That informs how much negotiation room exists.
- Schools are F-rated, which usually means shorter tenancies and higher turnover. Who's the typical renter profile here, and what's been the actual vacancy rate?
- Crime grade is F in this area — have there been break-ins, vandalism, or insurance claims at this property in the last 3 years? What carrier currently insures it and at what premium?
- What's the average days-on-market for RENTAL listings here right now (not sales)? A rising rental-DOM trend means longer vacancies and softer asking-rent achievability than the comps imply.
- What's the recent tenant-quality profile in this submarket — average credit score on applications, eviction rate, late-payment / NSF rate, and stable-employment percentage? A property-management company in the area should have these aggregated.
- How much new for-sale + rental construction is in the pipeline within 1–3 miles? Heavy new supply typically softens prices + rents 12–24 months out; constrained supply supports both.
Investment metrics
- 1% rule
- 1.22% ✓
- Cap rate
- 10.59%
- Cash-on-cash
- 15.34%
- DSCR
- 1.68
- GRM
- 6.8
CMA / ARV
No comps found within radius.
Projected returns pro-forma
6.62% appreciation · 3.0% rent growth · sell at horizon
- IRR
- 29.3%
- Equity multiple
- 2.98×
- Total profit
- $110,129
- Equity at exit
- $132,936
- IRR
- 27.0%
- Equity multiple
- 6.14×
- Total profit
- $286,612
- Equity at exit
- $248,144
Cash invested: $55,720 (down + closing). Projections, not guarantees.
Landlord ↔ Tenant lean methodology
- Overall (STATE)
- 15 Strongly Tenant-Friendly
- State New York
- 15 Strongly Tenant-Friendly · D+10
- County
- — inherits STATE
- City
- — inherits STATE
ZIP-level market 13731
- Home prices YoY
- 1.6%
- Active inventory
- 41
- Price-to-rent
- 6.8×
Monthly cashflow live
- Estimated rent
- $2,431 medium interval (Pro) →
- Mortgage (P&I)
- −$1,044
- Tax from tax record
- −$82 /mo · $981/yr
- Insurance
- −$83
- HOA
- −$0
- Vacancy / Maint / Mgmt
- −$511
- Net cashflow
- $712
Break-even live
Sensitivity live
| Price | -10% $825 | -5% $769 | +0% $712 | +5% $656 | +10% $600 |
|---|---|---|---|---|---|
| Rent | -10% $520 | -5% $616 | +0% $712 | +5% $808 | +10% $904 |
| Rate | -1.0pp $813 | -0.5pp $763 | base $712 | +0.5pp $661 | +1.0pp $608 |
UW: 25.0% down · 7.5% · 30yr · 1.5% tax · 5.0% vac · 8.0% maint · 8.0% mgmt
Financing live
Cash to close
- Down payment
- $49,750
- Closing costs
- $5,970
- Reserves months
- —
- Total cash needed
- —
Loan-product check · same deal, 3 products live
Conventional
25% down · 7.5% · 30yr
- Down + closing
- —
- Monthly P&I
- —
- Monthly cashflow
- —
- DSCR
- —
- Eligible?
- —
Personal DTI + credit; lowest rate.
DSCR
20% down · 8.5% · 30yr
- Down + closing
- —
- Monthly P&I
- —
- Monthly cashflow
- —
- DSCR
- —
- Eligible?
- —
No personal income docs; deal must DSCR.
Hard money
10% down · 12.0% · 12mo
- Down + closing
- —
- Monthly P&I
- —
- Monthly cashflow
- —
- DSCR
- —
- Eligible?
- —
Short-term bridge; refi at stabilization.
Listing history 12 events
-
2026-04-10status Pending
-
2026-03-16$199,000 Active
-
2025-12-15historical
-
2025-06-16$239,000 Active
-
2025-06-15$239,000 Active
-
2021-08-17soldstatus $130,000
-
2021-08-10soldstatus $130,000
-
2021-08-10soldstatus $130,000
-
2021-05-02$125,000
-
2021-05-02$125,000
-
2020-11-27$174,000
-
2004-11-09soldstatus $54,000
ⓘ Source: listings_history table (triggers on properties + properties_extension) + one-shot
backfill from property_details.listing_events for pre-trigger history.
Tax reassessment forecast NY · Partial reset (capped growth)
- Current annual tax
- $981 · $82/mo
- Projected year-2 tax
- $2,172 · $181/mo
- Expected delta
- +$1,191/yr (+$99/mo · 121.3%)
ⓘ Screening estimate from a state-policy table — verify with the county assessor before closing.
Climate risk First Street
- Flood 1/10 Low FEMA zone X (unshaded) · 0% chance over 30 yrs
- Wildfire 2/10 Low
- Heat 1/10 Low 5 d/yr ≥85°F today · 11 d/yr by 30 yrs out
- Wind 2/10 Low 100% chance of damaging wind over 30 yrs
- Air quality 2/10 Low 0 unhealthy d/yr today · 1 by 30 yrs out
Nearby sold comps map
Loading sold comps map…
Walkable amenities ~0.75 mi
Loading nearby amenities…
Taxation est. · year 1
- Rental income
- $29,175
- − Mortgage interest
- −$11,147
- − Property taxes
- −$981
- − Insurance
- −$995
- − Repairs & maintenance
- −$2,334
- − Management
- −$2,334
- − Depreciation
- −$5,789
- Taxable income
- $5,594
- Est. tax owed @ 24.0%
- −$1,343
- After-tax cash flow
- $7,206/yr
For passive investors: Depreciation is non-cash, so a rental often shows a tax loss while cash-flowing — sheltering income. Rental losses are passive: they offset passive income freely, and up to $25,000/yr can offset ordinary (W-2) income if you actively participate and your MAGI is under $100k (phasing out to $0 by $150k); unused losses carry forward. On sale, claimed depreciation is recaptured at up to 25%, and gains may owe capital-gains tax (a 1031 exchange can defer both). Figures are a year-1 estimate at your 24.0% rate — not tax advice; consult a CPA.
Schools (NCES district)
- District
- Andes Central School District
- NCES district ID
- 3603000
- Math proficiency
- 40% ▼ -10.00%
- Reading proficiency
- 20% ▼ -30.00%
- Median HH income
- $42,655
- Composite
- 28.38/100
- National rank
- #12127
- State rank
- #727 of 755 in NY
Livability — Margaretville
- Score
- 65/100
- State rank
- #711
- US rank
- #13534
Category grades
Schools grade is shown separately in the Schools card above.
Census & demographics
- Population (ZIP)
- 1,102
Population outlook (Delaware County) Hauer SSP2
- Today (2025)
- 42,668 people
- By 2030
- 40,337 · -5.5%
- By 2040
- 35,514 · -16.8%
- By 2050
- 31,265 · -26.7%
- By 2075
- 24,455 · -42.7%
- By 2100
- 19,529 · -54.2%
Race, ethnicity, and origin ACS 2023
- Neighborhood character
- Predominantly White (91%)
- Race & ethnicity
- White 91% Two or more races 7% Hispanic / Latino 5%
- Common ancestry
- Iranian 4% Italian 4% Romanian 4%
- Foreign-born
- 5% · Canada, South Korea
- Languages at home
- 92% English-only · Spanish 4% German/W. Germanic 1% French/Haitian/Cajun 1%
Political lean MEDSL · Delaware
- 2024 margin
- R (+19.8) · D 40.1% · R 59.9%
- 2008→2024 swing
- -14.6pp toward R · 2008: -5.2pp · 2024: -19.8pp
- All cycles
- 2024: R+19.8 2020: R+18.4 2016: R+29.2 2012: R+9.6 2008: R+5.2
Not yet ingested
- Civics
- —
Market trends
- HPI YoY
- ▲ 6.62%
- Current HPI
- 408.9953
- Rent YoY
- —
- Metro
- —
- State GDP YoY
- ▲ 2.60%
- F500 in state
- 92
Industry mix (Fortune 500 HQ in NY)
| Industry | F500 HQs | Revenue |
|---|---|---|
| Financial Services | 10 | $950B |
|
||
| Consumer Goods | 9 | $162B |
|
||
| Insurance | 4 | $225B |
|
||
| Telecommunications | 2 | $144B |
|
||
| Pharmaceuticals | 2 | $112B |
|
||
| Media / Entertainment | 2 | $69B |
|
||
Price history
+268.5% since first listed12 events — show timeline
- 2026-04-10 Pending — UNYREIS
- 2026-03-16 Listed $199,000 UNYREIS
- 2025-12-15 Listing Removed — UNYREIS
- 2025-06-16 Listed $239,000 HVCRMLS
- 2025-06-15 Listed $239,000 UNYREIS
- 2021-08-17 Sold (Public Records) $130,000 Public Records
- 2021-08-10 Sold (MLS) $130,000 ODBOR
- 2021-08-10 Sold (MLS) $130,000 UNYREIS
- 2021-05-02 Listed $125,000 ODBOR
- 2021-05-02 Listed $125,000 UNYREIS
- 2020-11-27 Listed $174,000 UNYREIS
- 2004-11-09 Sold (Public Records) $54,000 Public Records
Property tax history
+1.8%/yrLatest (2025): $981 · +4.1% YoY. Source: county tax records.
Cash-flow waterfall
monthlySold comps — $/sqft
last 12 mo · ≤1 miLoading sold comps…