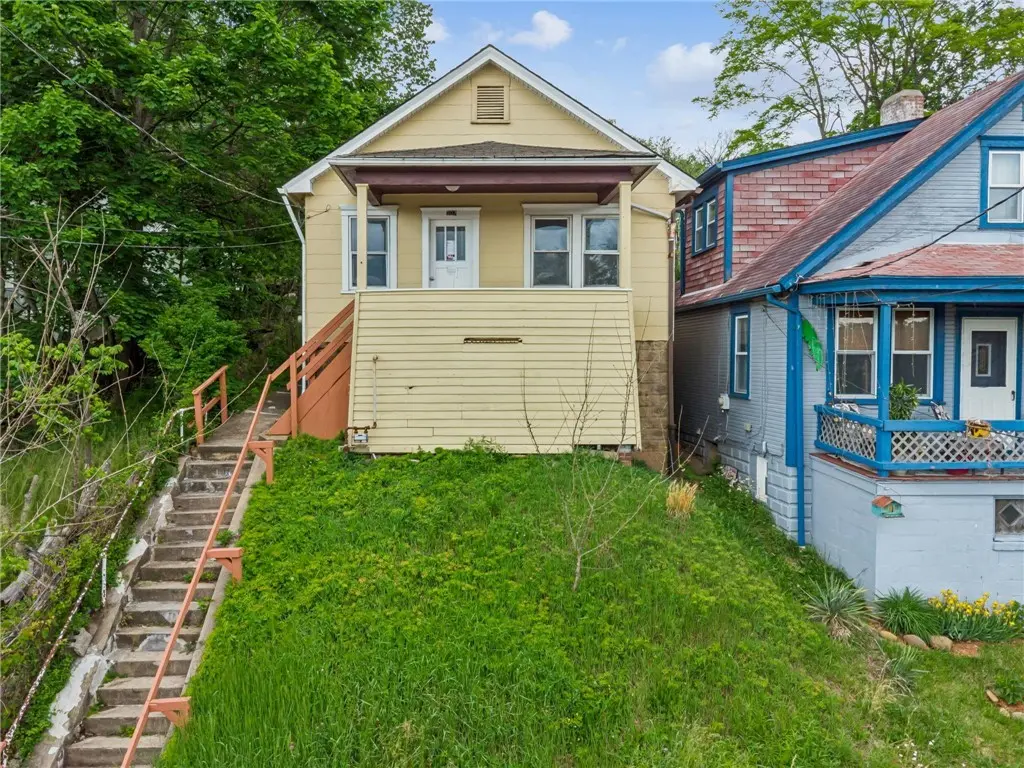
907 Vermont Ave · White Oak, PA
Flood risk 1/10 · Minimal
- FEMA flood zone
- X (unshaded)
- Chance of flooding over 30 yrs
- 0.0%
- Est. flood insurance / yr
- $473 – $860
Fire risk 1/10 · Minimal
- Est. fire insurance / yr
- $511 – $949
Heat risk 4/10 · Minor
- Hot days now (above 97°F)
- 7 days/yr
- Hot days in 30 yrs
- 18 days/yr
Wind risk 2/10 · Minimal
- Chance of severe wind over 30 yrs
- 0.0%
Air-quality risk 4/10 · Minor
- Unhealthy air days now
- 5 days/yr
- Unhealthy air days in 30 yrs
- 7 days/yr
Risk factors via First Street. Map © Google.
Why this score? — see what drove the C+ grade
The composite is a weighted blend of 9 inputs, each scored 0–100. Each bar is that input's sub-score; the figure is the points it added to the 100-point composite (weight × sub-score).
- Cash flow +30.0/30.0
- 1% rule +10.0/10.0
- DSCR +10.0/10.0
- Livability +3.9/5.0
- ARV discount +3.3/15.0
- Rent growth +2.5/5.0
- Condition / age +2.5/5.0
- Schools +1.6/10.0
- Appreciation +0.0/10.0
$59,000
🖨 Deal sheet (PDF) 📄 Offer letter ✓ Due diligence
Listing remarks
This little bungalow is a diamond in the rough awaiting your finishing touches. Tucked away on a quiet street in White Oak, this home is the perfect little size for anyone looking to start out or downsize. This is also a fantastic opportunity to add another SFH to your portfolio. You can definitely move in and add your finishing touches as you go! Close to public transit, beautiful local parks, shopping and entertainment.
Key facts
- 2,526 sq ft lot
- Built 1920
- Listed 36 days
Property features AI
Exterior
- Parking: On-street parking
- Utilities: Public water; Public sewer
- Home design: Single-story; Frame construction; Resale property
- Construction: Frame construction
- Exterior features: 30 x 110 lot dimensions; Public transportation nearby
Interior
- Flooring: Laminate
- Bathrooms: 1 full bathroom
- Heating & cooling: Forced air heating; Gas heating
- Interior features: Laminate flooring; Basement with walk-out access
Neighborhood map
What this means for you Summary
Snapshot
- This is a 2-bed/1.0-bath single-family listed at $59k.
Deal economics
- At list price, monthly cash flow is $309 ($4k/yr) — positive.
- The deal already cash-flows at list — no discount required.
- Meets the 1% rule at list price ($883 rent vs $59k).
- Recommended offer: $57k (3.0% below list) — sets the bar for market timing.
- Cap rate 12.6% vs local median 4.1% in White Oak — top-decile yield for the area; either an underpriced asset or a hidden risk that comps aren't pricing in. Stress-test before assuming the spread holds.
Location & tenants
- Location reads 77/100 on livability (#339 in PA, #2,982 nationally) — a middle-class / working-renter tenant base. Strengths: cost of living A+, housing A+, crime B+; Watch: schools D, amenities D-, commute F.
- Mckeesport Area SD (suburban): math 11% / reading 28% proficiency, ranked #499 of 539 in PA (top 93%) — low school quality limits family demand, transient renter base, plan for 1-2y turnover; 66% free/reduced lunch — lower-income household profile, screen leases tightly.
- Market conditions: 33 active listings in the ZIP; 3 comparable units currently listed for rent nearby; rentals at typical pace (median 25d on market — plan ~3-4 weeks tenant-placement turnaround); 2,996 units permitted in Allegheny County in 2024 (1,588 in 5+ unit buildings).
Forward outlook
- Local home prices are declining (-3.0%/yr); year-one equity from $408 of loan paydown is wiped out by about $2k of value loss. Plan a longer hold.
- At projected returns (-3.0% appreciation + 3.0% rent growth), your $17k cash investment doubles in ~6 years — after that, you're playing with house money.
Negotiation context
- It's been on market 36 days — a 3% lower offer ($57k) is reasonable based on typical stale-listing flexibility.
- 4 sale attempts; this cycle's ask has dropped $16k (21%) from the opening price — seller is motivated, your offer sets the floor, not the list.
- Current owner paid $30k; list at $59k implies a 97% gain — meaningful room to come down on a strong offer.
Risks & watch-outs
- Watch-outs: built in 1920 — expect roof / HVAC / electrical / plumbing capex.
Questions for the listing agent
- It's been on market 36 days. Have you received any prior offers? Is the seller open to a 3% concession, seller financing, or rate buy-down credit?
- Built in 1920 — when were the roof, HVAC, electrical panel, plumbing, and water heater last replaced?
- Is there a deadline driving the sale (1031 exchange, divorce, estate, relocation)? That informs how much negotiation room exists.
- Schools are D-rated, which usually means shorter tenancies and higher turnover. Who's the typical renter profile here, and what's been the actual vacancy rate?
- What's the average days-on-market for RENTAL listings here right now (not sales)? A rising rental-DOM trend means longer vacancies and softer asking-rent achievability than the comps imply.
- What's the recent tenant-quality profile in this submarket — average credit score on applications, eviction rate, late-payment / NSF rate, and stable-employment percentage? A property-management company in the area should have these aggregated.
- How much new for-sale + rental construction is in the pipeline within 1–3 miles? Heavy new supply typically softens prices + rents 12–24 months out; constrained supply supports both.
Investment metrics
- 1% rule
- 1.50% ✓
- Cap rate
- 12.57%
- Cash-on-cash
- 22.42%
- DSCR
- 2.00
- GRM
- 5.6
CMA / ARV
- ARV (median comp)
- $53,977
- List price
- $59,000
- Delta
- 9.31%
- Verdict
- FAIR
- Comps
- 5 within 1.0 mi
Projected returns pro-forma
-3.0% appreciation · 3.0% rent growth · sell at horizon
- IRR
- 15.2%
- Equity multiple
- 1.61×
- Total profit
- $10,101
- Equity at exit
- $8,797
- IRR
- 23.9%
- Equity multiple
- 3.07×
- Total profit
- $34,119
- Equity at exit
- $5,101
Cash invested: $16,520 (down + closing). Projections, not guarantees.
Landlord ↔ Tenant lean methodology
- Overall (STATE)
- 62 Landlord-Friendly
- State Pennsylvania
- 62 Landlord-Friendly · EVEN
- County
- — inherits STATE
- City
- — inherits STATE
ZIP-level market 15131
- Home prices YoY
- -18.6%
- Active inventory
- 33
- Price-to-rent
- 5.6×
Monthly cashflow live
- Estimated rent
- $883 medium interval (Pro) →
- Mortgage (P&I)
- −$309
- Tax from tax record
- −$55 /mo · $662/yr
- Insurance
- −$25
- HOA
- −$0
- Vacancy / Maint / Mgmt
- −$186
- Net cashflow
- $309
Break-even live
Sensitivity live
| Price | -10% $342 | -5% $325 | +0% $309 | +5% $292 | +10% $275 |
|---|---|---|---|---|---|
| Rent | -10% $239 | -5% $274 | +0% $309 | +5% $344 | +10% $378 |
| Rate | -1.0pp $338 | -0.5pp $324 | base $309 | +0.5pp $293 | +1.0pp $278 |
UW: 25.0% down · 7.5% · 30yr · 1.5% tax · 5.0% vac · 8.0% maint · 8.0% mgmt
Financing live
Cash to close
- Down payment
- $14,750
- Closing costs
- $1,770
- Reserves months
- —
- Total cash needed
- —
Loan-product check · same deal, 3 products live
Conventional
25% down · 7.5% · 30yr
- Down + closing
- —
- Monthly P&I
- —
- Monthly cashflow
- —
- DSCR
- —
- Eligible?
- —
Personal DTI + credit; lowest rate.
DSCR
20% down · 8.5% · 30yr
- Down + closing
- —
- Monthly P&I
- —
- Monthly cashflow
- —
- DSCR
- —
- Eligible?
- —
No personal income docs; deal must DSCR.
Hard money
10% down · 12.0% · 12mo
- Down + closing
- —
- Monthly P&I
- —
- Monthly cashflow
- —
- DSCR
- —
- Eligible?
- —
Short-term bridge; refi at stabilization.
Rent comps 3 comps
| Address | Beds | Baths | Sqft | Rent | $/sqft | DOM | Units | Dist |
|---|---|---|---|---|---|---|---|---|
| 510 E Pittsburgh McKeesport Blvd Unit 1 North Versailles Township, PA | 2.0 | 1.0 | 663 | $950 | $1.43 | 24d | 1 | 0.97mi |
| 510 E Pittsburgh McKeesport Blvd Unit 3 North Versailles Township, PA | 1.0 | 1.0 | 553 | $800 | $1.45 | 44d | 1 | 0.97mi |
| 1827 California Ave Apt 2 Front Second Floor White Oak, PA | 1.0 | 1.0 | 750 | $900 | $1.20 | 15d | 1 | 1.03mi |
Listing history 23 events
-
2026-06-18days on market $59,000 Active 36 DOM
-
2026-06-17days on market $59,000 Active 35 DOM
-
2026-06-16pricedays on market $59,000 Active 34 DOM
-
2026-06-15days on market $65,000 Active 33 DOM
-
2026-06-13days on market $65,000 Active 31 DOM
-
2026-06-13days on market $65,000 Active 30 DOM
-
2026-06-09days on market $65,000 Active 27 DOM
-
2026-06-08days on market $65,000 Active 26 DOM
-
2026-06-07pricedays on market $65,000 Active 25 DOM
-
2026-06-03days on market $75,000 Active 21 DOM
-
2026-06-02days on market $75,000 Active 20 DOM
-
2026-06-01days on market $75,000 Active 19 DOM
-
2026-05-31days on market $75,000 Active 18 DOM
-
2026-05-12$75,000 Active 425-char remark
-
2026-04-26historical $900
-
2026-04-24$900
-
2026-04-23historical $900
-
2026-04-18$900
-
2026-04-18historical $900
-
2026-04-15$900
-
2023-09-22soldstatus $30,000
-
2023-09-21soldstatus $21,500
-
1991-05-29soldstatus $10,500
ⓘ Source: listings_history table (triggers on properties + properties_extension) + one-shot
backfill from property_details.listing_events for pre-trigger history.
Tax reassessment forecast PA · Partial reset (capped growth)
- Current annual tax
- $662 · $55/mo
- Projected year-2 tax
- $797 · $66/mo
- Expected delta
- +$135/yr (+$11/mo · 20.4%)
ⓘ Screening estimate from a state-policy table — verify with the county assessor before closing.
Climate risk First Street
- Flood 1/10 Low FEMA zone X (unshaded) · 0% chance over 30 yrs
- Wildfire 1/10 Low
- Heat 4/10 Moderate 7 d/yr ≥97°F today · 18 d/yr by 30 yrs out
- Wind 2/10 Low 0% chance of damaging wind over 30 yrs
- Air quality 4/10 Moderate 5 unhealthy d/yr today · 7 by 30 yrs out
Nearby sold comps map
Loading sold comps map…
Walkable amenities ~0.75 mi
Loading nearby amenities…
Taxation est. · year 1
- Rental income
- $10,600
- − Mortgage interest
- −$3,305
- − Property taxes
- −$662
- − Insurance
- −$295
- − Repairs & maintenance
- −$848
- − Management
- −$848
- − Depreciation
- −$1,716
- Taxable income
- $2,926
- Est. tax owed @ 24.0%
- −$702
- After-tax cash flow
- $3,002/yr
For passive investors: Depreciation is non-cash, so a rental often shows a tax loss while cash-flowing — sheltering income. Rental losses are passive: they offset passive income freely, and up to $25,000/yr can offset ordinary (W-2) income if you actively participate and your MAGI is under $100k (phasing out to $0 by $150k); unused losses carry forward. On sale, claimed depreciation is recaptured at up to 25%, and gains may owe capital-gains tax (a 1031 exchange can defer both). Figures are a year-1 estimate at your 24.0% rate — not tax advice; consult a CPA.
Schools (NCES district)
- District
- Mckeesport Area SD
- NCES district ID
- 4214940
- Math proficiency
- 11% ▼ -9.00%
- Reading proficiency
- 28% ▼ -10.00%
- Median HH income
- $33,779
- Composite
- 15.88/100
- National rank
- #9257
- State rank
- #499 of 539 in PA
Livability — White Oak
- Score
- 77/100
- State rank
- #339
- US rank
- #2982
Category grades
Schools grade is shown separately in the Schools card above.
Census & demographics
- Census place
- White Oak, PA
- City population
- 8,451
- Population (ZIP)
- 8,451
Population outlook (Allegheny County) Hauer SSP2
- Today (2025)
- 1,250,282 people
- By 2030
- 1,256,482 · +0.5%
- By 2040
- 1,256,318 · +0.5%
- By 2050
- 1,244,169 · -0.5%
- By 2075
- 1,197,693 · -4.2%
- By 2100
- 1,093,187 · -12.6%
Race, ethnicity, and origin ACS 2023
- Neighborhood character
- Predominantly White (93%)
- Race & ethnicity
- White 93% Two or more races 3% Black 3% Hispanic / Latino 1%
- Common ancestry
- Romanian 12% Scotch-Irish 5% Slovak 3%
- Foreign-born
- 1% · Canada
- Languages at home
- 98% English-only · Other Indo-European 1% Spanish 1%
Political lean MEDSL · Allegheny
- 2024 margin
- Strong D (+20.3) · D 59.7% · R 39.4%
- 2008→2024 swing
- +4.8pp toward D · 2008: 15.5pp · 2024: 20.3pp
- All cycles
- 2024: D+20.3 2020: D+20.4 2016: D+16.4 2012: D+14.4 2008: D+15.5
Not yet ingested
- Civics
- —
Market trends
- HPI YoY
- ▼ -53.53%
- Current HPI
- 233.6591
- Rent YoY
- —
- Metro
- —
- State GDP YoY
- ▲ 1.68%
- F500 in state
- 34
Industry mix (Fortune 500 HQ in PA)
| Industry | F500 HQs | Revenue |
|---|---|---|
| Healthcare | 2 | $309B |
|
||
| Insurance | 2 | $27B |
|
||
| Telecommunications / Media | 1 | $124B |
|
||
| Industrial Distribution | 1 | $22B |
|
||
| Financial Services | 1 | $20B |
|
||
| Chemicals / Materials | 1 | $18B |
|
||
Price history
+461.9% since first listed12 events — show timeline
- 2026-06-16 Price Changed $59,000 West Penn MLS
- 2026-06-05 Price Changed $65,000 West Penn MLS
- 2026-05-12 Listed $75,000 West Penn MLS
- 2026-04-26 Rental Removed $900 SHOWMOJO
- 2026-04-24 Listed for Rent $900 SHOWMOJO
- 2026-04-23 Rental Removed $900 WPMLS
- 2026-04-18 Listed for Rent $900 WPMLS
- 2026-04-18 Rental Removed $900 SHOWMOJO
- 2026-04-15 Listed for Rent $900 SHOWMOJO
- 2023-09-22 Sold (Public Records) $30,000 Public Records
- 2023-09-21 Sold (Public Records) $21,500 Public Records
- 1991-05-29 Sold (Public Records) $10,500 Public Records
Property tax history
+3.5%/yrLatest (2026): $662 · +0.0% YoY. Source: county tax records.
Cash-flow waterfall
monthlySold comps — $/sqft
last 12 mo · ≤1 miLoading sold comps…