 Duplex
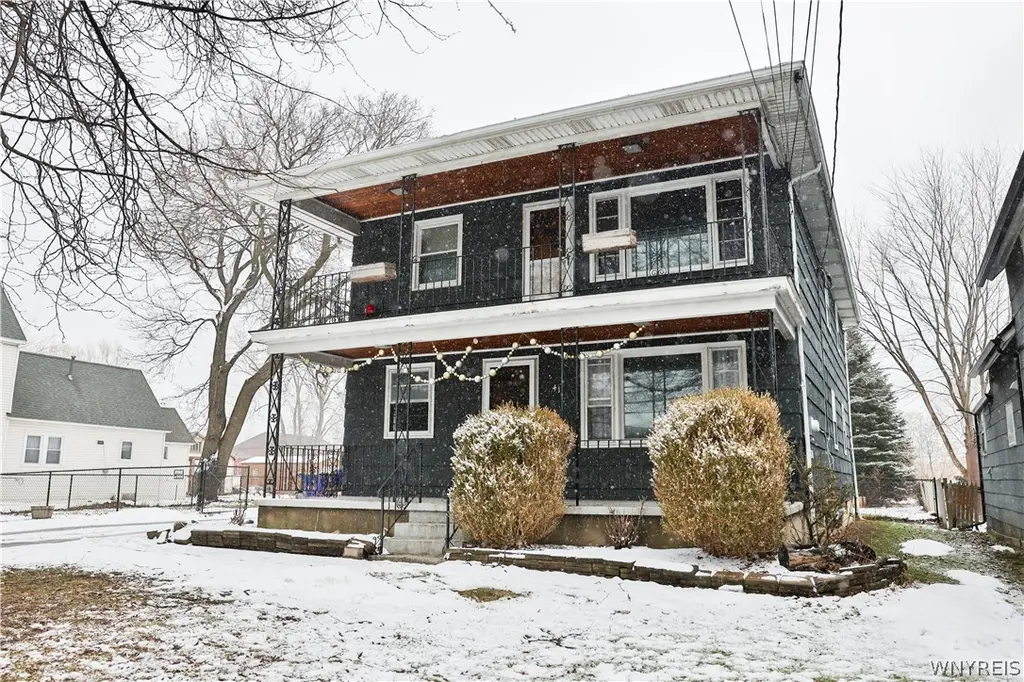
41 Aurora Ave · West Seneca, NY
Flood risk 5/10 · Moderate
- FEMA flood zone
- X (unshaded)
- Chance of flooding over 30 yrs
- 0.24%
- Est. flood insurance / yr
- $473 – $860
Fire risk 1/10 · Minimal
- Est. fire insurance / yr
- $691 – $1,283
Heat risk 3/10 · Minor
- Hot days now (above 92°F)
- 7 days/yr
- Hot days in 30 yrs
- 16 days/yr
Wind risk 1/10 · Minimal
- Chance of severe wind over 30 yrs
- —
Air-quality risk 3/10 · Minor
- Unhealthy air days now
- 2 days/yr
- Unhealthy air days in 30 yrs
- 3 days/yr
Risk factors via First Street. Map © Google.
Why this score? — see what drove the C- grade
The composite is a weighted blend of 9 inputs, each scored 0–100. Each bar is that input's sub-score; the figure is the points it added to the 100-point composite (weight × sub-score).
- Cash flow +16.0/30.0
- ARV discount +15.0/15.0
- DSCR +5.0/10.0
- 1% rule +4.8/10.0
- Schools +4.5/10.0
- Livability +4.0/5.0
- Rent growth +2.5/5.0
- Condition / age +2.5/5.0
- Appreciation +0.0/10.0
$275,000
🖨 Deal sheet (PDF) 📄 Offer letter ✓ Due diligence
Multi-family units
County records classify this as Multi-Family (2-4 Unit). Listing-text estimate: 2 units. confirmed
Listing remarks MLS
Strategic investment opportunity in a prime Buffalo location. Back on the market due to buyer financing issue. 41 Aurora Ave is a solid two-family property featuring two 3-bedroom, 1-bath units. The lower unit is vacant, offering immediate flexibility for owner-occupants or investors looking to optimize rents. The property includes separate utilities, public water and sewer, hot water heat, and appliances in both units. Exterior highlights include a fully fenced yard, covered porch, and additional outdoor space for tenants to enjoy. Whether you're looking to expand your portfolio or secure that owner-occupied for yourself, this property delivers both stability and upside.
Key facts
- Covered porch
- Separate utilities
- Two-family property
Tags
Neighborhood map
What this means for you Summary
Snapshot
- This is a 2 × 3-bed/1.0-bath units multifamily listed at $275k.
Deal economics
- At list price, monthly cash flow is $138 ($2k/yr) — positive. Per door: $69/mo.
- The deal already cash-flows at list — no discount required.
- To meet the 1% rule (rent ≥ 1% of price), the offer needs to be $270k (2.0% below list).
- Recommended offer: $270k (2.0% below list) — sets the bar for 1% rule.
- Cap rate 6.9% vs local median 3.7% in West Seneca — top-decile yield for the area; either an underpriced asset or a hidden risk that comps aren't pricing in. Stress-test before assuming the spread holds.
Location & tenants
- Location reads 79/100 on livability (#130 in NY, #2,089 nationally) — a middle-class / working-renter tenant base. Strengths: housing A+, health & safety A+, crime A-; Watch: amenities D, commute F.
- West Seneca Central School District (suburban): math 49% / reading 55% proficiency, ranked #336 of 590 in NY (top 57%) — acceptable for families but not a draw, mixed tenant base, ~2y average lease.
- Market conditions: 202 active listings in the ZIP; 1,244 units permitted in Erie County in 2024 (563 in 5+ unit buildings).
Forward outlook
- Local home prices are declining (-3.0%/yr); year-one equity from $2k of loan paydown is wiped out by about $8k of value loss. Plan a longer hold.
Negotiation context
- It's been on market 27 days — a 2% lower offer ($271k) is reasonable based on typical stale-listing flexibility.
- 3 sale attempts since 9y ago with the ask held roughly flat each time — persistent listings suggest the price (not the market) is what's stuck; bring a comps-based counter.
- Current owner paid $170k; list at $275k implies a 62% gain — meaningful room to come down on a strong offer.
Risks & watch-outs
- Climate carrying-cost: moderate flood risk — expect insurance premiums to compound above CPI over the hold.
Questions for the listing agent
- Can we see the unit-by-unit rent roll, current vacancy, and any below-market leases? What's the average tenancy length?
- What capital expenditures (roof, boiler, parking lot, exteriors) have been made in the last 5 years, and what's planned in the next 2?
- Built in 1962 — when were the roof, HVAC, electrical panel, plumbing, and water heater last replaced?
- Is there a deadline driving the sale (1031 exchange, divorce, estate, relocation)? That informs how much negotiation room exists.
- Schools are B-rated — typically a magnet for longer-tenancy family renters. What's the average tenant stay here, and is there a school-zone premium baked into asking?
- What's the average days-on-market for RENTAL listings here right now (not sales)? A rising rental-DOM trend means longer vacancies and softer asking-rent achievability than the comps imply.
- What's the recent tenant-quality profile in this submarket — average credit score on applications, eviction rate, late-payment / NSF rate, and stable-employment percentage? A property-management company in the area should have these aggregated.
- How much new apartment / multifamily construction is in the pipeline within 1–3 miles? Heavy new supply (>2% of stock underway) typically softens rents 12–24 months out; light construction supports rent growth.
Investment metrics
- 1% rule
- 0.98% ✗
- Cap rate
- 6.89%
- Cash-on-cash
- 2.15%
- DSCR
- 1.10
- GRM
- 8.5
CMA / ARV
- ARV (median comp)
- $371,471
- List price
- $275,000
- Delta
- -25.97%
- Verdict
- UNDERPRICED
- Comps
- 20 within 1.0 mi
Show comp detail 12 sales within ~0.75 mi
| Address | Dist | Beds/Ba | Sqft | Sold | Price | $/sf | Match |
|---|---|---|---|---|---|---|---|
| 154 Chamberlin Dr | 0.52mi | 5/2.0 (-1) | 2,182 (-2%) | 2mo | $242,400 | $111 | 65 |
| 260 Indian Church Rd | 0.38mi | 6/2.0 | 2,488 (+11%) | 4mo | $217,000 | $87 | 60 |
| 17 Dismonda St | 0.66mi | 6/2.0 | 2,200 (-2%) | 11mo | $230,000 | $105 | 58 |
| 96 Wildwood Pl | 0.75mi | 6/2.0 | 2,288 (+2%) | 8mo | $90,000 | $39 | 55 |
| 102 Wildwood Pl | 0.73mi | 6/2.0 | 2,270 (+2%) | 17mo | $215,000 | $95 | 49 |
| 132 Edson St | 0.54mi | 7/3.0 (+1) | 2,480 (+11%) | 2mo | $210,000 | $85 | 46 |
| 837 Mineral Springs Rd | 0.60mi | 6/2.0 | 2,352 (+5%) | 21mo | $275,000 | $117 | 45 |
| 35 Duerstein St | 0.74mi | 6/2.0 | 2,400 (+7%) | 11mo | $260,000 | $108 | 44 |
| 23 Indian Orchard Pl | 0.69mi | 6/2.0 | 2,376 (+6%) | 20mo | $245,000 | $103 | 40 |
| 118 Indian Church Rd | 0.65mi | 6/2.0 | 2,552 (+14%) | 8mo | $265,851 | $104 | 39 |
| 81 Buffum St | 0.74mi | 5/2.0 (-1) | 2,112 (-6%) | 15mo | $265,000 | $125 | 39 |
| 14 Winegar Pl | 0.70mi | 5/2.5 (-1) | 2,469 (+10%) | 5mo | $187,000 | $76 | 39 |
Match score weights: distance 35% · size 25% · config 20% · recency 20%. Top-matched comps best support the ARV.
Projected returns pro-forma
-3.0% appreciation · 3.0% rent growth · sell at horizon
- IRR
- -12.9%
- Equity multiple
- 0.54×
- Total profit
- $-35,698
- Equity at exit
- $41,003
- IRR
- -3.8%
- Equity multiple
- 0.75×
- Total profit
- $-19,403
- Equity at exit
- $23,777
Cash invested: $77,000 (down + closing). Projections, not guarantees.
Landlord ↔ Tenant lean methodology
- Overall (STATE)
- 15 Strongly Tenant-Friendly
- State New York
- 15 Strongly Tenant-Friendly · D+10
- County
- — inherits STATE
- City
- — inherits STATE
ZIP-level market 14224
- Active inventory
- 202
- Price-to-rent
- 17.0×
Monthly cashflow live
- Estimated rent
- $2,695 high interval (Pro) →
- Mortgage (P&I)
- −$1,442
- Tax from tax record
- −$435 /mo · $5,216/yr
- Insurance
- −$115
- HOA
- −$0
- Vacancy / Maint / Mgmt
- −$566
- Net cashflow
- $138
Break-even live
Sensitivity live
| Price | -10% $293 | -5% $215 | +0% $138 | +5% $60 | +10% $-18 |
|---|---|---|---|---|---|
| Rent | -10% $-75 | -5% $31 | +0% $138 | +5% $244 | +10% $351 |
| Rate | -1.0pp $276 | -0.5pp $208 | base $138 | +0.5pp $66 | +1.0pp $-6 |
2-unit breakdown (identical units grouped — click to expand)
| Units | Beds | Baths | Est. rent |
|---|---|---|---|
| 2× units | 3 | 1 | $2,696 |
| #1 | 3 | 1 | $1,348 |
| #2 | 3 | 1 | $1,348 |
| Total (2 units) | $2,695 | ||
UW: 25.0% down · 7.5% · 30yr · 1.5% tax · 5.0% vac · 8.0% maint · 8.0% mgmt
Financing live
Cash to close
- Down payment
- $68,750
- Closing costs
- $8,250
- Reserves months
- —
- Total cash needed
- —
Loan-product check · same deal, 3 products live
Conventional
25% down · 7.5% · 30yr
- Down + closing
- —
- Monthly P&I
- —
- Monthly cashflow
- —
- DSCR
- —
- Eligible?
- —
Personal DTI + credit; lowest rate.
DSCR
20% down · 8.5% · 30yr
- Down + closing
- —
- Monthly P&I
- —
- Monthly cashflow
- —
- DSCR
- —
- Eligible?
- —
No personal income docs; deal must DSCR.
Hard money
10% down · 12.0% · 12mo
- Down + closing
- —
- Monthly P&I
- —
- Monthly cashflow
- —
- DSCR
- —
- Eligible?
- —
Short-term bridge; refi at stabilization.
Listing history 8 events
-
2026-05-15status Active 680-char remark
Show marketing remark (680 chars)
Strategic investment opportunity in a prime Buffalo location. Back on the market due to buyer financing issue. 41 Aurora Ave is a solid two-family property featuring two 3-bedroom, 1-bath units. The lower unit is vacant, offering immediate flexibility for owner-occupants or investors looking to optimize rents. The property includes separate utilities, public water and sewer, hot water heat, and appliances in both units. Exterior highlights include a fully fenced yard, covered porch, and additional outdoor space for tenants to enjoy. Whether you're looking to expand your portfolio or secure that owner-occupied for yourself, this property delivers both stability and upside.
-
2026-03-16status Pending 680-char remark
Show marketing remark (680 chars)
Strategic investment opportunity in a prime Buffalo location. Back on the market due to buyer financing issue. 41 Aurora Ave is a solid two-family property featuring two 3-bedroom, 1-bath units. The lower unit is vacant, offering immediate flexibility for owner-occupants or investors looking to optimize rents. The property includes separate utilities, public water and sewer, hot water heat, and appliances in both units. Exterior highlights include a fully fenced yard, covered porch, and additional outdoor space for tenants to enjoy. Whether you're looking to expand your portfolio or secure that owner-occupied for yourself, this property delivers both stability and upside.
-
2026-03-02$275,000 Active 680-char remark
Show marketing remark (680 chars)
Strategic investment opportunity in a prime Buffalo location. Back on the market due to buyer financing issue. 41 Aurora Ave is a solid two-family property featuring two 3-bedroom, 1-bath units. The lower unit is vacant, offering immediate flexibility for owner-occupants or investors looking to optimize rents. The property includes separate utilities, public water and sewer, hot water heat, and appliances in both units. Exterior highlights include a fully fenced yard, covered porch, and additional outdoor space for tenants to enjoy. Whether you're looking to expand your portfolio or secure that owner-occupied for yourself, this property delivers both stability and upside.
-
2018-03-28soldstatus $170,000 Closed Sale or Rented 306-char remark
Show marketing remark (306 chars)
Solid 3 bdrm, 1 bath Double for owner occupied or investment. Separate utilities and washer and dryer hook-ups in very clean and dry basement. Plenty of off-street parking, 2 story shed for storage. Covered porches for summer relaxation as well as large backyard. Both HWT & Boilers replaced in 2015.
-
2018-03-28soldstatus $60,000
Show marketing remark (306 chars)
Solid 3 bdrm, 1 bath Double for owner occupied or investment. Separate utilities and washer and dryer hook-ups in very clean and dry basement. Plenty of off-street parking, 2 story shed for storage. Covered porches for summer relaxation as well as large backyard. Both HWT & Boilers replaced in 2015.
-
2018-01-31status Pending Sale 306-char remark
Show marketing remark (306 chars)
Solid 3 bdrm, 1 bath Double for owner occupied or investment. Separate utilities and washer and dryer hook-ups in very clean and dry basement. Plenty of off-street parking, 2 story shed for storage. Covered porches for summer relaxation as well as large backyard. Both HWT & Boilers replaced in 2015.
-
2018-01-29status Under Contract- Do Not Show 306-char remark
Show marketing remark (306 chars)
Solid 3 bdrm, 1 bath Double for owner occupied or investment. Separate utilities and washer and dryer hook-ups in very clean and dry basement. Plenty of off-street parking, 2 story shed for storage. Covered porches for summer relaxation as well as large backyard. Both HWT & Boilers replaced in 2015.
-
2017-12-18$185,000 Active 306-char remark
Show marketing remark (306 chars)
Solid 3 bdrm, 1 bath Double for owner occupied or investment. Separate utilities and washer and dryer hook-ups in very clean and dry basement. Plenty of off-street parking, 2 story shed for storage. Covered porches for summer relaxation as well as large backyard. Both HWT & Boilers replaced in 2015.
ⓘ Source: listings_history table (triggers on properties + properties_extension) + one-shot
backfill from property_details.listing_events for pre-trigger history.
Tax reassessment forecast NY · Partial reset (capped growth)
- Current annual tax
- $5,216 · $435/mo
- Projected year-2 tax
- $5,216 · $435/mo
- Expected delta
- $0/yr ($0/mo · 0.0%)
ⓘ Screening estimate from a state-policy table — verify with the county assessor before closing.
Climate risk First Street
- Flood 5/10 Major FEMA zone X (unshaded) · 24% chance over 30 yrs
- Wildfire 1/10 Low
- Heat 3/10 Moderate 7 d/yr ≥92°F today · 16 d/yr by 30 yrs out
- Wind 1/10 Low
- Air quality 3/10 Moderate 2 unhealthy d/yr today · 3 by 30 yrs out
Nearby sold comps map
Loading sold comps map…
Walkable amenities ~0.75 mi
Loading nearby amenities…
Taxation est. · year 1
- Rental income
- $32,340
- − Mortgage interest
- −$15,404
- − Property taxes
- −$5,216
- − Insurance
- −$1,375
- − Repairs & maintenance
- −$2,587
- − Management
- −$2,587
- − Depreciation
- −$8,000
- Taxable loss
- −$2,830
- Est. tax savings @ 24.0%
- +$679
- After-tax cash flow
- $2,331/yr
For passive investors: Depreciation is non-cash, so a rental often shows a tax loss while cash-flowing — sheltering income. Rental losses are passive: they offset passive income freely, and up to $25,000/yr can offset ordinary (W-2) income if you actively participate and your MAGI is under $100k (phasing out to $0 by $150k); unused losses carry forward. On sale, claimed depreciation is recaptured at up to 25%, and gains may owe capital-gains tax (a 1031 exchange can defer both). Figures are a year-1 estimate at your 24.0% rate — not tax advice; consult a CPA.
Schools (NCES district)
- District
- West Seneca Central School District
- NCES district ID
- 3630780
- Math proficiency
- 49% ▼ -15.00%
- Reading proficiency
- 55% ▼ -4.00%
- Median HH income
- $54,231
- Composite
- 44.83/100
- National rank
- #2735
- State rank
- #336 of 590 in NY
Livability — West Seneca
- Score
- 79/100
- State rank
- #130
- US rank
- #2089
Category grades
Schools grade is shown separately in the Schools card above.
Census & demographics
- Census place
- West Seneca, NY
- City population
- 41,101
- Population (ZIP)
- 41,101
Population outlook (Erie County) Hauer SSP2
- Today (2025)
- 933,037 people
- By 2030
- 935,181 · +0.2%
- By 2040
- 928,531 · -0.5%
- By 2050
- 905,725 · -2.9%
- By 2075
- 834,037 · -10.6%
- By 2100
- 708,033 · -24.1%
Race, ethnicity, and origin ACS 2023
- Neighborhood character
- Predominantly White (91%)
- Race & ethnicity
- White 91% Hispanic / Latino 4% Two or more races 3% Black 2%
- Common ancestry
- Romanian 22% Lithuanian 2% Iranian 1%
- Foreign-born
- 2% · Canada
- Languages at home
- 95% English-only · Spanish 2% Russian/Polish/Slavic 1% Arabic 1%
Political lean MEDSL · Erie
- 2024 margin
- Lean D (+9.7) · D 54.8% · R 45.2%
- 2008→2024 swing
- -7.9pp toward R · 2008: 17.5pp · 2024: 9.7pp
- All cycles
- 2024: D+9.7 2020: D+14.7 2016: D+4.8 2012: D+15.6 2008: D+17.5
Not yet ingested
- Civics
- —
Market trends
- HPI YoY
- ▼ -211.03%
- Current HPI
- 303.7523
- Rent YoY
- —
- Metro
- —
- State GDP YoY
- ▲ 2.60%
- F500 in state
- 92
Industry mix (Fortune 500 HQ in NY)
| Industry | F500 HQs | Revenue |
|---|---|---|
| Financial Services | 10 | $950B |
|
||
| Consumer Goods | 9 | $162B |
|
||
| Insurance | 4 | $225B |
|
||
| Telecommunications | 2 | $144B |
|
||
| Pharmaceuticals | 2 | $112B |
|
||
| Media / Entertainment | 2 | $69B |
|
||
Price history
+48.6% since first listed8 events — show timeline
- 2026-05-15 Relisted — WNYREIS
- 2026-03-16 Pending — WNYREIS
- 2026-03-02 Listed $275,000 WNYREIS
- 2018-03-28 Sold (Public Records) $60,000 Public Records
- 2018-03-28 Sold (MLS) $170,000 WNYREIS
- 2018-01-31 Pending — WNYREIS
- 2018-01-29 Pending — WNYREIS
- 2017-12-18 Listed $185,000 WNYREIS
Property tax history
+2.7%/yrLatest (2025): $5,216 · +0.7% YoY. Source: county tax records.
Cash-flow waterfall
monthlySold comps — $/sqft
last 12 mo · ≤1 miLoading sold comps…