 Fourplex
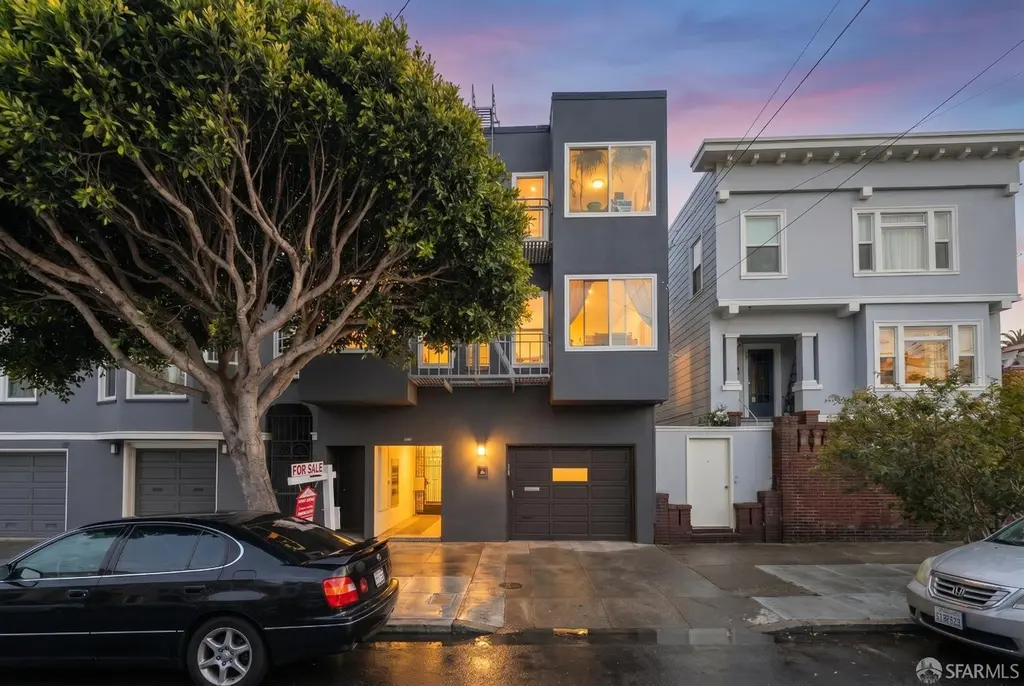
2745 Anza St · San Francisco, CA
Flood risk 1/10 · Minimal
- FEMA flood zone
- X (unshaded)
- Chance of flooding over 30 yrs
- 0.0%
- Est. flood insurance / yr
- $507 – $1,088
Fire risk 4/10 · Minor
- Est. fire insurance / yr
- $659 – $1,223
Heat risk 2/10 · Minimal
- Hot days now (above 77°F)
- 7 days/yr
- Hot days in 30 yrs
- 17 days/yr
Wind risk 1/10 · Minimal
- Chance of severe wind over 30 yrs
- —
Air-quality risk 7/10 · Major
- Unhealthy air days now
- 13 days/yr
- Unhealthy air days in 30 yrs
- 13 days/yr
Risk factors via First Street. Map © Google.
Why this score? — see what drove the B grade
The composite is a weighted blend of 9 inputs, each scored 0–100. Each bar is that input's sub-score; the figure is the points it added to the 100-point composite (weight × sub-score).
- Cash flow +29.4/30.0
- DSCR +10.0/10.0
- ARV discount +10.0/15.0
- 1% rule +8.2/10.0
- Rent growth +5.0/5.0
- Schools +5.0/10.0
- Livability +3.8/5.0
- Condition / age +2.5/5.0
- Appreciation +0.0/10.0
$1,700,000
🖨 Deal sheet (PDF) 📄 Offer letter ✓ Due diligence
Multi-family units
County records classify this as Multi-Family (5+ Unit). Listing-text estimate: 4 units. estimate disagrees with records
5+ unit building — per-unit beds/baths from public records are typically unavailable; the breakdown below (if shown) is an estimate from the listing text.
Listing remarks MLS
Family-Owned Inner Richmond 4-Plex Since 1990 - Photos and Disclosures now available! First time on the market in 64 years! 2745 Anza Street is a classic San Francisco quadruplex in the heart of the vibrant Central Richmond. Held by the same family for over three decades, this well-maintained building is currently undergoing a striking 2026 Warm Modern exterior transformation. This is a rare turn-key income opportunity where the management work has been done for you. All units are currently occupied with rents fully up-to-date on all legal increases. This offers the buyer immediate, stabilized cash flow in a high-demand submarket with a 1.2-month supply of inventory. Situated in a Walker's Paradise, the building is blocks from the culinary gems of Clement Street, Geary Boulevard, and Golden Gate Park. The tenant profile includes protected senior residents, offering long-term stability in one of SF's most resilient rental micro-markets.
Key facts
- Walker's paradise
- Long-term stability
- 2,500 sq ft lot
Tags
Neighborhood map
What this means for you Summary
Snapshot
- This is a 4 × 5-bed/1.5-bath units multifamily listed at $1.70M.
Deal economics
- At list price, monthly cash flow is $6k ($73k/yr) — positive. Per door: $2k/mo.
- The deal already cash-flows at list — no discount required.
- Meets the 1% rule at list price ($22k rent vs $1.70M).
- Cap rate 10.6% vs local median 2.1% in San Francisco — top-decile yield for the area; either an underpriced asset or a hidden risk that comps aren't pricing in. Stress-test before assuming the spread holds.
Location & tenants
- Location reads 76/100 on livability (#90 in CA, #3,143 nationally) — a middle-class / working-renter tenant base. Strengths: amenities A+, commute A+, employment A+; Watch: crime F, cost of living F.
- San Francisco Unified (urban): math 50% / reading 56% proficiency, ranked #322 of 1,400 in CA (top 23%) — acceptable for families but not a draw, mixed tenant base, ~2y average lease.
- Market conditions: Rents rising fast (+13.0%/yr); 74 active listings in the ZIP; high-income renter base; 750 units permitted in San Francisco County in 2024 (688 in 5+ unit buildings).
- At $22,439/mo this rent would consume 202% of the median local household income ($133k/yr) (locally 2072% of renters already pay >50% of income on rent) — very limited rent-growth headroom before tenants either downsize or default.
Forward outlook
- Local home prices are declining (-3.0%/yr); year-one equity from $12k of loan paydown is wiped out by about $51k of value loss. Plan a longer hold.
- San Francisco County population projected at +39% by 2050 — long-run rental-demand tailwind backs the buy-and-hold thesis.
- At projected returns (-3.0% appreciation + 8.0% rent growth), your $476k cash investment doubles in ~6 years — after that, you're playing with house money.
Negotiation context
- Only 12 days on market — expect competitive offers; lowballing is unlikely to land.
Questions for the listing agent
- Can we see the unit-by-unit rent roll, current vacancy, and any below-market leases? What's the average tenancy length?
- What capital expenditures (roof, boiler, parking lot, exteriors) have been made in the last 5 years, and what's planned in the next 2?
- Built in 1963 — when were the roof, HVAC, electrical panel, plumbing, and water heater last replaced?
- Is there a deadline driving the sale (1031 exchange, divorce, estate, relocation)? That informs how much negotiation room exists.
- Schools are B-rated — typically a magnet for longer-tenancy family renters. What's the average tenant stay here, and is there a school-zone premium baked into asking?
- Crime grade is F in this area — have there been break-ins, vandalism, or insurance claims at this property in the last 3 years? What carrier currently insures it and at what premium?
- What's the average days-on-market for RENTAL listings here right now (not sales)? A rising rental-DOM trend means longer vacancies and softer asking-rent achievability than the comps imply.
- What's the recent tenant-quality profile in this submarket — average credit score on applications, eviction rate, late-payment / NSF rate, and stable-employment percentage? A property-management company in the area should have these aggregated.
- How much new apartment / multifamily construction is in the pipeline within 1–3 miles? Heavy new supply (>2% of stock underway) typically softens rents 12–24 months out; light construction supports rent growth.
Investment metrics
- 1% rule
- 1.32% ✓
- Cap rate
- 10.56%
- Cash-on-cash
- 15.24%
- DSCR
- 1.68
- GRM
- 6.3
CMA / ARV
- ARV (median comp)
- $1,799,506
- List price
- $1,700,000
- Delta
- -5.53%
- Verdict
- FAIR
- Comps
- 20 within 1.0 mi
Show comp detail 12 sales within ~0.75 mi
| Address | Dist | Beds/Ba | Sqft | Sold | Price | $/sf | Match |
|---|---|---|---|---|---|---|---|
| 4138-4140 Fulton St | 0.36mi | 6/5.0 (+1) | 3,847 (+6%) | 0mo | $3,140,000 | $816 | 64 |
| 1614-1618 Balboa St | 0.13mi | 5/2.0 | 3,263 (-10%) | 1mo | $1,600,000 | $490 | 60 |
| 779-781 24th Ave | 0.39mi | 4/2.0 (-1) | 3,600 (-1%) | 2mo | $2,100,000 | $583 | 58 |
| 326 11th Ave | 0.53mi | 4/4.0 (-1) | 3,580 (-2%) | 2mo | $1,825,000 | $510 | 57 |
| 1714-1718 Anza St | 0.62mi | 5/3.0 | 3,572 (-2%) | 1mo | $2,505,000 | $701 | 55 |
| 1608 Balboa St | 0.13mi | 6/2.0 (+1) | 3,296 (-10%) | 5mo | $1,550,000 | $470 | 54 |
| 563-565 20th Ave | 0.11mi | 4/2.0 (-1) | 3,210 (-12%) | 3mo | $1,300,000 | $405 | 53 |
| 374-376 Funston Ave | 0.41mi | 6/4.0 (+1) | 4,116 (+13%) | 7mo | $1,715,000 | $417 | 40 |
| 171 23rd Ave | 0.52mi | 5/2.0 | 3,220 (-12%) | 3mo | $2,125,000 | $660 | 38 |
| 874 27th Ave | 0.57mi | 4/2.0 (-1) | 3,290 (-10%) | 2mo | $2,600,000 | $790 | 35 |
| 814-816 25th Ave | 0.44mi | 4/2.0 (-1) | 3,100 (-15%) | 3mo | $2,120,000 | $684 | 32 |
| 167-169 11th Ave | 0.63mi | 5/2.0 | 3,098 (-15%) | 2mo | $2,910,000 | $939 | 28 |
Match score weights: distance 35% · size 25% · config 20% · recency 20%. Top-matched comps best support the ARV.
Projected returns pro-forma
-3.0% appreciation · 8.0% rent growth · sell at horizon
- IRR
- 11.4%
- Equity multiple
- 1.48×
- Total profit
- $228,335
- Equity at exit
- $253,476
- IRR
- 24.1%
- Equity multiple
- 3.60×
- Total profit
- $1,235,424
- Equity at exit
- $146,985
Cash invested: $476,000 (down + closing). Projections, not guarantees.
Landlord ↔ Tenant lean methodology
- Overall (CITY)
- 0 Strongly Tenant-Friendly
- State California
- 18 Strongly Tenant-Friendly · D+13
- County
- — inherits STATE
- City San Francisco
- 0 Strongly Tenant-Friendly · D+57
ZIP-level market 94121
- Rents YoY
- 13.0%
- Active inventory
- 74
- Price-to-rent
- 25.3×
Monthly cashflow live
- Estimated rent
- $22,439 medium interval (Pro) →
- Mortgage (P&I)
- −$8,915
- Tax from tax record
- −$2,060 /mo · $24,718/yr
- Insurance
- −$708
- HOA
- −$0
- Vacancy / Maint / Mgmt
- −$4,712
- Net cashflow
- $6,044
Break-even live
Sensitivity live
| Price | -10% $7,006 | -5% $6,525 | +0% $6,044 | +5% $5,563 | +10% $5,081 |
|---|---|---|---|---|---|
| Rent | -10% $4,271 | -5% $5,157 | +0% $6,044 | +5% $6,930 | +10% $7,816 |
| Rate | -1.0pp $6,900 | -0.5pp $6,476 | base $6,044 | +0.5pp $5,603 | +1.0pp $5,155 |
4-unit breakdown (identical units grouped — click to expand)
| Units | Beds | Baths | Est. rent |
|---|---|---|---|
| 4× units | 5 | 1.5 | $22,440 |
| #1 | 5 | 1.5 | $5,610 |
| #2 | 5 | 1.5 | $5,610 |
| #3 | 5 | 1.5 | $5,610 |
| #4 | 5 | 1.5 | $5,610 |
| Total (4 units) | $22,439 | ||
UW: 25.0% down · 7.5% · 30yr · 1.5% tax · 5.0% vac · 8.0% maint · 8.0% mgmt
Financing live
Cash to close
- Down payment
- $425,000
- Closing costs
- $51,000
- Reserves months
- —
- Total cash needed
- —
Loan-product check · same deal, 3 products live
Conventional
25% down · 7.5% · 30yr
- Down + closing
- —
- Monthly P&I
- —
- Monthly cashflow
- —
- DSCR
- —
- Eligible?
- —
Personal DTI + credit; lowest rate.
DSCR
20% down · 8.5% · 30yr
- Down + closing
- —
- Monthly P&I
- —
- Monthly cashflow
- —
- DSCR
- —
- Eligible?
- —
No personal income docs; deal must DSCR.
Hard money
10% down · 12.0% · 12mo
- Down + closing
- —
- Monthly P&I
- —
- Monthly cashflow
- —
- DSCR
- —
- Eligible?
- —
Short-term bridge; refi at stabilization.
Listing history 1 events
-
2026-05-13$1,700,000 Active 952-char remark
Show marketing remark (952 chars)
Family-Owned Inner Richmond 4-Plex Since 1990 - Photos and Disclosures now available! First time on the market in 64 years! 2745 Anza Street is a classic San Francisco quadruplex in the heart of the vibrant Central Richmond. Held by the same family for over three decades, this well-maintained building is currently undergoing a striking 2026 Warm Modern exterior transformation. This is a rare turn-key income opportunity where the management work has been done for you. All units are currently occupied with rents fully up-to-date on all legal increases. This offers the buyer immediate, stabilized cash flow in a high-demand submarket with a 1.2-month supply of inventory. Situated in a Walker's Paradise, the building is blocks from the culinary gems of Clement Street, Geary Boulevard, and Golden Gate Park. The tenant profile includes protected senior residents, offering long-term stability in one of SF's most resilient rental micro-markets.
ⓘ Source: listings_history table (triggers on properties + properties_extension) + one-shot
backfill from property_details.listing_events for pre-trigger history.
Tax reassessment forecast CA · Resets to sale price
- Current annual tax
- $24,718 · $2,060/mo
- Projected year-2 tax
- $24,718 · $2,060/mo
- Expected delta
- $0/yr ($0/mo · 0.0%)
ⓘ Screening estimate from a state-policy table — verify with the county assessor before closing.
Climate risk First Street
- Flood 1/10 Low FEMA zone X (unshaded) · 0% chance over 30 yrs
- Wildfire 4/10 Moderate
- Heat 2/10 Low 7 d/yr ≥77°F today · 17 d/yr by 30 yrs out
- Wind 1/10 Low
- Air quality 7/10 Severe 13 unhealthy d/yr today · 13 by 30 yrs out
Nearby sold comps map
Loading sold comps map…
Walkable amenities ~0.75 mi
Loading nearby amenities…
Taxation est. · year 1
- Rental income
- $269,268
- − Mortgage interest
- −$95,226
- − Property taxes
- −$24,718
- − Insurance
- −$8,500
- − Repairs & maintenance
- −$21,541
- − Management
- −$21,541
- − Depreciation
- −$49,455
- Taxable income
- $48,286
- Est. tax owed @ 24.0%
- −$11,589
- After-tax cash flow
- $60,935/yr
For passive investors: Depreciation is non-cash, so a rental often shows a tax loss while cash-flowing — sheltering income. Rental losses are passive: they offset passive income freely, and up to $25,000/yr can offset ordinary (W-2) income if you actively participate and your MAGI is under $100k (phasing out to $0 by $150k); unused losses carry forward. On sale, claimed depreciation is recaptured at up to 25%, and gains may owe capital-gains tax (a 1031 exchange can defer both). Figures are a year-1 estimate at your 24.0% rate — not tax advice; consult a CPA.
Schools (NCES district)
- District
- San Francisco Unified
- NCES district ID
- 0634410
- Math proficiency
- 50% ▬ 0.00%
- Reading proficiency
- 56% ▲ 1.00%
- Median HH income
- $81,249
- Composite
- 50.14/100
- National rank
- #4088
- State rank
- #322 of 1400 in CA
Livability — San Francisco
- Score
- 76/100
- State rank
- #90
- US rank
- #3143
Category grades
Schools grade is shown separately in the Schools card above.
Census & demographics
- Census place
- San Francisco, CA
- County
- San Francisco County · 827,552 people
- City population
- 827,552
- Metro
- San Francisco-Oakland-Berkeley, CA
- Population (ZIP)
- 41,995
- Household income
- $133,358
- Rent vs Own
- Severe rent burden
- 2072.0
Population outlook (San Francisco County) Hauer SSP2
- Today (2025)
- 1,030,936 people
- By 2030
- 1,110,409 · +7.7%
- By 2040
- 1,270,010 · +23.2%
- By 2050
- 1,435,001 · +39.2%
- By 2075
- 1,779,074 · +72.6%
- By 2100
- 1,966,767 · +90.8%
Race, ethnicity, and origin ACS 2023
- Neighborhood character
- Diverse neighborhood (Simpson 0.65)
- Race & ethnicity
- Asian 42% White 41% Two or more races 10% Hispanic / Latino 8% Black 2%
- Hispanic origin (detail)
- Mexican 4%
- Common ancestry
- Scotch-Irish 3% Lithuanian 2% Romanian 2%
- Foreign-born
- 35% · China, Canada, Vietnam
- Languages at home
- 59% English-only · Chinese 22% Russian/Polish/Slavic 4% Spanish 4%
Political lean MEDSL · San Francisco
- 2024 margin
- Solid D (+64.8) · D 80.3% · R 15.5% · Other 4.1%
- 2008→2024 swing
- -5.7pp toward R · 2008: 70.5pp · 2024: 64.8pp
- All cycles
- 2024: D+64.8 2020: D+72.5 2016: D+76.1 2012: D+70.2 2008: D+70.5
Not yet ingested
- Civics
- —
Market trends
- HPI YoY
- ▼ -1078.57%
- Current HPI
- 266.5786
- Rent YoY
- ▲ 13.03%
- Metro
- San Francisco-Oakland-Berkeley, CA
- State GDP YoY
- ▲ 3.21%
- F500 in state
- 116
Industry mix (Fortune 500 HQ in CA)
| Industry | F500 HQs | Revenue |
|---|---|---|
| Technology | 27 | $1,492B |
|
||
| Financial Services | 3 | $174B |
|
||
| Retail | 3 | $44B |
|
||
| Insurance | 3 | $26B |
|
||
| Media / Entertainment | 2 | $115B |
|
||
| Pharmaceuticals / Biotech | 2 | $62B |
|
||
Price history
1 event — show timeline
- 2026-05-13 Listed $1,700,000 San Francisco MLS
Property tax history
+15.6%/yrLatest (2025): $24,718 · +3.0% YoY. Source: county tax records.
Cash-flow waterfall
monthlySold comps — $/sqft
last 12 mo · ≤1 miLoading sold comps…