 Multi-family
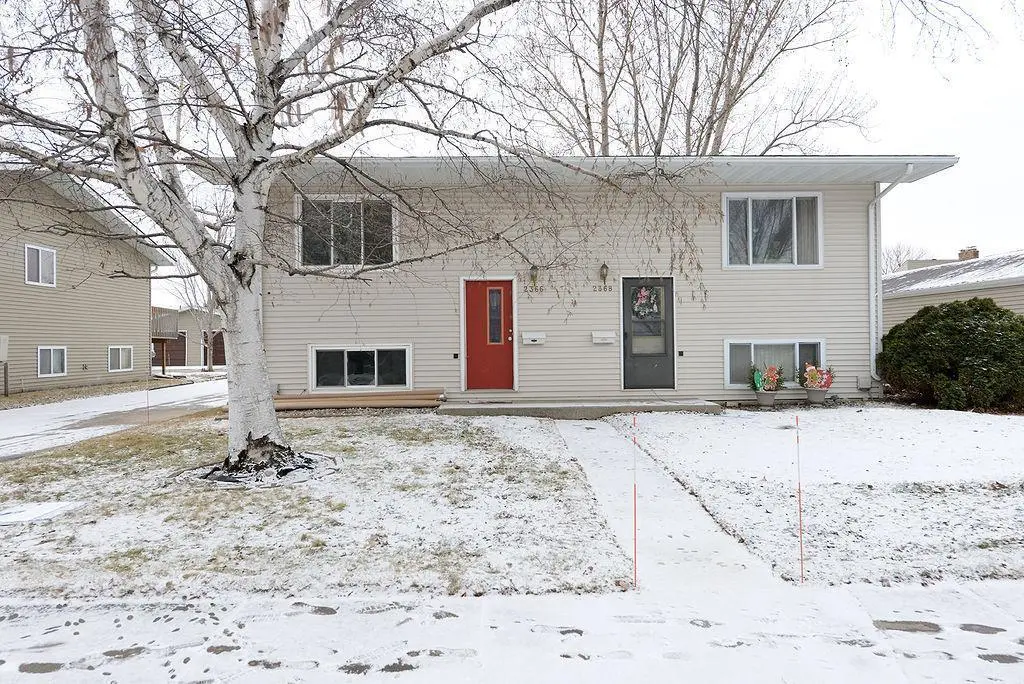
2366 20th Ave S · Fargo, ND
Flood risk 1/10 · Minimal
- FEMA flood zone
- X (shaded)
- Chance of flooding over 30 yrs
- 0.0%
- Est. flood insurance / yr
- $473 – $860
Fire risk 1/10 · Minimal
- Est. fire insurance / yr
- $1,289 – $2,393
Heat risk 2/10 · Minimal
- Hot days now (above 98°F)
- 7 days/yr
- Hot days in 30 yrs
- 12 days/yr
Wind risk 2/10 · Minimal
- Chance of severe wind over 30 yrs
- —
Air-quality risk 3/10 · Minor
- Unhealthy air days now
- 3 days/yr
- Unhealthy air days in 30 yrs
- 3 days/yr
Risk factors via First Street. Map © Google.
Why this score? — see what drove the C- grade
The composite is a weighted blend of 9 inputs, each scored 0–100. Each bar is that input's sub-score; the figure is the points it added to the 100-point composite (weight × sub-score).
- Cash flow +18.3/30.0
- ARV discount +7.5/15.0
- DSCR +5.7/10.0
- 1% rule +4.7/10.0
- Livability +4.2/5.0
- Rent growth +3.7/5.0
- Schools +3.6/10.0
- Condition / age +2.5/5.0
- Appreciation +0.0/10.0
$197,500
🖨 Deal sheet 📄 Offer letter ✓ Due diligence
Multi-family units
County records classify this as Multi-Family (2-4 Unit). Listing-text estimate: 1 unit. estimate disagrees with records
Key facts
- Open living room
- Deck
- 5,662 sq ft lot
Tags
Neighborhood map
What this means for you Summary
Snapshot
- This is a 3-bed/2.0-bath multifamily listed at $198k.
Deal economics
- At list price, monthly cash flow is $180 ($2k/yr) — positive.
- The deal already cash-flows at list — no discount required.
- To meet the 1% rule (rent ≥ 1% of price), the offer needs to be $191k (3.5% below list).
- Recommended offer: $191k (3.5% below list) — sets the bar for 1% rule.
- Cap rate 7.4% vs local median 2.5% in Fargo — top-decile yield for the area; either an underpriced asset or a hidden risk that comps aren't pricing in. Stress-test before assuming the spread holds.
Location & tenants
- Location reads 85/100 on livability (#1 in ND, #605 nationally) — a professional / high-income tenant draw. Strengths: amenities A+, commute A+, cost of living A+; Watch: crime F.
- Fargo 1 (urban): math 41% / reading 44% proficiency, ranked #28 of 53 in ND (top 53%) — families likely to look elsewhere, expect single-tenant / working-renter base with shorter leases.
- Market conditions: Rents rising fast (+5.0%/yr); 208 active listings in the ZIP; 26 comparable units currently listed for rent nearby; rentals leasing fast (median 14d on market — plan ~1-2 weeks tenant-placement turnaround); 1,218 units permitted in Cass County in 2024 (410 in 5+ unit buildings).
- This rent runs 39% of the median local income ($59k/yr) — at the standard rent-burdened threshold; future hikes will face affordability resistance.
Forward outlook
- Local home prices are declining (-3.0%/yr); year-one equity from $1k of loan paydown is wiped out by about $6k of value loss. Plan a longer hold.
- Cass County population projected at +69% by 2050 — long-run rental-demand tailwind backs the buy-and-hold thesis.
Negotiation context
- It's been on market 24 days — a 2% lower offer ($195k) is reasonable based on typical stale-listing flexibility.
- 3 sale attempts since 19y ago with the ask held roughly flat each time — persistent listings suggest the price (not the market) is what's stuck; bring a comps-based counter.
- Current owner paid $106k; list at $198k implies a 86% gain — meaningful room to come down on a strong offer.
Questions for the listing agent
- Built in 1976 — when were the roof, HVAC, electrical panel, plumbing, and water heater last replaced?
- Is there a deadline driving the sale (1031 exchange, divorce, estate, relocation)? That informs how much negotiation room exists.
- Crime grade is F in this area — have there been break-ins, vandalism, or insurance claims at this property in the last 3 years? What carrier currently insures it and at what premium?
- What's the average days-on-market for RENTAL listings here right now (not sales)? A rising rental-DOM trend means longer vacancies and softer asking-rent achievability than the comps imply.
- What's the recent tenant-quality profile in this submarket — average credit score on applications, eviction rate, late-payment / NSF rate, and stable-employment percentage? A property-management company in the area should have these aggregated.
- How much new apartment / multifamily construction is in the pipeline within 1–3 miles? Heavy new supply (>2% of stock underway) typically softens rents 12–24 months out; light construction supports rent growth.
Investment metrics
- 1% rule
- 0.97% ✗
- Cap rate
- 7.39%
- Cash-on-cash
- 3.90%
- DSCR
- 1.17
- GRM
- 8.6
CMA / ARV
No comps found within radius.
Projected returns pro-forma
-3.0% appreciation · 4.95% rent growth · sell at horizon
- IRR
- -8.1%
- Equity multiple
- 0.70×
- Total profit
- $-16,727
- Equity at exit
- $29,448
- IRR
- 3.8%
- Equity multiple
- 1.30×
- Total profit
- $16,489
- Equity at exit
- $17,076
Cash invested: $55,300 (down + closing). Projections, not guarantees.
Landlord ↔ Tenant lean methodology
- Overall (STATE)
- 82 Strongly Landlord-Friendly
- State North Dakota
- 82 Strongly Landlord-Friendly · R+20
- County
- — inherits STATE
- City
- — inherits STATE
ZIP-level market 58103
- Rents YoY
- 5.0%
- Active inventory
- 208
- Price-to-rent
- 17.3×
Monthly cashflow live
- Estimated rent
- $1,906 medium interval (Pro) →
- Mortgage (P&I)
- −$1,036
- Tax from tax record
- −$208 /mo · $2,494/yr
- Insurance
- −$82
- HOA
- −$0
- Vacancy / Maint / Mgmt
- −$400
- Net cashflow
- $180
Break-even live
2-unit breakdown (identical units grouped — click to expand)
| Units | Beds | Baths | Est. rent |
|---|---|---|---|
| 2× units | 3 | 2 | $1,906 |
| #1 | 3 | 2 | $953 |
| #2 | 3 | 2 | $953 |
| Total (2 units) | $1,906 | ||
UW: 25.0% down · 7.5% · 30yr · 1.5% tax · 5.0% vac · 8.0% maint · 8.0% mgmt
Financing live
Cash to close
- Down payment
- $49,375
- Closing costs
- $5,925
- Reserves months
- —
- Total cash needed
- —
Loan-product check · same deal, 3 products live
Conventional
25% down · 7.5% · 30yr
- Down + closing
- —
- Monthly P&I
- —
- Monthly cashflow
- —
- DSCR
- —
- Eligible?
- —
Personal DTI + credit; lowest rate.
DSCR
20% down · 8.5% · 30yr
- Down + closing
- —
- Monthly P&I
- —
- Monthly cashflow
- —
- DSCR
- —
- Eligible?
- —
No personal income docs; deal must DSCR.
Hard money
10% down · 12.0% · 12mo
- Down + closing
- —
- Monthly P&I
- —
- Monthly cashflow
- —
- DSCR
- —
- Eligible?
- —
Short-term bridge; refi at stabilization.
Rent comps 26 comps
| Address | Beds | Baths | Sqft | Rent | $/sqft | DOM | Units | Dist |
|---|---|---|---|---|---|---|---|---|
| 2000 21st Ave S Fargo, ND | 3.0 | 1.0–2.0 | 639 | $1,045 | $1.63 | 13d | 7 | 0.27mi |
| 1900 21st Ave S Fargo, ND | 1.0–2.0 | 1.0 | 767 | $835 | $1.09 | 13d | 4 | 0.28mi |
| 1720 25th Ave S Fargo, ND | 1.0–2.0 | 1.0 | 803 | $1,045 | $1.30 | 13d | 3 | 0.57mi |
| 1502 E Gateway Cir S Unit 105 Fargo, ND | 2.0 | 1.0 | 700 | $675 | $0.96 | 21d | 1 | 0.57mi |
| 1502 E Gateway Cir S Unit 301 Fargo, ND | 2.0 | 1.0 | 700 | $700 | $1.00 | 21d | 1 | 0.57mi |
| 1700 25th Ave S Fargo, ND | 2.0 | 1.0 | 729 | $712 | $0.98 | 13d | 3 | 0.61mi |
| 1843 13 1/2 St S Fargo, ND | 2.0 | 1.0 | 650 | $915 | $1.41 | 13d | 4 | 0.74mi |
| 2601 Pacific Dr S Fargo, ND | 2.0 | 1.0 | 742 | $725 | $0.98 | 13d | 1 | 0.80mi |
| 2610 15th St S Fargo, ND | 2.0 | 1.0 | 415 | $670 | $1.61 | 13d | 6 | 0.86mi |
| 2601 15th St S Fargo, ND | 2.0 | 1.0 | 537 | $820 | $1.53 | 13d | 5 | 0.86mi |
| 3238 15th Ave S Fargo, ND | 1.0–2.0 | 1.0 | 800 | $1,770 | $2.21 | 13d | 1 | 0.87mi |
| 1621 S University Dr Fargo, ND | 2.0 | 1.0–2.0 | 870 | $1,895 | $2.18 | 13d | 13 | 0.87mi |
| 1532 27th Ave S Fargo, ND | 1.0–2.0 | 1.0 | 725 | $855 | $1.18 | 21d | 2 | 1.01mi |
| 3331 15th Ave S Fargo, ND | 1.0–2.0 | 1.0 | 725 | $815 | $1.12 | 13d | 7 | 1.02mi |
| 1102 22nd St S Fargo, ND | 1.0–2.0 | 1.0 | 800 | $815 | $1.02 | 13d | 9 | 1.02mi |
| 2411 30 1/2 Ave S Fargo, ND | 1.0–2.0 | 1.0 | 730 | $795 | $1.09 | 13d | 3 | 1.05mi |
| 1114 University Dr S Unit 3 Fargo, ND | 2.0 | 1.0 | 727 | $850 | $1.17 | 13d | 1 | 1.24mi |
| 3200 22nd St S Fargo, ND | 1.0–3.0 | 1.0–2.0 | 922 | $1,100 | $1.19 | 13d | 11 | 1.26mi |
| 2201 33rd Ave S Fargo, ND | 1.0–2.0 | 1.0 | 812 | $860 | $1.06 | 13d | 9 | 1.32mi |
| 3343 31st Ave S Fargo, ND | 1.0–3.0 | 1.0 | 839 | $905 | $1.08 | 21d | 1 | 1.34mi |
| 3302 31st Ave S Fargo, ND | 1.0–3.0 | 1.0–2.0 | 926 | $1,150 | $1.24 | 13d | 13 | 1.36mi |
| 1848 39th St SW Fargo, ND | 3.0 | 1.0–2.0 | 964 | $1,665 | $1.73 | 13d | 8 | 1.39mi |
| 1721 39th St S Fargo, ND | 1.0–2.0 | 1.0–2.0 | 900 | $990 | $1.10 | 13d | 17 | 1.40mi |
| 1881 39th St SW Fargo, ND | 3.0 | 1.0–2.0 | 900 | $1,140 | $1.27 | 13d | 12 | 1.42mi |
| 1625 33rd Ave S Fargo, ND | 3.0 | 1.0–2.0 | 755 | $1,180 | $1.56 | 13d | 9 | 1.44mi |
| 1882 39th St S Fargo, ND | 2.0 | 1.0–2.0 | 888 | $1,640 | $1.85 | 13d | 6 | 1.46mi |
Listing history 13 events
-
2026-04-20status Pending
-
2026-04-06historical Contingent - Inspection
-
2026-03-27$197,500 Active
-
2026-03-20status Pending
-
2026-03-20historical
-
2026-03-13historical Contingent - Inspection
-
2026-03-11$189,900 Active
-
2013-10-22soldstatus $106,000
-
2013-07-11soldstatus $112,000
-
2007-12-28soldstatus $106,000
-
2007-12-27soldstatus $106,000
-
2007-10-16historical
-
2007-05-30$104,900
ⓘ Source: listings_history table (triggers on properties + properties_extension) + one-shot
backfill from property_details.listing_events for pre-trigger history.
Tax reassessment forecast ND · Resets to sale price
- Current annual tax
- $2,494 · $208/mo
- Projected year-2 tax
- $2,494 · $208/mo
- Expected delta
- $0/yr ($0/mo · 0.0%)
ⓘ Screening estimate from a state-policy table — verify with the county assessor before closing.
Climate risk First Street
- Flood 1/10 Low FEMA zone X (shaded) · 0% chance over 30 yrs
- Wildfire 1/10 Low
- Heat 2/10 Low 7 d/yr ≥98°F today · 12 d/yr by 30 yrs out
- Wind 2/10 Low
- Air quality 3/10 Moderate 3 unhealthy d/yr today · 3 by 30 yrs out
Nearby sold comps map
Loading sold comps map…
Walkable amenities ~0.75 mi
Loading nearby amenities…
Taxation est. · year 1
- Rental income
- $22,872
- − Mortgage interest
- −$11,063
- − Property taxes
- −$2,494
- − Insurance
- −$988
- − Repairs & maintenance
- −$1,830
- − Management
- −$1,830
- − Depreciation
- −$5,745
- Taxable loss
- −$1,077
- Est. tax savings @ 24.0%
- +$259
- After-tax cash flow
- $2,418/yr
For passive investors: Depreciation is non-cash, so a rental often shows a tax loss while cash-flowing — sheltering income. Rental losses are passive: they offset passive income freely, and up to $25,000/yr can offset ordinary (W-2) income if you actively participate and your MAGI is under $100k (phasing out to $0 by $150k); unused losses carry forward. On sale, claimed depreciation is recaptured at up to 25%, and gains may owe capital-gains tax (a 1031 exchange can defer both). Figures are a year-1 estimate at your 24.0% rate — not tax advice; consult a CPA.
Schools (NCES district)
- District
- Fargo 1
- NCES district ID
- 3806780
- Math proficiency
- 41% ▼ -7.00%
- Reading proficiency
- 44% ▼ -7.00%
- Median HH income
- $46,524
- Composite
- 36.23/100
- National rank
- #4721
- State rank
- #28 of 53 in ND
Livability — Fargo
- Score
- 85/100
- State rank
- #1
- US rank
- #605
Category grades
Schools grade is shown separately in the Schools card above.
Census & demographics
- Census place
- Fargo, ND
- County
- Cass County · 177,143 people
- City population
- 130,876
- Metro
- Fargo, ND-MN
- Population (ZIP)
- 48,796
- Household income
- $58,801
- Rent vs Own
- Severe rent burden
- 1782.0
Population outlook (Cass County) Hauer SSP2
- Today (2025)
- 223,771 people
- By 2030
- 251,835 · +12.5%
- By 2040
- 311,816 · +39.3%
- By 2050
- 378,694 · +69.2%
- By 2075
- 571,386 · +155.3%
- By 2100
- 769,727 · +244.0%
Race, ethnicity, and origin ACS 2023
- Neighborhood character
- Predominantly White (74%)
- Race & ethnicity
- White 74% Black 12% Two or more races 5% Asian 4% Hispanic / Latino 4% Native American 2%
- Common ancestry
- Portuguese 23% Swiss 4% Lithuanian 3%
- Foreign-born
- 15% · Canada, India, South Korea
- Languages at home
- 86% English-only · Other Indo-European 4% Arabic 1% Spanish 1%
Political lean MEDSL · Cass
- 2024 margin
- Lean R (+8.4) · D 44.9% · R 53.3% · Other 1.9%
- 2008→2024 swing
- -15.5pp toward R · 2008: 7.1pp · 2024: -8.4pp
- All cycles
- 2024: R+8.4 2020: R+2.7 2016: R+10.7 2012: R+3.0 2008: D+7.1
Not yet ingested
- Civics
- —
Market trends
- HPI YoY
- ▼ -143.86%
- Current HPI
- 163.2804
- Rent YoY
- ▲ 4.95%
- Metro
- Fargo, ND-MN
- State GDP YoY
- ▲ 2.09%
- F500 in state
- 2
Industry mix (Fortune 500 HQ in ND)
| Industry | F500 HQs | Revenue |
|---|---|---|
| Utilities / Construction | 1 | $6B |
|
||
Price history
+88.3% since first listed13 events — show timeline
- 2026-04-20 Pending — NORTHSTARMLS as Distributed by MLS Grid
- 2026-04-06 Contingent — NORTHSTARMLS as Distributed by MLS Grid
- 2026-03-27 Listed $197,500 NORTHSTARMLS as Distributed by MLS Grid
- 2026-03-20 Pending — NORTHSTARMLS as Distributed by MLS Grid
- 2026-03-20 Listing Removed — NORTHSTARMLS as Distributed by MLS Grid
- 2026-03-13 Contingent — NORTHSTARMLS as Distributed by MLS Grid
- 2026-03-11 Listed $189,900 NORTHSTARMLS as Distributed by MLS Grid
- 2013-10-22 Sold (Public Records) $106,000 Public Records
- 2013-07-11 Sold (Public Records) $112,000 Public Records
- 2007-12-28 Sold (Public Records) $106,000 Public Records
- 2007-12-27 Sold (MLS) $106,000 NORTHSTARMLS as Distributed by MLS Grid
- 2007-10-16 Listing Removed — NORTHSTARMLS as Distributed by MLS Grid
- 2007-05-30 Listed $104,900 NORTHSTARMLS as Distributed by MLS Grid
Property tax history
+6.3%/yrLatest (2025): $2,494 · +6.6% YoY. Source: county tax records.
Cash-flow waterfall
monthlySold comps — $/sqft
last 12 mo · ≤1 miLoading sold comps…