402 Abel St · Greenville, NC
Flood risk 1/10 · Minimal
- FEMA flood zone
- X (unshaded)
- Chance of flooding over 30 yrs
- 0.0%
- Est. flood insurance / yr
- $507 – $1,088
Fire risk 1/10 · Minimal
- Est. fire insurance / yr
- $906 – $1,684
Heat risk 8/10 · Major
- Hot days now (above 106°F)
- 7 days/yr
- Hot days in 30 yrs
- 17 days/yr
Wind risk 8/10 · Major
- Chance of severe wind over 30 yrs
- 80.0%
Air-quality risk 3/10 · Minor
- Unhealthy air days now
- 3 days/yr
- Unhealthy air days in 30 yrs
- 3 days/yr
Risk factors via First Street. Map © Google.
Why this score? — see what drove the B grade
The composite is a weighted blend of 9 inputs, each scored 0–100. Each bar is that input's sub-score; the figure is the points it added to the 100-point composite (weight × sub-score).
- Cash flow +28.5/30.0
- ARV discount +15.0/15.0
- DSCR +10.0/10.0
- 1% rule +7.5/10.0
- Rent growth +3.9/5.0
- Livability +3.9/5.0
- Schools +3.6/10.0
- Condition / age +2.5/5.0
- Appreciation +0.0/10.0
$110,000
🖨 Deal sheet 📄 Offer letter ✓ Due diligence
Listing remarks
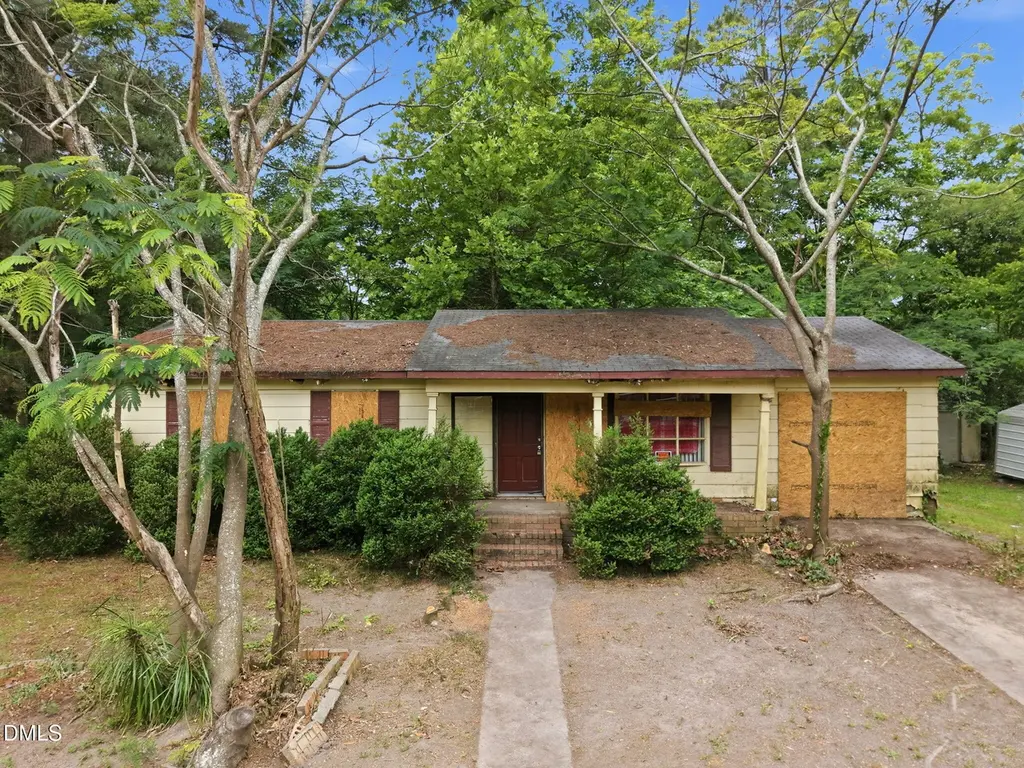
Opportunity is knocking in one of Greenville's established neighborhoods. This 3-bedroom, 1-bath home sits on a generous . 19-acre lot in the Carolina Heights subdivision of Pitt County -- offering the canvas that savvy buyers and investors have been waiting for. Step inside and discover 1,296 square feet of functional living space with the primary bedroom conveniently located on the main floor. The layout is straightforward and practical, making it easy to envision your renovation vision come to life. Outside, a standout outbuilding adds exceptional versatility -- whether you need a workshop, storage, or studio space, this bonus structure is a rare find at this price point. The location tr
Key facts
- Generous lot
- Standout outbuilding
- 8,276 sq ft lot
Tags
Property features AI
Finance
- Other: Zoning: R6S; Lot size about 0.19 acres
- HOA & community: No association
Exterior
- Parking: Open parking
- Utilities: Public water; Public sewer
- Home design: Site-built single-story home; One level
- Construction: Brick veneer and vinyl siding construction
- Exterior features: Asphalt and asbestos shingle roof; Brick veneer and vinyl siding
Interior
- Bedrooms: Three bedrooms (all on the main level)
- Flooring: Carpet; Linoleum
- Bathrooms: 1 full bathroom; 1 half bathroom
- Heating & cooling: Heat pump heating; Central air conditioning
- Interior features: Carpet and linoleum flooring
Neighborhood map
What this means for you Summary
Snapshot
- This is a 3-bed/1.5-bath single-family listed at $110k.
Deal economics
- At list price, monthly cash flow is $359 ($4k/yr) — positive.
- The deal already cash-flows at list — no discount required.
- Meets the 1% rule at list price ($1k rent vs $110k).
- Cap rate 10.2% vs local median 3.8% in Greenville — top-decile yield for the area; either an underpriced asset or a hidden risk that comps aren't pricing in. Stress-test before assuming the spread holds.
Location & tenants
- Location reads 77/100 on livability (#30 in NC, #2,977 nationally) — a middle-class / working-renter tenant base. Strengths: commute A+, cost of living A+, health & safety A+; Watch: schools C-, crime F, employment F.
- Pitt County Schools (rural): math 41% / reading 44% proficiency, ranked #100 of 178 in NC (top 56%) — families likely to look elsewhere, expect single-tenant / working-renter base with shorter leases.
- Market conditions: Rents rising fast (+5.4%/yr); 350 active listings in the ZIP; 16 comparable units currently listed for rent nearby; rentals at typical pace (median 21d on market — plan ~3-4 weeks tenant-placement turnaround); 1,300 units permitted in Pitt County in 2024 (204 in 5+ unit buildings).
- This rent runs 34% of the median local income ($49k/yr) — at the standard rent-burdened threshold; future hikes will face affordability resistance.
Forward outlook
- Local home prices are declining (-3.0%/yr); year-one equity from $761 of loan paydown is wiped out by about $3k of value loss. Plan a longer hold.
- Pitt County population projected at +22% by 2050 — long-run rental-demand tailwind backs the buy-and-hold thesis.
- At projected returns (-3.0% appreciation + 5.4% rent growth), your $31k cash investment doubles in ~7 years — after that, you're playing with house money.
Negotiation context
- Only 7 days on market — expect competitive offers; lowballing is unlikely to land.
Risks & watch-outs
- Climate carrying-cost: severe wind risk, 80% chance of damaging wind over 30y; extreme-heat days projected 7→17/yr by 2055 (HVAC capex compounding) — expect insurance premiums to compound above CPI over the hold.
Questions for the listing agent
- Built in 1973 — when were the roof, HVAC, electrical panel, plumbing, and water heater last replaced?
- Is there a deadline driving the sale (1031 exchange, divorce, estate, relocation)? That informs how much negotiation room exists.
- Crime grade is F in this area — have there been break-ins, vandalism, or insurance claims at this property in the last 3 years? What carrier currently insures it and at what premium?
- What's the average days-on-market for RENTAL listings here right now (not sales)? A rising rental-DOM trend means longer vacancies and softer asking-rent achievability than the comps imply.
- What's the recent tenant-quality profile in this submarket — average credit score on applications, eviction rate, late-payment / NSF rate, and stable-employment percentage? A property-management company in the area should have these aggregated.
- How much new for-sale + rental construction is in the pipeline within 1–3 miles? Heavy new supply typically softens prices + rents 12–24 months out; constrained supply supports both.
Investment metrics
- 1% rule
- 1.25% ✓
- Cap rate
- 10.21%
- Cash-on-cash
- 13.98%
- DSCR
- 1.62
- GRM
- 6.7
CMA / ARV
- ARV (on-the-fly)
- $139,968
- Comps found
- 10
Show comp detail 10 sales within ~0.75 mi
| Address | Dist | Beds/Ba | Sqft | Sold | Price | $/sf | Match |
|---|---|---|---|---|---|---|---|
| 402 Abel St | 0.00mi | 3/1.5 | 1,296 (0%) | 0mo | $99,000 | $76 | 100 |
| 503 Pittman Dr | 0.11mi | 3/1.0 | 1,150 (-11%) | 4mo | $137,500 | $120 | 71 |
| 2704 Shawnee Pl | 0.38mi | 3/1.0 | 1,209 (-7%) | 1mo | $179,900 | $149 | 68 |
| 309 N Sylvan Dr | 0.14mi | 3/1.0 | 1,132 (-13%) | 12mo | $75,000 | $66 | 60 |
| 1519 Broad St | 0.65mi | 3/1.0 | 1,332 (+3%) | 9mo | $23,000 | $17 | 56 |
| 203 Arlington Cir | 0.28mi | 3/2.0 | 1,487 (+15%) | 9mo | $190,000 | $128 | 53 |
| 205 Millbrook St | 0.50mi | 2/2.0 (-1) | 1,259 (-3%) | 16mo | $135,000 | $107 | 52 |
| 301 Millbrook St | 0.50mi | 3/1.0 | 1,120 (-14%) | 3mo | $110,000 | $98 | 49 |
| 207 Millbrook St | 0.50mi | 3/1.0 | 1,384 (+7%) | 17mo | $150,000 | $108 | 49 |
| 307 Clairmont Cir | 0.69mi | 4/1.0 (+1) | 1,162 (-10%) | 9mo | $165,000 | $142 | 36 |
Match score weights: distance 35% · size 25% · config 20% · recency 20%. Top-matched comps best support the ARV.
Projected returns pro-forma
-3.0% appreciation · 5.44% rent growth · sell at horizon
- IRR
- 6.9%
- Equity multiple
- 1.28×
- Total profit
- $8,482
- Equity at exit
- $16,401
- IRR
- 18.2%
- Equity multiple
- 2.68×
- Total profit
- $51,698
- Equity at exit
- $9,511
Cash invested: $30,800 (down + closing). Projections, not guarantees.
Landlord ↔ Tenant lean methodology
- Overall (STATE)
- 85 Strongly Landlord-Friendly
- State North Carolina
- 85 Strongly Landlord-Friendly · R+3
- County
- — inherits STATE
- City
- — inherits STATE
ZIP-level market 27834
- Rents YoY
- 5.4%
- Active inventory
- 350
- Price-to-rent
- 6.7×
Monthly cashflow live
- Estimated rent
- $1,372 high interval (Pro) →
- Mortgage (P&I)
- −$577
- Tax from tax record
- −$102 /mo · $1,228/yr
- Insurance
- −$46
- HOA
- −$0
- Vacancy / Maint / Mgmt
- −$288
- Net cashflow
- $359
Break-even live
UW: 25.0% down · 7.5% · 30yr · 1.5% tax · 5.0% vac · 8.0% maint · 8.0% mgmt
Financing live
Cash to close
- Down payment
- $27,500
- Closing costs
- $3,300
- Reserves months
- —
- Total cash needed
- —
Loan-product check · same deal, 3 products live
Conventional
25% down · 7.5% · 30yr
- Down + closing
- —
- Monthly P&I
- —
- Monthly cashflow
- —
- DSCR
- —
- Eligible?
- —
Personal DTI + credit; lowest rate.
DSCR
20% down · 8.5% · 30yr
- Down + closing
- —
- Monthly P&I
- —
- Monthly cashflow
- —
- DSCR
- —
- Eligible?
- —
No personal income docs; deal must DSCR.
Hard money
10% down · 12.0% · 12mo
- Down + closing
- —
- Monthly P&I
- —
- Monthly cashflow
- —
- DSCR
- —
- Eligible?
- —
Short-term bridge; refi at stabilization.
Rent comps 16 comps
| Address | Beds | Baths | Sqft | Rent | $/sqft | DOM | Units | Dist |
|---|---|---|---|---|---|---|---|---|
| 1710 Garland St Greenville, NC | 2.0 | 1.0 | 884 | $1,195 | $1.35 | 21d | 1 | 0.56mi |
| 600 Howell St Apt E Greenville, NC | 2.0 | 1.0 | 1050 | $815 | $0.78 | 21d | 1 | 0.66mi |
| 1151 Cross Creek Cir Unit D Greenville, NC | 3.0 | 2.5 | 1338 | $1,550 | $1.16 | 13d | 1 | 0.69mi |
| 1151 Cross Creek Cir Greenville, NC | 3.0 | 2.5 | 1338 | $1,600 | $1.20 | 21d | 1 | 0.74mi |
| 1150 Cross Creek Cir Greenville, NC | 2.0 | 2.0 | 1100 | $1,200 | $1.09 | 21d | 1 | 0.75mi |
| 1035 Spring Forest Rd Greenville, NC | 3.0 | 2.0–2.5 | 1453 | $1,450 | $1.00 | 21d | 2 | 0.80mi |
| 904 Gabriel Dr Greenville, NC | 1.0–2.0 | 1.0–2.0 | 966 | $1,875 | $1.94 | 21d | 17 | 0.84mi |
| 1015 Spring Forest Rd Unit F5 Greenville, NC | 3.0 | 2.5 | 1453 | $1,200 | $0.83 | 21d | 1 | 0.84mi |
| 1304 Myrtle St Greenville, NC | 3.0 | 1.0 | 978 | $1,375 | $1.41 | 21d | 1 | 0.92mi |
| 935 Spring Forest Rd Greenville, NC | 2.0 | 2.0 | 1000 | $1,299 | $1.30 | 21d | 4 | 0.97mi |
| 504 Davenport St Unit A Greenville, NC | 2.0 | 1.0 | 900 | $895 | $0.99 | 13d | 1 | 0.98mi |
| 1510 Bridle Ct Greenville, NC | 1.0–3.0 | 1.0–2.0 | 798 | $1,250 | $1.57 | 21d | 1 | 1.11mi |
| 1612 Lincoln Dr Greenville, NC | 3.0 | 1.0 | 972 | $900 | $0.93 | 13d | 1 | 1.17mi |
| 550 Pitt-Greene Connector Greenville, NC | 4.0 | 1.0–4.0 | 1012 | $1,288 | $1.27 | 13d | 25 | 1.39mi |
| 3709 Nantucket Rd Unit A Greenville, NC | 3.0 | 2.0 | 1427 | $1,700 | $1.19 | 13d | 1 | 1.46mi |
| 206 Hudson St Greenville, NC | 2.0 | 1.0 | 1150 | $900 | $0.78 | 21d | 1 | 1.47mi |
Listing history 2 events
-
2026-05-19status Pending
-
2026-05-12$110,000 Active
ⓘ Source: listings_history table (triggers on properties + properties_extension) + one-shot
backfill from property_details.listing_events for pre-trigger history.
Tax reassessment forecast NC · Resets to sale price
- Current annual tax
- $1,228 · $102/mo
- Projected year-2 tax
- $1,228 · $102/mo
- Expected delta
- $0/yr ($0/mo · 0.0%)
ⓘ Screening estimate from a state-policy table — verify with the county assessor before closing.
Climate risk First Street
- Flood 1/10 Low FEMA zone X (unshaded) · 0% chance over 30 yrs
- Wildfire 1/10 Low
- Heat 8/10 Severe 7 d/yr ≥106°F today · 17 d/yr by 30 yrs out
- Wind 8/10 Severe 80% chance of damaging wind over 30 yrs
- Air quality 3/10 Moderate 3 unhealthy d/yr today · 3 by 30 yrs out
Nearby sold comps map
Loading sold comps map…
Walkable amenities ~0.75 mi
Loading nearby amenities…
Taxation est. · year 1
- Rental income
- $16,464
- − Mortgage interest
- −$6,162
- − Property taxes
- −$1,228
- − Insurance
- −$550
- − Repairs & maintenance
- −$1,317
- − Management
- −$1,317
- − Depreciation
- −$3,200
- Taxable income
- $2,690
- Est. tax owed @ 24.0%
- −$646
- After-tax cash flow
- $3,661/yr
For passive investors: Depreciation is non-cash, so a rental often shows a tax loss while cash-flowing — sheltering income. Rental losses are passive: they offset passive income freely, and up to $25,000/yr can offset ordinary (W-2) income if you actively participate and your MAGI is under $100k (phasing out to $0 by $150k); unused losses carry forward. On sale, claimed depreciation is recaptured at up to 25%, and gains may owe capital-gains tax (a 1031 exchange can defer both). Figures are a year-1 estimate at your 24.0% rate — not tax advice; consult a CPA.
Schools (NCES district)
- District
- Pitt County Schools
- NCES district ID
- 3700012
- Math proficiency
- 41% ▬ 0.00%
- Reading proficiency
- 44% ▲ 2.00%
- Median HH income
- $40,631
- Composite
- 35.67/100
- National rank
- #4877
- State rank
- #100 of 178 in NC
Livability — Greenville
- Score
- 77/100
- State rank
- #30
- US rank
- #2977
Category grades
Schools grade is shown separately in the Schools card above.
Census & demographics
- Census place
- Greenville, NC
- County
- Pitt County · 142,592 people
- City population
- 115,121
- Metro
- Greenville, NC
- Population (ZIP)
- 56,347
- Household income
- $48,935
- Rent vs Own
- Severe rent burden
- 3319.0
Population outlook (Pitt County) Hauer SSP2
- Today (2025)
- 194,585 people
- By 2030
- 203,756 · +4.7%
- By 2040
- 220,807 · +13.5%
- By 2050
- 236,614 · +21.6%
- By 2075
- 275,940 · +41.8%
- By 2100
- 300,058 · +54.2%
Race, ethnicity, and origin ACS 2023
- Neighborhood character
- Diverse neighborhood (Simpson 0.59)
- Race & ethnicity
- Black 54% White 33% Hispanic / Latino 8% Two or more races 3% Asian 2%
- Hispanic origin (detail)
- Mexican 7%
- Common ancestry
- Lithuanian 1% Slovak 1% Romanian 1%
- Foreign-born
- 7% · Canada, China
- Languages at home
- 91% English-only · Spanish 6% Other Asian/Pacific 1%
Political lean MEDSL · Pitt
- 2024 margin
- Lean D (+6.0) · D 52.5% · R 46.5% · Other 1.1%
- 2008→2024 swing
- -2.8pp toward R · 2008: 8.8pp · 2024: 6.0pp
- All cycles
- 2024: D+6.0 2020: D+9.4 2016: D+7.4 2012: D+6.7 2008: D+8.8
Not yet ingested
- Civics
- —
Market trends
- HPI YoY
- ▼ -187.99%
- Current HPI
- 190.6869
- Rent YoY
- ▲ 5.44%
- Metro
- Greenville, NC
- State GDP YoY
- ▲ 3.28%
- F500 in state
- 26
Industry mix (Fortune 500 HQ in NC)
| Industry | F500 HQs | Revenue |
|---|---|---|
| Financial Services | 2 | $213B |
|
||
| Retail | 2 | $95B |
|
||
| Industrial Conglomerate | 1 | $38B |
|
||
| Metals / Steel | 1 | $35B |
|
||
| Utilities | 1 | $30B |
|
||
| Industrial Machinery | 1 | $19B |
|
||
Price history
2 events — show timeline
- 2026-05-19 Pending — TMLS
- 2026-05-12 Listed $110,000 TMLS
Property tax history
+3.0%/yrLatest (2025): $1,228 · +1.0% YoY. Source: county tax records.
Cash-flow waterfall
monthlySold comps — $/sqft
last 12 mo · ≤1 miLoading sold comps…