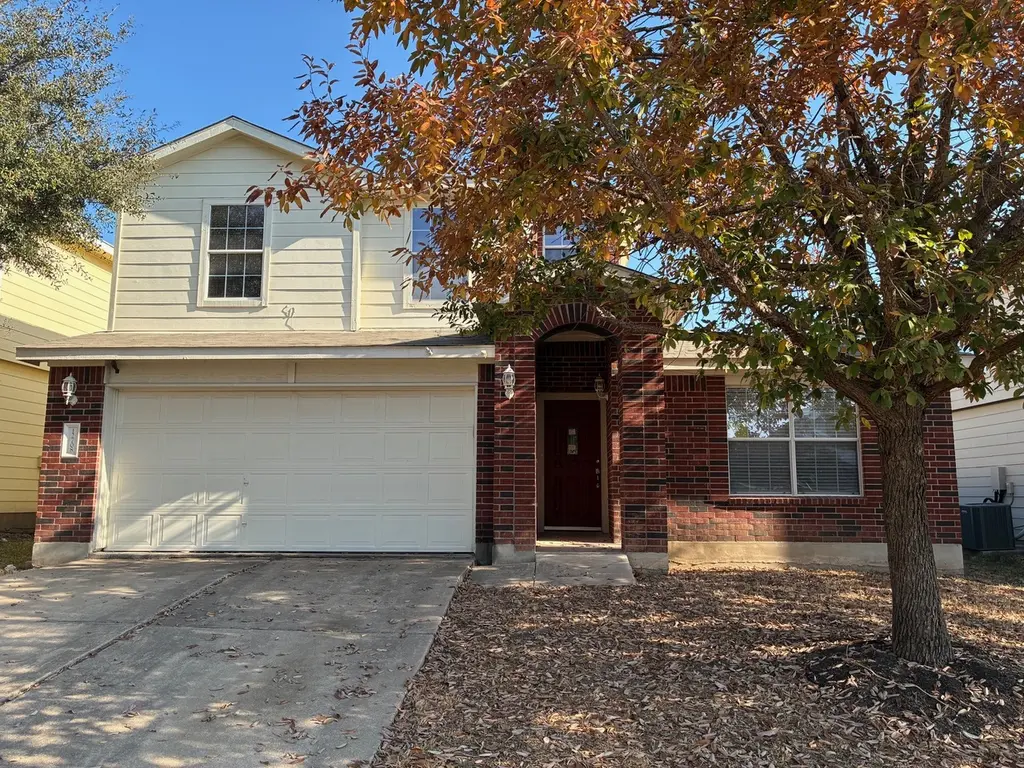
12708 La Paz Ln · Austin, TX
Flood risk 1/10 · Minimal
- FEMA flood zone
- X (unshaded)
- Chance of flooding over 30 yrs
- 0.0%
- Est. flood insurance / yr
- $507 – $1,088
Fire risk 5/10 · Moderate
- Est. fire insurance / yr
- $1,222 – $2,270
Heat risk 8/10 · Major
- Hot days now (above 108°F)
- 7 days/yr
- Hot days in 30 yrs
- 23 days/yr
Wind risk 8/10 · Major
- Chance of severe wind over 30 yrs
- 80.0%
Air-quality risk 1/10 · Minimal
- Unhealthy air days now
- 0 days/yr
- Unhealthy air days in 30 yrs
- 0 days/yr
Risk factors via First Street. Map © Google.
Why this score? — see what drove the D grade
The composite is a weighted blend of 9 inputs, each scored 0–100. Each bar is that input's sub-score; the figure is the points it added to the 100-point composite (weight × sub-score).
- ARV discount +15.0/15.0
- Cash flow +6.9/30.0
- Livability +4.1/5.0
- Appreciation +3.4/10.0
- 1% rule +3.3/10.0
- Condition / age +2.5/5.0
- Rent growth +2.4/5.0
- Schools +1.9/10.0
- DSCR +1.2/10.0
$289,900
🖨 Deal sheet (PDF) 📄 Offer letter ✓ Due diligence
Listing remarks MLS
Home was originally a 4 bedroom but several additional rooms were created by adding walls and doors. See attached showing original floor plan. Features covered patio and outdoor kitchen. Please note: There is NO survey and NO sellers disclosure
Key facts
- Covered patio
- Outdoor kitchen
- 6,011 sq ft lot
Tags
Neighborhood map
What this means for you Summary
Snapshot
- This is a 5-bed/3.0-bath single-family listed at $290k.
Deal economics
- At list price, monthly cash flow is $-433 ($-5k/yr) — negative.
- To cash-flow at today's rent, offer at most $213k (26.4% below list).
- To meet the 1% rule (rent ≥ 1% of price), the offer needs to be $241k (17.0% below list).
- Recommended offer: $213k (26.4% below list) — sets the bar for cash-flow.
- Cap rate 4.5% vs local median 1.8% in Austin — top-decile yield for the area; either an underpriced asset or a hidden risk that comps aren't pricing in. Stress-test before assuming the spread holds.
Location & tenants
- Location reads 82/100 on livability (#16 in TX, #1,208 nationally) — a professional / high-income tenant draw. Strengths: amenities A+, commute A+, employment A+; Watch: cost of living D, crime F.
- Del Valle ISD (rural): math 19% / reading 26% proficiency, ranked #749 of 826 in TX (top 91%) — low school quality limits family demand, transient renter base, plan for 1-2y turnover; 77% free/reduced lunch — lower-income household profile, screen leases tightly.
- Zoned schools: Del Valle El (math 22% / reading 22%, grade F, #3,333 of 4,322 statewide, top 80%, 615 students, 89% FRL); Del Valle H S (math 17% / reading 28%, grade F, #1,354 of 1,632 statewide, top 83%, 3,460 students, 90% FRL).
- Market conditions: Rents soft (-0.4%/yr); 251 active listings in the ZIP; 8 comparable units currently listed for rent nearby; rentals at typical pace (median 26d on market — plan ~3-4 weeks tenant-placement turnaround); 17,121 units permitted in Travis County in 2024 (11,963 in 5+ unit buildings).
- This rent runs 40% of the median local income ($72k/yr) — at the standard rent-burdened threshold; future hikes will face affordability resistance.
Forward outlook
- Local home prices are declining (-3.0%/yr); year-one equity from $2k of loan paydown is wiped out by about $9k of value loss. Plan a longer hold.
- Travis County population projected at +60% by 2050 — long-run rental-demand tailwind backs the buy-and-hold thesis.
Negotiation context
- It's been on market 117 days — a 9% lower offer ($264k) is reasonable based on typical stale-listing flexibility.
- 10 sale attempts since 19y ago with the ask held roughly flat each time — persistent listings suggest the price (not the market) is what's stuck; bring a comps-based counter.
Risks & watch-outs
- Watch-outs: property tax is 2.8% of price.
- Climate carrying-cost: severe wind risk, 80% chance of damaging wind over 30y; moderate wildfire risk; extreme-heat days projected 7→23/yr by 2055 (HVAC capex compounding) — expect insurance premiums to compound above CPI over the hold.
Questions for the listing agent
- What do current leases actually rent for vs. the listed asking? Can we see a recent rent roll and the last 12 months of T-12 income?
- It's been on market 117 days. Have you received any prior offers? Is the seller open to a 26% concession, seller financing, or rate buy-down credit?
- Property tax is high relative to price — has the assessment been appealed recently, and will the sale trigger a re-assessment?
- What does the HOA fee cover, when was the last increase, and are there any pending special assessments or reserve-fund shortfalls?
- Why hasn't it sold? Are there any deal-killer items the seller is aware of (foundation, flood, title, zoning, code violations)?
- Is there a deadline driving the sale (1031 exchange, divorce, estate, relocation)? That informs how much negotiation room exists.
- Crime grade is F in this area — have there been break-ins, vandalism, or insurance claims at this property in the last 3 years? What carrier currently insures it and at what premium?
- The area grade is low — what's the realistic commute time and amenity access for the typical tenant pool here? Any planned neighborhood developments (good or bad) we should know about?
- What's the average days-on-market for RENTAL listings here right now (not sales)? A rising rental-DOM trend means longer vacancies and softer asking-rent achievability than the comps imply.
- What's the recent tenant-quality profile in this submarket — average credit score on applications, eviction rate, late-payment / NSF rate, and stable-employment percentage? A property-management company in the area should have these aggregated.
- How much new for-sale + rental construction is in the pipeline within 1–3 miles? Heavy new supply typically softens prices + rents 12–24 months out; constrained supply supports both.
Investment metrics
- 1% rule
- 0.83% ✗
- Cap rate
- 4.50%
- Cash-on-cash
- -6.40%
- DSCR
- 0.72
- GRM
- 10.0
CMA / ARV
- ARV (median comp)
- $355,952
- List price
- $289,900
- Delta
- -18.56%
- Verdict
- UNDERPRICED
- Comps
- 20 within 1.0 mi
Show comp detail 4 sales within ~0.75 mi
| Address | Dist | Beds/Ba | Sqft | Sold | Price | $/sf | Match |
|---|---|---|---|---|---|---|---|
| 6512 Wagon Spring St | 0.63mi | 4/2.5 (-1) | 2,494 (-5%) | 1mo | $365,000 | $146 | 54 |
| 12312 Ferrystone Glen Dr | 0.58mi | 4/2.5 (-1) | 2,633 (0%) | 20mo | $400,000 | $152 | 49 |
| 6813 Horseshoe Pond Dr | 0.65mi | 5/2.5 | 2,466 (-6%) | 11mo | $359,000 | $146 | 48 |
| 12001 Foley Dr | 0.61mi | 4/2.0 (-1) | 2,369 (-10%) | 11mo | $865,000 | $365 | 36 |
Match score weights: distance 35% · size 25% · config 20% · recency 20%. Top-matched comps best support the ARV.
Projected returns pro-forma
-3.0% appreciation · 0.0% rent growth · sell at horizon
- IRR
- -31.3%
- Equity multiple
- -0.00×
- Total profit
- $-81,378
- Equity at exit
- $43,225
- IRR
- -60.8%
- Equity multiple
- -0.63×
- Total profit
- $-132,674
- Equity at exit
- $25,065
Cash invested: $81,172 (down + closing). Projections, not guarantees.
Landlord ↔ Tenant lean methodology
- Overall (STATE)
- 87 Strongly Landlord-Friendly
- State Texas
- 87 Strongly Landlord-Friendly · R+5
- County
- — inherits STATE
- City
- — inherits STATE
ZIP-level market 78617
- Home prices YoY
- -1.7%
- Rents YoY
- -0.4%
- Active inventory
- 251
- Price-to-rent
- 10.0×
Monthly cashflow live
- Estimated rent
- $2,407 high interval (Pro) →
- Mortgage (P&I)
- −$1,520
- Tax from tax record
- −$665 /mo · $7,976/yr
- Insurance
- −$121
- HOA
- −$29
- Vacancy / Maint / Mgmt
- −$505
- Net cashflow
- $-433
Break-even live
Sensitivity live
| Price | -10% $-269 | -5% $-351 | +0% $-433 | +5% $-515 | +10% $-597 |
|---|---|---|---|---|---|
| Rent | -10% $-623 | -5% $-528 | +0% $-433 | +5% $-338 | +10% $-243 |
| Rate | -1.0pp $-287 | -0.5pp $-359 | base $-433 | +0.5pp $-508 | +1.0pp $-585 |
UW: 25.0% down · 7.5% · 30yr · 1.5% tax · 5.0% vac · 8.0% maint · 8.0% mgmt
Financing live
Cash to close
- Down payment
- $72,475
- Closing costs
- $8,697
- Reserves months
- —
- Total cash needed
- —
Loan-product check · same deal, 3 products live
Conventional
25% down · 7.5% · 30yr
- Down + closing
- —
- Monthly P&I
- —
- Monthly cashflow
- —
- DSCR
- —
- Eligible?
- —
Personal DTI + credit; lowest rate.
DSCR
20% down · 8.5% · 30yr
- Down + closing
- —
- Monthly P&I
- —
- Monthly cashflow
- —
- DSCR
- —
- Eligible?
- —
No personal income docs; deal must DSCR.
Hard money
10% down · 12.0% · 12mo
- Down + closing
- —
- Monthly P&I
- —
- Monthly cashflow
- —
- DSCR
- —
- Eligible?
- —
Short-term bridge; refi at stabilization.
Rent comps 8 comps
| Address | Beds | Baths | Sqft | Rent | $/sqft | DOM | Units | Dist |
|---|---|---|---|---|---|---|---|---|
| 6521 Carriage Pines Dr Del Valle, TX | 5.0 | 3.5 | 2466 | $2,500 | $1.01 | 26d | 1 | 0.59mi |
| 6408 Wagon Spring St Del Valle, TX | 4.0 | 3.0 | 2497 | $2,495 | $1.00 | 46d | 1 | 0.60mi |
| 5204 Bahan Dr Del Valle, TX | 4.0 | 2.5 | 2640 | $1,900 | $0.72 | 5d | 1 | 0.86mi |
| 5032 Irvine Ln Del Valle, TX | 4.0 | 2.5 | 2499 | $2,200 | $0.88 | 24d | 1 | 0.92mi |
| 4917 Stockton Ln Del Valle, TX | 4.0 | 2.5 | 2334 | $2,400 | $1.03 | 46d | 1 | 1.02mi |
| 11800 Savanna Canyon Ct Del Valle, TX | 4.0 | 3.0 | 2322 | $2,050 | $0.88 | 6d | 1 | 1.04mi |
| 5600 War Admiral Dr Del Valle, TX | 4.0 | 2.5 | 2101 | $2,200 | $1.05 | 5d | 1 | 1.09mi |
| 13817 Gilwell Dr Del Valle, TX | 4.0 | 3.0 | 1878 | $2,195 | $1.17 | 46d | 1 | 1.34mi |
HOA detail
- Monthly dues
- $29 · $348/yr
Listing history 47 events
-
2026-06-21days on market $289,900 Active 117 DOM
-
2026-06-18days on market $289,900 Active 114 DOM
-
2026-06-17days on market $289,900 Active 113 DOM
-
2026-06-16days on market $289,900 Active 112 DOM
-
2026-06-15days on market $289,900 Active 111 DOM
-
2026-06-13pricedays on market $289,900 Active 109 DOM
-
2026-06-09days on market $299,900 Active 105 DOM
-
2026-06-08days on market $299,900 Active 104 DOM
-
2026-06-07days on market $299,900 Active 103 DOM
-
2026-06-04days on market $299,900 Active 100 DOM
-
2026-06-03days on market $299,900 Active 99 DOM
-
2026-06-02days on market $299,900 Active 98 DOM
-
2026-06-01days on market $299,900 Active 97 DOM
-
2026-05-31days on market $299,900 Active 96 DOM
-
2026-05-11price $299,900 245-char remark
Show marketing remark (245 chars)
Home was originally a 4 bedroom but several additional rooms were created by adding walls and doors. See attached showing original floor plan. Features covered patio and outdoor kitchen. Please note: There is NO survey and NO sellers disclosure
-
2026-04-11price $309,900 245-char remark
Show marketing remark (245 chars)
Home was originally a 4 bedroom but several additional rooms were created by adding walls and doors. See attached showing original floor plan. Features covered patio and outdoor kitchen. Please note: There is NO survey and NO sellers disclosure
-
2026-02-25price $319,900 245-char remark
Show marketing remark (245 chars)
Home was originally a 4 bedroom but several additional rooms were created by adding walls and doors. See attached showing original floor plan. Features covered patio and outdoor kitchen. Please note: There is NO survey and NO sellers disclosure
-
2026-02-24$296,500 Active 245-char remark
Show marketing remark (245 chars)
Home was originally a 4 bedroom but several additional rooms were created by adding walls and doors. See attached showing original floor plan. Features covered patio and outdoor kitchen. Please note: There is NO survey and NO sellers disclosure
-
2025-01-05historical $650
-
2025-01-01$650
-
2025-01-01historical $650
-
2024-12-28price $650
-
2024-12-21price $695
-
2024-10-26price $700
-
2024-09-25$850
-
2024-09-25historical $850
-
2024-09-22$850
-
2024-09-22historical $850
-
2024-09-21$850
-
2024-09-21historical $850
-
2024-05-28soldstatus
-
2024-05-22$850
-
2024-03-28status Active
-
2023-12-05price
-
2023-11-15Active
-
2022-06-02soldstatus
-
2022-05-26soldstatus Closed
-
2022-04-23status Pending
-
2022-04-19historical Active Under Contract
-
2022-04-12$410,000 Active
-
2016-05-25soldstatus
-
2012-03-13soldstatus
-
2012-03-13soldstatus
-
2012-03-13soldstatus
-
2007-06-21soldstatus
-
2007-05-14historical
-
2007-03-07$171,815
ⓘ Source: listings_history table (triggers on properties + properties_extension) + one-shot
backfill from property_details.listing_events for pre-trigger history.
Tax reassessment forecast TX · Resets to sale price
- Current annual tax
- $7,976 · $665/mo
- Projected year-2 tax
- $7,976 · $665/mo
- Expected delta
- $0/yr ($0/mo · 0.0%)
ⓘ Screening estimate from a state-policy table — verify with the county assessor before closing.
Climate risk First Street
- Flood 1/10 Low FEMA zone X (unshaded) · 0% chance over 30 yrs
- Wildfire 5/10 Major
- Heat 8/10 Severe 7 d/yr ≥108°F today · 23 d/yr by 30 yrs out
- Wind 8/10 Severe 80% chance of damaging wind over 30 yrs
- Air quality 1/10 Low 0 unhealthy d/yr today · 0 by 30 yrs out
Nearby sold comps map
Loading sold comps map…
Walkable amenities ~0.75 mi
Loading nearby amenities…
Taxation est. · year 1
- Rental income
- $28,885
- − Mortgage interest
- −$16,239
- − Property taxes
- −$7,976
- − Insurance
- −$1,450
- − Repairs & maintenance
- −$2,311
- − Management
- −$2,311
- − HOA
- −$348
- − Depreciation
- −$8,433
- Taxable loss
- −$10,183
- Est. tax savings @ 24.0%
- +$2,444
- After-tax cash flow
- $-2,754/yr
For passive investors: Depreciation is non-cash, so a rental often shows a tax loss while cash-flowing — sheltering income. Rental losses are passive: they offset passive income freely, and up to $25,000/yr can offset ordinary (W-2) income if you actively participate and your MAGI is under $100k (phasing out to $0 by $150k); unused losses carry forward. On sale, claimed depreciation is recaptured at up to 25%, and gains may owe capital-gains tax (a 1031 exchange can defer both). Figures are a year-1 estimate at your 24.0% rate — not tax advice; consult a CPA.
Schools (NCES district)
- District
- Del Valle ISD
- NCES district ID
- 4816620
- Math proficiency
- 19% ▼ -13.00%
- Reading proficiency
- 26% ▼ -2.00%
- Median HH income
- $41,322
- Composite
- 19.13/100
- National rank
- #8830
- State rank
- #749 of 826 in TX
Livability — Austin
- Score
- 82/100
- State rank
- #16
- US rank
- #1208
Category grades
Schools grade is shown separately in the Schools card above.
Census & demographics
- Census place
- Austin, TX
- County
- Travis County · 1,299,254 people
- City population
- 1,066,854
- Metro
- Austin-Round Rock-Georgetown, TX
- Population (ZIP)
- 30,756
- Household income
- $71,640
- Rent vs Own
- Severe rent burden
- 681.0
Population outlook (Travis County) Hauer SSP2
- Today (2025)
- 1,545,133 people
- By 2030
- 1,729,269 · +11.9%
- By 2040
- 2,097,596 · +35.8%
- By 2050
- 2,463,890 · +59.5%
- By 2075
- 3,249,374 · +110.3%
- By 2100
- 3,801,868 · +146.1%
Race, ethnicity, and origin ACS 2023
- Neighborhood character
- Predominantly Hispanic (75%)
- Race & ethnicity
- Hispanic / Latino 75% Two or more races 33% White 16% Black 6% Asian 1%
- Hispanic origin (detail)
- Mexican 68% Puerto Rican 1%
- Common ancestry
- Romanian 1%
- Foreign-born
- 26% · Canada
- Languages at home
- 41% English-only · Spanish 57% Other Asian/Pacific 1%
Political lean MEDSL · Travis
- 2024 margin
- Solid D (+39.3) · D 68.8% · R 29.4% · Other 1.8%
- 2008→2024 swing
- +9.9pp toward D · 2008: 29.4pp · 2024: 39.3pp
- All cycles
- 2024: D+39.3 2020: D+45.0 2016: D+38.9 2012: D+23.9 2008: D+29.4
Not yet ingested
- Civics
- —
Market trends
- HPI YoY
- ▼ -3.24%
- Current HPI
- 192.3518
- Rent YoY
- ▼ -0.36%
- Metro
- Austin-Round Rock-Georgetown, TX
- State GDP YoY
- ▲ 3.95%
- F500 in state
- 110
Industry mix (Fortune 500 HQ in TX)
| Industry | F500 HQs | Revenue |
|---|---|---|
| Energy | 16 | $1,198B |
|
||
| Technology | 5 | $198B |
|
||
| Engineering / Construction | 4 | $72B |
|
||
| Energy Services | 3 | $60B |
|
||
| Utilities | 3 | $41B |
|
||
| Healthcare | 2 | $330B |
|
||
Price history
+74.5% since first listed33 events — show timeline
- 2026-05-11 Price Changed $299,900 Unlock MLS
- 2026-04-11 Price Changed $309,900 Unlock MLS
- 2026-02-25 Price Changed $319,900 Unlock MLS
- 2026-02-24 Listed $296,500 Unlock MLS
- 2025-01-05 Rental Removed $650 TURBOTENANT
- 2025-01-01 Listed for Rent $650 TURBOTENANT
- 2025-01-01 Rental Removed $650 TURBOTENANT
- 2024-12-28 Price Changed $650 TURBOTENANT
- 2024-12-21 Price Changed $695 TURBOTENANT
- 2024-10-26 Price Changed $700 TURBOTENANT
- 2024-09-25 Listed for Rent $850 TURBOTENANT
- 2024-09-25 Rental Removed $850 RENTALBEAST
- 2024-09-22 Listed for Rent $850 RENTALBEAST
- 2024-09-22 Rental Removed $850 RENTALBEAST
- 2024-09-21 Listed for Rent $850 RENTALBEAST
- 2024-09-21 Rental Removed $850 BUILDIUM
- 2024-05-28 Sold (Public Records) — Public Records
- 2024-05-22 Listed for Rent $850 BUILDIUM
- 2024-03-28 Relisted — Unlock MLS
- 2023-12-05 Price Changed — Unlock MLS
- 2023-11-15 Listed — Unlock MLS
- 2022-06-02 Sold (Public Records) — Public Records
- 2022-05-26 Sold (MLS) — Unlock MLS
- 2022-04-23 Pending — Unlock MLS
- 2022-04-19 Contingent — Unlock MLS
- 2022-04-12 Listed $410,000 Unlock MLS
- 2016-05-25 Sold (Public Records) — Public Records
- 2012-03-13 Sold (Public Records) — Public Records
- 2012-03-13 Sold (Public Records) — Public Records
- 2012-03-13 Sold (Public Records) — Public Records
- 2007-06-21 Sold (MLS) — Unlock MLS
- 2007-05-14 Delisted — Unlock MLS
- 2007-03-07 Listed $171,815 Unlock MLS
Property tax history
+3.3%/yrLatest (2026): $7,976 · +10.0% YoY. Source: county tax records.
Cash-flow waterfall
monthlySold comps — $/sqft
last 12 mo · ≤1 miLoading sold comps…