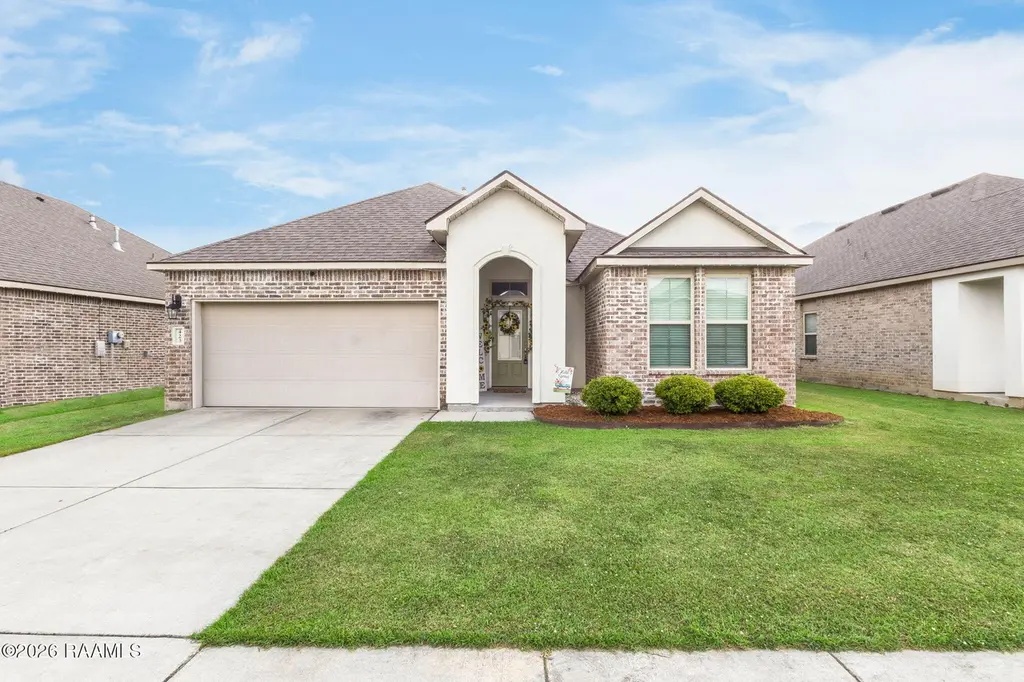
423 Starlight Dr · Lafayette, LA
Flood risk 1/10 · Minimal
- FEMA flood zone
- X (unshaded)
- Chance of flooding over 30 yrs
- 0.0%
- Est. flood insurance / yr
- $507 – $1,088
Fire risk 1/10 · Minimal
- Est. fire insurance / yr
- $1,269 – $2,357
Heat risk 8/10 · Major
- Hot days now (above 109°F)
- 6 days/yr
- Hot days in 30 yrs
- 18 days/yr
Wind risk 9/10 · Severe
- Chance of severe wind over 30 yrs
- 99.0%
Air-quality risk 2/10 · Minimal
- Unhealthy air days now
- 1 days/yr
- Unhealthy air days in 30 yrs
- 1 days/yr
Risk factors via First Street. Map © Google.
Why this score? — see what drove the B- grade
The composite is a weighted blend of 9 inputs, each scored 0–100. Each bar is that input's sub-score; the figure is the points it added to the 100-point composite (weight × sub-score).
- Cash flow +24.8/30.0
- ARV discount +12.9/15.0
- DSCR +8.0/10.0
- 1% rule +5.9/10.0
- Rent growth +4.3/5.0
- Condition / age +4.0/5.0
- Schools +3.6/10.0
- Livability +3.5/5.0
- Appreciation +0.0/10.0
$230,000
🖨 Deal sheet 📄 Offer letter ✓ Due diligence
Listing remarks MLS
This modern home on Starlight Drive offers contemporary living in a established area. Featuring fresh design and convenient location. Minutes from Northside High and Downtown Lafayette, this home offers both comfort and easy access to local amenities.
Key facts
- 6,098 sq ft lot
- 2 garage spots
- Listed 19 days
Neighborhood map
What this means for you Summary
Snapshot
- This is a 4-bed/2.0-bath single-family listed at $230k. Condition is rated good.
Deal economics
- At list price, monthly cash flow is $484 ($6k/yr) — positive.
- The deal already cash-flows at list — no discount required.
- Meets the 1% rule at list price ($3k rent vs $230k).
- Recommended offer: $227k (1.5% below list) — sets the bar for market timing.
- Cap rate 8.8% vs local median 4.7% in Lafayette — top-decile yield for the area; either an underpriced asset or a hidden risk that comps aren't pricing in. Stress-test before assuming the spread holds.
Location & tenants
- Location reads 70/100 on livability (#63 in LA) — a middle-class / working-renter tenant base. Strengths: cost of living A+, housing A+, health & safety A+; Watch: amenities C-, employment C-, crime F.
- Lafayette Parish (urban): math 38% / reading 46% proficiency, ranked #19 of 98 in LA (top 19%) — families likely to look elsewhere, expect single-tenant / working-renter base with shorter leases.
- Market conditions: Rents rising fast (+7.3%/yr); 246 active listings in the ZIP; 2 comparable units currently listed for rent nearby; lower-income renter base — watch delinquency; 1,585 units permitted in Lafayette Parish in 2024 (10 in 5+ unit buildings).
- At $2,517/mo this rent would consume 91% of the median local household income ($33k/yr) (locally 2089% of renters already pay >50% of income on rent) — very limited rent-growth headroom before tenants either downsize or default.
Forward outlook
- Local home prices are declining (-3.0%/yr); year-one equity from $2k of loan paydown is wiped out by about $7k of value loss. Plan a longer hold.
- Lafayette County population projected at +34% by 2050 — long-run rental-demand tailwind backs the buy-and-hold thesis.
- At projected returns (-3.0% appreciation + 7.3% rent growth), your $64k cash investment doubles in ~8 years — after that, you're playing with house money.
Negotiation context
- It's been on market 19 days — a 2% lower offer ($227k) is reasonable based on typical stale-listing flexibility.
Risks & watch-outs
- Climate carrying-cost: severe wind risk, 99% chance of damaging wind over 30y; extreme-heat days projected 6→18/yr by 2055 (HVAC capex compounding) — expect insurance premiums to compound above CPI over the hold.
Questions for the listing agent
- What does the HOA fee cover, when was the last increase, and are there any pending special assessments or reserve-fund shortfalls?
- Is there a deadline driving the sale (1031 exchange, divorce, estate, relocation)? That informs how much negotiation room exists.
- Schools are B-rated — typically a magnet for longer-tenancy family renters. What's the average tenant stay here, and is there a school-zone premium baked into asking?
- Crime grade is F in this area — have there been break-ins, vandalism, or insurance claims at this property in the last 3 years? What carrier currently insures it and at what premium?
- What's the average days-on-market for RENTAL listings here right now (not sales)? A rising rental-DOM trend means longer vacancies and softer asking-rent achievability than the comps imply.
- What's the recent tenant-quality profile in this submarket — average credit score on applications, eviction rate, late-payment / NSF rate, and stable-employment percentage? A property-management company in the area should have these aggregated.
- How much new for-sale + rental construction is in the pipeline within 1–3 miles? Heavy new supply typically softens prices + rents 12–24 months out; constrained supply supports both.
Investment metrics
- 1% rule
- 1.09% ✓
- Cap rate
- 8.82%
- Cash-on-cash
- 9.02%
- DSCR
- 1.40
- GRM
- 7.6
CMA / ARV
- ARV (median comp)
- $261,271
- List price
- $230,000
- Delta
- -11.97%
- Verdict
- UNDERPRICED
- Comps
- 20 within 1.0 mi
Show comp detail 12 sales within ~0.75 mi
| Address | Dist | Beds/Ba | Sqft | Sold | Price | $/sf | Match |
|---|---|---|---|---|---|---|---|
| 423 Starlight Dr | 0.00mi | 4/2.0 | 1,700 (-3%) | 0mo | $230,000 | $135 | 94 |
| 335 White Pine Dr | 0.20mi | 4/2.0 | 1,704 (-3%) | 1mo | $237,000 | $139 | 85 |
| 204 White Pine Dr | 0.18mi | 4/2.0 | 1,786 (+2%) | 6mo | $236,000 | $132 | 84 |
| 323 White Pine Dr | 0.20mi | 4/2.0 | 1,874 (+6%) | 1mo | $249,000 | $133 | 79 |
| 328 White Pine Dr | 0.20mi | 4/2.0 | 1,874 (+6%) | 1mo | $254,500 | $136 | 79 |
| 325 White Pine Dr | 0.20mi | 4/2.0 | 1,836 (+4%) | 7mo | $250,000 | $136 | 78 |
| 120 Red Pine Dr | 0.27mi | 4/2.0 | 1,874 (+6%) | 6mo | $239,900 | $128 | 71 |
| 319 White Pine Dr | 0.20mi | 3/2.0 (-1) | 1,613 (-8%) | 2mo | $235,500 | $146 | 70 |
| 333 White Pine Dr | 0.20mi | 3/2.0 (-1) | 1,613 (-8%) | 2mo | $235,000 | $146 | 70 |
| 336 White Pine Dr | 0.20mi | 3/2.0 (-1) | 1,616 (-8%) | 3mo | $242,000 | $150 | 69 |
| 102 Kingswood Dr | 0.50mi | 3/2.0 (-1) | 1,775 (+1%) | 4mo | $215,000 | $121 | 67 |
| 106 Kingswood Dr | 0.48mi | 3/2.0 (-1) | 1,576 (-10%) | 2mo | $169,000 | $107 | 53 |
Match score weights: distance 35% · size 25% · config 20% · recency 20%. Top-matched comps best support the ARV.
Projected returns pro-forma
-3.0% appreciation · 7.35% rent growth · sell at horizon
- IRR
- 2.0%
- Equity multiple
- 1.08×
- Total profit
- $5,062
- Equity at exit
- $34,294
- IRR
- 15.3%
- Equity multiple
- 2.49×
- Total profit
- $95,690
- Equity at exit
- $19,886
Cash invested: $64,400 (down + closing). Projections, not guarantees.
Landlord ↔ Tenant lean methodology
- Overall (STATE)
- 90 Strongly Landlord-Friendly
- State Louisiana
- 90 Strongly Landlord-Friendly · R+12
- County
- — inherits STATE
- City
- — inherits STATE
ZIP-level market 70501
- Rents YoY
- 7.3%
- Active inventory
- 246
- Price-to-rent
- 7.6×
Monthly cashflow live
- Estimated rent
- $2,517 medium interval (Pro) →
- Mortgage (P&I)
- −$1,206
- Tax from tax record
- −$177 /mo · $2,124/yr
- Insurance
- −$96
- HOA
- −$25
- Vacancy / Maint / Mgmt
- −$529
- Net cashflow
- $484
Break-even live
UW: 25.0% down · 7.5% · 30yr · 1.5% tax · 5.0% vac · 8.0% maint · 8.0% mgmt
Financing live
Cash to close
- Down payment
- $57,500
- Closing costs
- $6,900
- Reserves months
- —
- Total cash needed
- —
Loan-product check · same deal, 3 products live
Conventional
25% down · 7.5% · 30yr
- Down + closing
- —
- Monthly P&I
- —
- Monthly cashflow
- —
- DSCR
- —
- Eligible?
- —
Personal DTI + credit; lowest rate.
DSCR
20% down · 8.5% · 30yr
- Down + closing
- —
- Monthly P&I
- —
- Monthly cashflow
- —
- DSCR
- —
- Eligible?
- —
No personal income docs; deal must DSCR.
Hard money
10% down · 12.0% · 12mo
- Down + closing
- —
- Monthly P&I
- —
- Monthly cashflow
- —
- DSCR
- —
- Eligible?
- —
Short-term bridge; refi at stabilization.
Rent comps 2 comps
| Address | Beds | Baths | Sqft | Rent | $/sqft | DOM | Units | Dist |
|---|---|---|---|---|---|---|---|---|
| 406 Starlight Dr Lafayette, LA | 4.0 | 2.0 | 1867 | $3,500 | $1.87 | 13d | 1 | 0.10mi |
| 109 Red Pine Dr Lafayette, LA | 4.0 | 3.0 | 2087 | $3,500 | $1.68 | 13d | 1 | 0.19mi |
HOA detail
- Monthly dues
- $25 · $300/yr
Listing history 2 events
-
2026-05-03status Pending 251-char remark
Show marketing remark (251 chars)
This modern home on Starlight Drive offers contemporary living in a established area. Featuring fresh design and convenient location. Minutes from Northside High and Downtown Lafayette, this home offers both comfort and easy access to local amenities.
-
2026-04-13$230,000 Active 251-char remark
Show marketing remark (251 chars)
This modern home on Starlight Drive offers contemporary living in a established area. Featuring fresh design and convenient location. Minutes from Northside High and Downtown Lafayette, this home offers both comfort and easy access to local amenities.
ⓘ Source: listings_history table (triggers on properties + properties_extension) + one-shot
backfill from property_details.listing_events for pre-trigger history.
Tax reassessment forecast LA · Resets to sale price
- Current annual tax
- $2,124 · $177/mo
- Projected year-2 tax
- $2,124 · $177/mo
- Expected delta
- $0/yr ($0/mo · 0.0%)
ⓘ Screening estimate from a state-policy table — verify with the county assessor before closing.
Climate risk First Street
- Flood 1/10 Low FEMA zone X (unshaded) · 0% chance over 30 yrs
- Wildfire 1/10 Low
- Heat 8/10 Severe 6 d/yr ≥109°F today · 18 d/yr by 30 yrs out
- Wind 9/10 Extreme 99% chance of damaging wind over 30 yrs
- Air quality 2/10 Low 1 unhealthy d/yr today · 1 by 30 yrs out
Nearby sold comps map
Loading sold comps map…
Walkable amenities ~0.75 mi
Loading nearby amenities…
Taxation est. · year 1
- Rental income
- $30,203
- − Mortgage interest
- −$12,884
- − Property taxes
- −$2,124
- − Insurance
- −$1,150
- − Repairs & maintenance
- −$2,416
- − Management
- −$2,416
- − HOA
- −$300
- − Depreciation
- −$6,691
- Taxable income
- $2,221
- Est. tax owed @ 24.0%
- −$533
- After-tax cash flow
- $5,279/yr
For passive investors: Depreciation is non-cash, so a rental often shows a tax loss while cash-flowing — sheltering income. Rental losses are passive: they offset passive income freely, and up to $25,000/yr can offset ordinary (W-2) income if you actively participate and your MAGI is under $100k (phasing out to $0 by $150k); unused losses carry forward. On sale, claimed depreciation is recaptured at up to 25%, and gains may owe capital-gains tax (a 1031 exchange can defer both). Figures are a year-1 estimate at your 24.0% rate — not tax advice; consult a CPA.
Condition & rehab AI · 6 photos
This modern home on Starlight Drive is in good condition with fresh paint and well-maintained landscaping. It offers a good investment opportunity with potential for both resale and rental value through minor updates.
Value-add opportunities
- Both Paint the exterior walls — Fresh paint enhances curb appeal and can increase both resale and rental value.
- Both Replace the front door — A new front door can improve the home's curb appeal and increase its value.
- Both Upgrade the kitchen appliances — Modern appliances can make the kitchen more appealing and increase its value for both resale and rental.
- Both Install new flooring in the living room — New flooring can make the living room more inviting and increase its value for both resale and rental.
- Both Add a smart home system — A smart home system can increase the home's appeal and value for both resale and rental by offering convenience and energy efficiency.
Renovation cost estimate screening
Value-add ROI direction
- Both Paint the exterior walls — Fresh paint enhances curb appeal and can increase both resale and rental value. ↑
- Both Replace the front door — A new front door can improve the home's curb appeal and increase its value. ↑
- Both Upgrade the kitchen appliances — Modern appliances can make the kitchen more appealing and increase its value for both resale and rental. ↑
- Both Install new flooring in the living room — New flooring can make the living room more inviting and increase its value for both resale and rental. ↑
- Both Add a smart home system — A smart home system can increase the home's appeal and value for both resale and rental by offering convenience and energy efficiency. ↑
ⓘ Cost ranges are severity-bucket heuristics (US national rule-of-thumb). Get contractor quotes + a written scope before underwriting a rehab budget.
Schools (NCES district)
- District
- Lafayette Parish
- NCES district ID
- 2200870
- Math proficiency
- 38% ▼ -32.00%
- Reading proficiency
- 46% ▼ -24.00%
- Median HH income
- $50,238
- Composite
- 36.15/100
- National rank
- #4741
- State rank
- #19 of 98 in LA
Livability — Lafayette
- Score
- 70/100
- State rank
- #63
- US rank
- #8133
Category grades
Schools grade is shown separately in the Schools card above.
Census & demographics
- Census place
- Lafayette, LA
- County
- Lafayette Parish · 207,544 people
- City population
- 158,114
- Metro
- Lafayette, LA
- Population (ZIP)
- 26,465
- Household income
- $33,365
- Rent vs Own
- Severe rent burden
- 2089.0
Population outlook (Lafayette County) Hauer SSP2
- Today (2025)
- 280,930 people
- By 2030
- 301,092 · +7.2%
- By 2040
- 339,456 · +20.8%
- By 2050
- 375,156 · +33.5%
- By 2075
- 451,672 · +60.8%
- By 2100
- 497,203 · +77.0%
Race, ethnicity, and origin ACS 2023
- Neighborhood character
- Predominantly Black (73%)
- Race & ethnicity
- Black 73% White 18% Two or more races 6% Hispanic / Latino 4%
- Common ancestry
- Lithuanian 4%
- Foreign-born
- 2% · Canada
- Languages at home
- 95% English-only · Spanish 3% French/Haitian/Cajun 2%
Political lean MEDSL · Lafayette
- 2024 margin
- Solid R (+31.4) · D 33.5% · R 64.8% · Other 1.7%
- 2008→2024 swing
- -0.1pp no change · 2008: -31.3pp · 2024: -31.4pp
- All cycles
- 2024: R+31.4 2020: R+28.7 2016: R+33.6 2012: R+33.7 2008: R+31.3
Not yet ingested
- Civics
- —
Market trends
- HPI YoY
- ▼ -108.63%
- Current HPI
- 81.2963
- Rent YoY
- ▲ 7.35%
- Metro
- Lafayette, LA
- State GDP YoY
- ▲ 3.29%
- F500 in state
- 10
Industry mix (Fortune 500 HQ in LA)
| Industry | F500 HQs | Revenue |
|---|---|---|
| Telecommunications | 2 | $23B |
|
||
| Utilities | 1 | $12B |
|
||
| Wholesale / Distribution | 1 | $5B |
|
||
| Advertising | 1 | $2B |
|
||
Price history
2 events — show timeline
- 2026-05-03 Pending — AcadianaMLS
- 2026-04-13 Listed $230,000 AcadianaMLS
Property tax history
+111.0%/yrLatest (2025): $2,124 · -1.1% YoY. Source: county tax records.
Cash-flow waterfall
monthlySold comps — $/sqft
last 12 mo · ≤1 miLoading sold comps…