 Triplex
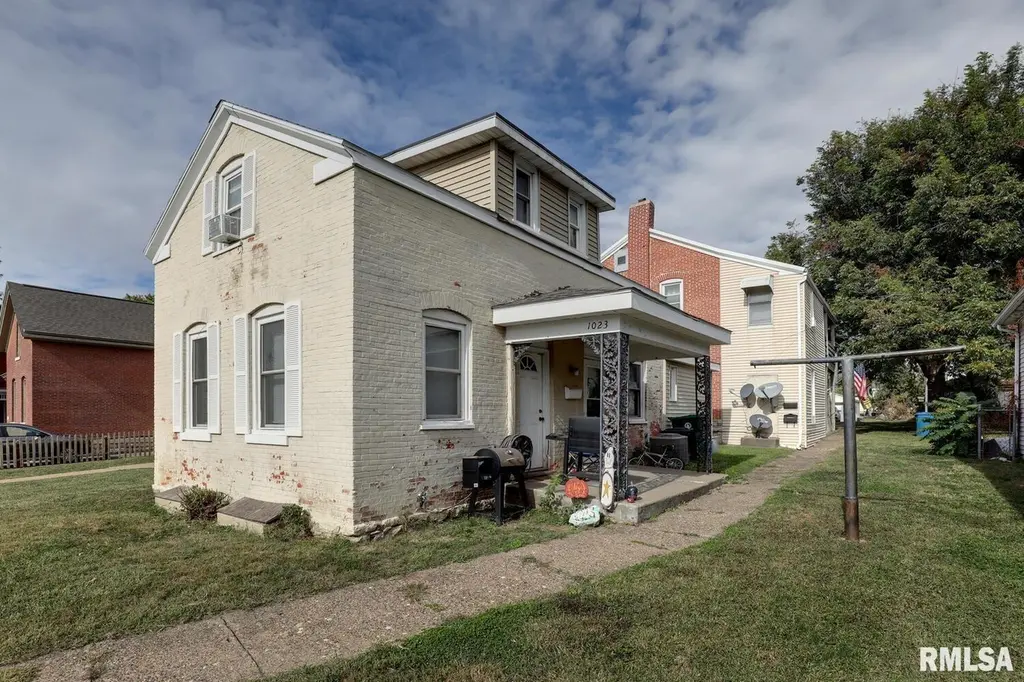
1023-1025 Ohio St · Quincy, IL
Flood risk 1/10 · Minimal
- FEMA flood zone
- X (unshaded)
- Chance of flooding over 30 yrs
- 0.0%
- Est. flood insurance / yr
- $473 – $860
Fire risk 2/10 · Minimal
- Est. fire insurance / yr
- $804 – $1,492
Heat risk 4/10 · Minor
- Hot days now (above 106°F)
- 7 days/yr
- Hot days in 30 yrs
- 17 days/yr
Wind risk 2/10 · Minimal
- Chance of severe wind over 30 yrs
- —
Air-quality risk 2/10 · Minimal
- Unhealthy air days now
- 1 days/yr
- Unhealthy air days in 30 yrs
- 1 days/yr
Risk factors via First Street. Map © Google.
Why this score? — see what drove the B- grade
The composite is a weighted blend of 9 inputs, each scored 0–100. Each bar is that input's sub-score; the figure is the points it added to the 100-point composite (weight × sub-score).
- Cash flow +30.0/30.0
- 1% rule +10.0/10.0
- DSCR +10.0/10.0
- ARV discount +6.0/15.0
- Rent growth +5.0/5.0
- Livability +3.4/5.0
- Schools +2.2/10.0
- Condition / age +2.2/5.0
- Appreciation +0.0/10.0
$125,000
🖨 Deal sheet 📄 Offer letter ✓ Due diligence
Multi-family units
County records classify this as Multi-Family (2-4 Unit). Listing-text estimate: 3 units. confirmed
Listing remarks MLS
Money making 3-unit property. $1,700 in total monthly rent. Unit 1 is a 2 bed 1 bath home that brings in $800/mo. Units 2 and 3 are 1 bed 1 bath apartments both with $450 in rent. Off street parking by the alley. Tenant pays water for unit 1 but landlord pays the water for units 2 and 3. This would be a great first investment or a no brainer addition to your current portfolio.
Key facts
- 7,405 sq ft lot
- 3 parking spots
- Listed 232 days
Neighborhood map
What this means for you Summary
Snapshot
- This is a 1×2bd/1ba + 2×1bd/1ba units multifamily listed at $125k. Condition is rated fair.
Deal economics
- At list price, monthly cash flow is $2k ($19k/yr) — positive. Per door: $524/mo.
- The deal already cash-flows at list — no discount required.
- Meets the 1% rule at list price ($3k rent vs $125k).
- Recommended offer: $110k (12.0% below list) — sets the bar for market timing.
- Cap rate 21.4% vs local median 4.3% in Quincy — top-decile yield for the area; either an underpriced asset or a hidden risk that comps aren't pricing in. Stress-test before assuming the spread holds.
Location & tenants
- Location reads 67/100 on livability (#506 in IL) — a middle-class / working-renter tenant base. Strengths: cost of living A+, housing A+; Watch: schools D+, crime D, employment D.
- Quincy SD 172 (town): math 24% / reading 27% proficiency, ranked #328 of 620 in IL (top 53%) — low school quality limits family demand, transient renter base, plan for 1-2y turnover.
- Market conditions: Rents rising fast (+10.8%/yr); 180 active listings in the ZIP; 68 units permitted in Adams County in 2024 (0 in 5+ unit buildings).
- At $3,085/mo this rent would consume 71% of the median local household income ($52k/yr) (locally 1238% of renters already pay >50% of income on rent) — very limited rent-growth headroom before tenants either downsize or default.
Forward outlook
- Local home prices are declining (-3.0%/yr); year-one equity from $864 of loan paydown is wiped out by about $4k of value loss. Plan a longer hold.
- Adams County population projected at -14% by 2050 — secular population decline; favor cash flow + early exit over multi-decade hold.
- At projected returns (-3.0% appreciation + 8.0% rent growth), your $35k cash investment doubles in ~3 years — after that, you're playing with house money.
Negotiation context
- It's been on market 233 days — a 12% lower offer ($110k) is reasonable based on typical stale-listing flexibility.
- 4 sale attempts since 12y ago with the ask held roughly flat each time — persistent listings suggest the price (not the market) is what's stuck; bring a comps-based counter.
- Current owner paid $80k; list at $125k implies a 56% gain — meaningful room to come down on a strong offer.
Questions for the listing agent
- It's been on market 233 days. Have you received any prior offers? Is the seller open to a 12% concession, seller financing, or rate buy-down credit?
- Can we see the unit-by-unit rent roll, current vacancy, and any below-market leases? What's the average tenancy length?
- What capital expenditures (roof, boiler, parking lot, exteriors) have been made in the last 5 years, and what's planned in the next 2?
- Have any recent inspections been done? Can we get a copy of the seller's disclosures and any deferred-maintenance estimates?
- Why hasn't it sold? Are there any deal-killer items the seller is aware of (foundation, flood, title, zoning, code violations)?
- Is there a deadline driving the sale (1031 exchange, divorce, estate, relocation)? That informs how much negotiation room exists.
- Schools are D-rated, which usually means shorter tenancies and higher turnover. Who's the typical renter profile here, and what's been the actual vacancy rate?
- Crime grade is D in this area — have there been break-ins, vandalism, or insurance claims at this property in the last 3 years? What carrier currently insures it and at what premium?
- What's the average days-on-market for RENTAL listings here right now (not sales)? A rising rental-DOM trend means longer vacancies and softer asking-rent achievability than the comps imply.
- What's the recent tenant-quality profile in this submarket — average credit score on applications, eviction rate, late-payment / NSF rate, and stable-employment percentage? A property-management company in the area should have these aggregated.
- How much new apartment / multifamily construction is in the pipeline within 1–3 miles? Heavy new supply (>2% of stock underway) typically softens rents 12–24 months out; light construction supports rent growth.
Investment metrics
- 1% rule
- 2.47% ✓
- Cap rate
- 21.40%
- Cash-on-cash
- 53.94%
- DSCR
- 3.40
- GRM
- 3.4
CMA / ARV
- ARV (median comp)
- $120,929
- List price
- $125,000
- Delta
- 3.37%
- Verdict
- FAIR
- Comps
- 20 within 1.0 mi
Projected returns pro-forma
-3.0% appreciation · 8.0% rent growth · sell at horizon
- IRR
- 57.7%
- Equity multiple
- 3.75×
- Total profit
- $96,299
- Equity at exit
- $18,638
- IRR
- 64.4%
- Equity multiple
- 9.21×
- Total profit
- $287,278
- Equity at exit
- $10,808
Cash invested: $35,000 (down + closing). Projections, not guarantees.
Landlord ↔ Tenant lean methodology
- Overall (STATE)
- 43 Moderately Tenant-Leaning
- State Illinois
- 43 Moderately Tenant-Leaning · D+7
- County
- — inherits STATE
- City
- — inherits STATE
ZIP-level market 62301
- Rents YoY
- 10.8%
- Active inventory
- 180
- Price-to-rent
- 6.9×
Monthly cashflow live
- Estimated rent
- $3,085 medium interval (Pro) →
- Mortgage (P&I)
- −$656
- Tax est. 1.5%
- −$156 /mo · $1,875/yr
- Insurance
- −$52
- HOA
- −$0
- Vacancy / Maint / Mgmt
- −$648
- Net cashflow
- $1,573
Break-even live
3-unit breakdown (identical units grouped — click to expand)
| Units | Beds | Baths | Est. rent |
|---|---|---|---|
| 1× unit | 2 | 1 | $1,516 |
| 2× units | 1 | 1 | $1,570 |
| #2 | 1 | 1 | $785 |
| #3 | 1 | 1 | $785 |
| Total (3 units) | $3,085 | ||
UW: 25.0% down · 7.5% · 30yr · 1.5% tax · 5.0% vac · 8.0% maint · 8.0% mgmt
Financing live
Cash to close
- Down payment
- $31,250
- Closing costs
- $3,750
- Reserves months
- —
- Total cash needed
- —
Loan-product check · same deal, 3 products live
Conventional
25% down · 7.5% · 30yr
- Down + closing
- —
- Monthly P&I
- —
- Monthly cashflow
- —
- DSCR
- —
- Eligible?
- —
Personal DTI + credit; lowest rate.
DSCR
20% down · 8.5% · 30yr
- Down + closing
- —
- Monthly P&I
- —
- Monthly cashflow
- —
- DSCR
- —
- Eligible?
- —
No personal income docs; deal must DSCR.
Hard money
10% down · 12.0% · 12mo
- Down + closing
- —
- Monthly P&I
- —
- Monthly cashflow
- —
- DSCR
- —
- Eligible?
- —
Short-term bridge; refi at stabilization.
Listing history 22 events
-
2026-06-19days on market $125,000 Active 233 DOM
-
2026-06-18days on market $125,000 Active 232 DOM
-
2026-06-17days on market $125,000 Active 231 DOM
-
2026-06-16days on market $125,000 Active 230 DOM
-
2026-06-15days on market $125,000 Active 229 DOM
-
2026-06-14days on market $125,000 Active 227 DOM
-
2026-06-12days on market $125,000 Active 226 DOM
-
2026-06-09days on market $125,000 Active 223 DOM
-
2026-06-08days on market $125,000 Active 222 DOM
-
2026-06-07days on market $125,000 Active 221 DOM
-
2026-06-03days on market $125,000 Active 217 DOM
-
2026-06-02days on market $125,000 Active 216 DOM
-
2026-06-01days on market $125,000 Active 215 DOM
-
2026-05-31days on market $125,000 Active 214 DOM
-
2026-05-30days on market $125,000 Active 213 DOM
-
2025-10-29$125,000 Active 379-char remark
Show marketing remark (379 chars)
Money making 3-unit property. $1,700 in total monthly rent. Unit 1 is a 2 bed 1 bath home that brings in $800/mo. Units 2 and 3 are 1 bed 1 bath apartments both with $450 in rent. Off street parking by the alley. Tenant pays water for unit 1 but landlord pays the water for units 2 and 3. This would be a great first investment or a no brainer addition to your current portfolio.
-
2019-11-01soldstatus $80,000 339-char remark
Show marketing remark (339 chars)
Property has two separate buildings, 1023 is story and half and could be used as 3 bedroom. Back two story has one bedroom each. Front unit has new roof this year and remodeled on main floor with fresh paint and new flooring in living room. Back units are occupied with long term tenants. Back units have parking in back with alley access.
-
2019-11-01soldstatus $80,000
Show marketing remark (339 chars)
Property has two separate buildings, 1023 is story and half and could be used as 3 bedroom. Back two story has one bedroom each. Front unit has new roof this year and remodeled on main floor with fresh paint and new flooring in living room. Back units are occupied with long term tenants. Back units have parking in back with alley access.
-
2019-08-26$89,000 339-char remark
Show marketing remark (339 chars)
Property has two separate buildings, 1023 is story and half and could be used as 3 bedroom. Back two story has one bedroom each. Front unit has new roof this year and remodeled on main floor with fresh paint and new flooring in living room. Back units are occupied with long term tenants. Back units have parking in back with alley access.
-
2019-08-26$89,000
Show marketing remark (339 chars)
Property has two separate buildings, 1023 is story and half and could be used as 3 bedroom. Back two story has one bedroom each. Front unit has new roof this year and remodeled on main floor with fresh paint and new flooring in living room. Back units are occupied with long term tenants. Back units have parking in back with alley access.
-
2014-04-07soldstatus $78,000
-
2014-03-26$78,000
ⓘ Source: listings_history table (triggers on properties + properties_extension) + one-shot
backfill from property_details.listing_events for pre-trigger history.
Climate risk First Street
- Flood 1/10 Low FEMA zone X (unshaded) · 0% chance over 30 yrs
- Wildfire 2/10 Low
- Heat 4/10 Moderate 7 d/yr ≥106°F today · 17 d/yr by 30 yrs out
- Wind 2/10 Low
- Air quality 2/10 Low 1 unhealthy d/yr today · 1 by 30 yrs out
Nearby sold comps map
Loading sold comps map…
Walkable amenities ~0.75 mi
Loading nearby amenities…
Taxation est. · year 1
- Rental income
- $37,020
- − Mortgage interest
- −$7,002
- − Property taxes
- −$1,875
- − Insurance
- −$625
- − Repairs & maintenance
- −$2,962
- − Management
- −$2,962
- − Depreciation
- −$3,636
- Taxable income
- $17,958
- Est. tax owed @ 24.0%
- −$4,310
- After-tax cash flow
- $14,570/yr
For passive investors: Depreciation is non-cash, so a rental often shows a tax loss while cash-flowing — sheltering income. Rental losses are passive: they offset passive income freely, and up to $25,000/yr can offset ordinary (W-2) income if you actively participate and your MAGI is under $100k (phasing out to $0 by $150k); unused losses carry forward. On sale, claimed depreciation is recaptured at up to 25%, and gains may owe capital-gains tax (a 1031 exchange can defer both). Figures are a year-1 estimate at your 24.0% rate — not tax advice; consult a CPA.
Condition & rehab AI · 5 photos
This multi-family property requires significant repairs and maintenance to improve its condition and value. Exterior siding and roof repair, flooring replacement, and HVAC/mechanical upgrade are recommended to enhance both resale and rental appeal.
Repairs flagged
- Major exterior siding — Significant peeling and wear
- Major roof — Signs of wear and potential leaks
- Major flooring — Worn and uneven, needs replacement
- Major HVAC/mechanicals — No visible signs of recent maintenance
Value-add opportunities
- Both exterior siding and roof repair — Improves both resale and rental value
- Both flooring replacement — Enhances both resale and rental appeal
- Both HVAC/mechanical upgrade — Improves comfort and energy efficiency
Renovation cost estimate screening
| Repair item | Severity | Est. cost |
|---|---|---|
| exterior siding · Significant peeling and wear | Major | $15,000–50,000 |
| roof · Signs of wear and potential leaks | Major | $15,000–50,000 |
| flooring · Worn and uneven, needs replacement | Major | $15,000–50,000 |
| HVAC/mechanicals · No visible signs of recent maintenance | Major | $15,000–50,000 |
| Total estimated repair cost · 4 items | $60,000–200,000 |
Value-add ROI direction
- Both exterior siding and roof repair — Improves both resale and rental value ↑
- Both flooring replacement — Enhances both resale and rental appeal ↑
- Both HVAC/mechanical upgrade — Improves comfort and energy efficiency ↑
ⓘ Cost ranges are severity-bucket heuristics (US national rule-of-thumb). Get contractor quotes + a written scope before underwriting a rehab budget.
Schools (NCES district)
- District
- Quincy SD 172
- NCES district ID
- 1733000
- Math proficiency
- 24% ▬ 0.00%
- Reading proficiency
- 27% ▬ 0.00%
- Median HH income
- $44,132
- Composite
- 21.91/100
- National rank
- #8229
- State rank
- #328 of 620 in IL
Livability — Quincy
- Score
- 67/100
- State rank
- #506
- US rank
- #10458
Category grades
Schools grade is shown separately in the Schools card above.
Census & demographics
- Census place
- Quincy, IL
- County
- Adams County · 30,746 people
- City population
- 30,746
- Metro
- Quincy, IL-MO
- Population (ZIP)
- 30,746
- Household income
- $52,055
- Rent vs Own
- Severe rent burden
- 1238.0
Population outlook (Adams County) Hauer SSP2
- Today (2025)
- 65,795 people
- By 2030
- 64,436 · -2.1%
- By 2040
- 61,007 · -7.3%
- By 2050
- 56,851 · -13.6%
- By 2075
- 46,424 · -29.4%
- By 2100
- 34,305 · -47.9%
Race, ethnicity, and origin ACS 2023
- Neighborhood character
- Predominantly White (84%)
- Race & ethnicity
- White 84% Two or more races 7% Black 6% Hispanic / Latino 3% Asian 1%
- Common ancestry
- Slovak 2% Iranian 1% Lithuanian 1%
- Foreign-born
- 2% · Canada
- Languages at home
- 96% English-only · Spanish 2%
Political lean MEDSL · Adams
- 2024 margin
- Solid R (+47.4) · D 25.6% · R 73.0% · Other 1.5%
- 2008→2024 swing
- -25.0pp toward R · 2008: -22.4pp · 2024: -47.4pp
- All cycles
- 2024: R+47.4 2020: R+46.5 2016: R+47.5 2012: R+35.2 2008: R+22.4
Not yet ingested
- Civics
- —
Market trends
- HPI YoY
- ▼ -121.44%
- Current HPI
- 131.7344
- Rent YoY
- ▲ 10.78%
- Metro
- Quincy, IL-MO
- State GDP YoY
- ▲ 1.59%
- F500 in state
- 60
Industry mix (Fortune 500 HQ in IL)
| Industry | F500 HQs | Revenue |
|---|---|---|
| Insurance | 4 | $201B |
|
||
| Consumer Goods | 4 | $87B |
|
||
| Industrial Machinery | 3 | $64B |
|
||
| Healthcare | 2 | $55B |
|
||
| Retail / Pharmacy | 1 | $148B |
|
||
| Agriculture / Food | 1 | $86B |
|
||
Price history
+60.3% since first listed7 events — show timeline
- 2025-10-29 Listed $125,000 RMLSA as Distributed by MLS Grid
- 2019-11-01 Sold (MLS) $80,000 MRED as Distributed by MLS Grid
- 2019-11-01 Sold (MLS) $80,000 Quincy AOR
- 2019-08-26 Listed $89,000 MRED as Distributed by MLS Grid
- 2019-08-26 Listed $89,000 Quincy AOR
- 2014-04-07 Sold (MLS) $78,000 MRED as Distributed by MLS Grid
- 2014-03-26 Listed $78,000 MRED as Distributed by MLS Grid
Cash-flow waterfall
monthlySold comps — $/sqft
last 12 mo · ≤1 miLoading sold comps…