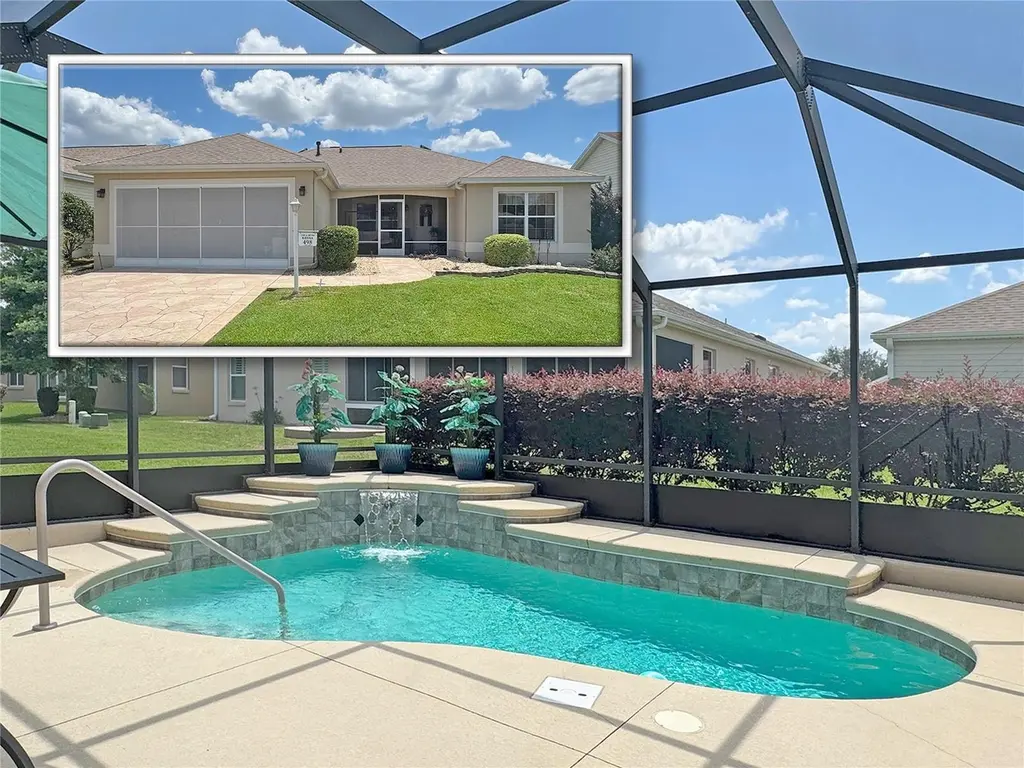
498 Weston Manor Dr · The Villages, FL
Flood risk 1/10 · Minimal
- FEMA flood zone
- X (unshaded)
- Chance of flooding over 30 yrs
- 0.0%
- Est. flood insurance / yr
- $507 – $1,088
Fire risk 4/10 · Minor
- Est. fire insurance / yr
- $947 – $1,759
Heat risk 8/10 · Major
- Hot days now (above 109°F)
- 6 days/yr
- Hot days in 30 yrs
- 18 days/yr
Wind risk 9/10 · Severe
- Chance of severe wind over 30 yrs
- 99.0%
Air-quality risk 3/10 · Minor
- Unhealthy air days now
- 2 days/yr
- Unhealthy air days in 30 yrs
- 3 days/yr
Risk factors via First Street. Map © Google.
Why this score? — see what drove the F grade
The composite is a weighted blend of 9 inputs, each scored 0–100. Each bar is that input's sub-score; the figure is the points it added to the 100-point composite (weight × sub-score).
- Cash flow +11.1/30.0
- Schools +5.2/10.0
- Rent growth +3.5/5.0
- Livability +3.5/5.0
- DSCR +3.2/10.0
- 1% rule +2.8/10.0
- Condition / age +2.5/5.0
- ARV discount +0.0/15.0
- Appreciation +0.0/10.0
$425,000
🖨 Deal sheet 📄 Offer letter ✓ Due diligence
Listing remarks
THE VILLAGES, FL - FANTASTIC LOCATION - TURN-KEY/FURNISHED - POOL HOME - BOND PAID - DESIGNER BLOCK/STUCCO. Open concept floor plan features 3 bedrooms, 2 bath, 2 car garage with Florida Room (an additional 135 sq ft with vented heat/air). SALT WATER POOL completed by T & D Pools NOV 2017. Other upgrades and features: Gas stove and microwave (2025) - Aluminum Garage Screen (2025) - ROOF (MAY 2022). * * VAULTED CEILINGS * * Tile flooring throughout except for bedrooms and Florida room. Creamy white raised panel wood cabinets in kitchen and bathrooms. All bedrooms have closets. Florida room with GLASS WINDOWS and SOLAR SCREENS (heat blocking and helps with privacy). FANTASTIC POOL AR
Key facts
- Roof
- Florida room
- Pool home
Tags
Property features AI
Finance
- Other: Turnkey (furnished); Home warranty included; Lease restrictions apply; Total living area (public records): 1,404; Building area total: 2,069
- Financial info: CDD present
- HOA & community: Has HOA; Association amenities include pool, recreational facilities, tennis and pickleball courts, shuffleboard, golf; Community features: association-owned recreation, community mailbox, deed restrictions, golf carts allowed, street lights, special community restrictions; Senior community; Pets allowed (cats and dogs, with number limit); Association fee includes pool and recreational facilities; No association fee requirement (per listing)
Exterior
- Parking: Attached 2-car garage (19x22) with garage door opener; Driveway
- Security: Fire alarm
- Utilities: Public water; Public sewer; Electricity connected and available; Natural gas connected and available; Cable available; Phone available; Broadband/high-speed internet available; Sewer and water connected/available
- Home design: Single family residence; One level; North-facing
- Construction: Block and stucco construction; Shingle roof; Slab foundation; Built as AZALEA model; Completed condition
- Exterior features: Covered patio/deck; Deck; Enclosed porch; Front porch; Screened areas; Rain gutters; Sliding doors; Irrigation system; Mature landscaping; Concrete road access (public maintained)
Interior
- Kitchen: Dishwasher; Disposal; Ice maker; Microwave; Range; Refrigerator; Freezer; Gas water heater
- Bedrooms: 3 bedrooms
- Flooring: Carpet; Tile
- Bathrooms: 2 full bathrooms
- Heating & cooling: Natural gas heating; Central air conditioning; Fireplace (electric, free-standing)
- Interior features: Ceiling fans; Eat-in kitchen; Kitchen/family room combo; Open floor plan; Solid surface counters; Vaulted ceilings; Walk-in closets; Window treatments; Blinds; Solar screens
- Laundry & utility: Inside laundry room; Washer; Dryer
Neighborhood map
What this means for you Summary
Snapshot
- This is a 3-bed/2.0-bath single-family listed at $425k.
Deal economics
- At list price, monthly cash flow is $-169 ($-2k/yr) — negative.
- To cash-flow at today's rent, offer at most $395k (7.0% below list).
- To meet the 1% rule (rent ≥ 1% of price), the offer needs to be $334k (21.5% below list).
- Recommended offer: $334k (21.5% below list) — sets the bar for 1% rule.
Location & tenants
- Location reads 70/100 on livability (#431 in FL) — a middle-class / working-renter tenant base. Strengths: schools A+, crime A+, housing A; Watch: amenities F, commute F, health & safety F.
- Sumter (rural): math 61% / reading 61% proficiency, ranked #11 of 73 in FL (top 15%) — acceptable for families but not a draw, mixed tenant base, ~2y average lease.
- Market conditions: Rents rising (+3.9%/yr); 550 active listings in the ZIP; 17 comparable units currently listed for rent nearby; rentals at typical pace (median 21d on market — plan ~3-4 weeks tenant-placement turnaround); 3,961 units permitted in Sumter County in 2024 (248 in 5+ unit buildings).
- At $3,336/mo this rent would consume 54% of the median local household income ($74k/yr) (locally 987% of renters already pay >50% of income on rent) — very limited rent-growth headroom before tenants either downsize or default.
Forward outlook
- Local home prices are declining (-3.0%/yr); year-one equity from $3k of loan paydown is wiped out by about $13k of value loss. Plan a longer hold.
- Sumter County population projected at +45% by 2050 — long-run rental-demand tailwind backs the buy-and-hold thesis.
Negotiation context
- It's been on market 25 days — a 2% lower offer ($419k) is reasonable based on typical stale-listing flexibility.
- 3 sale attempts since 12y ago; this cycle's ask has dropped $40k (9%) from the opening price — seller is motivated, your offer sets the floor, not the list.
Risks & watch-outs
- Climate carrying-cost: severe wind risk, 99% chance of damaging wind over 30y; extreme-heat days projected 6→18/yr by 2055 (HVAC capex compounding) — expect insurance premiums to compound above CPI over the hold.
Questions for the listing agent
- What do current leases actually rent for vs. the listed asking? Can we see a recent rent roll and the last 12 months of T-12 income?
- What does the HOA fee cover, when was the last increase, and are there any pending special assessments or reserve-fund shortfalls?
- Is there a deadline driving the sale (1031 exchange, divorce, estate, relocation)? That informs how much negotiation room exists.
- Schools are A-rated — typically a magnet for longer-tenancy family renters. What's the average tenant stay here, and is there a school-zone premium baked into asking?
- The area grade is low — what's the realistic commute time and amenity access for the typical tenant pool here? Any planned neighborhood developments (good or bad) we should know about?
- What's the average days-on-market for RENTAL listings here right now (not sales)? A rising rental-DOM trend means longer vacancies and softer asking-rent achievability than the comps imply.
- What's the recent tenant-quality profile in this submarket — average credit score on applications, eviction rate, late-payment / NSF rate, and stable-employment percentage? A property-management company in the area should have these aggregated.
- How much new for-sale + rental construction is in the pipeline within 1–3 miles? Heavy new supply typically softens prices + rents 12–24 months out; constrained supply supports both.
Investment metrics
- 1% rule
- 0.78% ✗
- Cap rate
- 5.82%
- Cash-on-cash
- -1.70%
- DSCR
- 0.92
- GRM
- 10.6
CMA / ARV
- ARV (on-the-fly)
- $314,496
- Comps found
- 12
Show comp detail 12 sales within ~0.75 mi
| Address | Dist | Beds/Ba | Sqft | Sold | Price | $/sf | Match |
|---|---|---|---|---|---|---|---|
| 2104 Callaway Dr | 0.20mi | 3/2.0 | 1,392 (-1%) | 2mo | $310,000 | $223 | 88 |
| 519 Weston Manor Dr | 0.07mi | 3/2.0 | 1,505 (+7%) | 1mo | $374,900 | $249 | 84 |
| 2297 Welcome Way | 0.38mi | 3/2.0 | 1,392 (-1%) | 0mo | $330,000 | $237 | 80 |
| 610 Danbury St | 0.53mi | 3/2.0 | 1,407 (+0%) | 1mo | $340,000 | $242 | 74 |
| 2083 Jasper Way | 0.54mi | 3/2.0 | 1,397 (-0%) | 2mo | $333,500 | $239 | 72 |
| 871 Castleberry Cir | 0.35mi | 3/2.0 | 1,572 (+12%) | 2mo | $390,750 | $249 | 62 |
| 1867 Treadwell Ter | 0.39mi | 3/2.0 | 1,572 (+12%) | 1mo | $325,000 | $207 | 61 |
| 3189 Atwell Ave | 0.75mi | 3/2.0 | 1,477 (+5%) | 0mo | $315,000 | $213 | 56 |
| 2454 Morven Park Way | 0.64mi | 3/2.0 | 1,527 (+9%) | 2mo | $318,500 | $209 | 54 |
| 2169 Smoaks St | 0.38mi | 2/2.0 (-1) | 1,196 (-15%) | 3mo | $260,000 | $217 | 50 |
| 3249 Mansfield St | 0.74mi | 3/2.0 | 1,527 (+9%) | 1mo | $336,000 | $220 | 50 |
| 915 Haretison Ave | 0.67mi | 2/2.0 (-1) | 1,248 (-11%) | 1mo | $280,000 | $224 | 44 |
Match score weights: distance 35% · size 25% · config 20% · recency 20%. Top-matched comps best support the ARV.
Projected returns pro-forma
-3.0% appreciation · 3.92% rent growth · sell at horizon
- IRR
- -18.1%
- Equity multiple
- 0.36×
- Total profit
- $-76,533
- Equity at exit
- $63,369
- IRR
- -8.8%
- Equity multiple
- 0.43×
- Total profit
- $-67,583
- Equity at exit
- $36,746
Cash invested: $119,000 (down + closing). Projections, not guarantees.
Landlord ↔ Tenant lean methodology
- Overall (STATE)
- 87 Strongly Landlord-Friendly
- State Florida
- 87 Strongly Landlord-Friendly · R+3
- County
- — inherits STATE
- City
- — inherits STATE
ZIP-level market 32162
- Home prices YoY
- -6.9%
- Rents YoY
- 3.9%
- Active inventory
- 550
- Price-to-rent
- 10.6×
Monthly cashflow live
- Estimated rent
- $3,336 high interval (Pro) →
- Mortgage (P&I)
- −$2,229
- Tax from tax record
- −$191 /mo · $2,296/yr
- Insurance
- −$177
- HOA
- −$207
- Vacancy / Maint / Mgmt
- −$701
- Net cashflow
- $-169
Break-even live
UW: 25.0% down · 7.5% · 30yr · 1.5% tax · 5.0% vac · 8.0% maint · 8.0% mgmt
Financing live
Cash to close
- Down payment
- $106,250
- Closing costs
- $12,750
- Reserves months
- —
- Total cash needed
- —
Loan-product check · same deal, 3 products live
Conventional
25% down · 7.5% · 30yr
- Down + closing
- —
- Monthly P&I
- —
- Monthly cashflow
- —
- DSCR
- —
- Eligible?
- —
Personal DTI + credit; lowest rate.
DSCR
20% down · 8.5% · 30yr
- Down + closing
- —
- Monthly P&I
- —
- Monthly cashflow
- —
- DSCR
- —
- Eligible?
- —
No personal income docs; deal must DSCR.
Hard money
10% down · 12.0% · 12mo
- Down + closing
- —
- Monthly P&I
- —
- Monthly cashflow
- —
- DSCR
- —
- Eligible?
- —
Short-term bridge; refi at stabilization.
Rent comps 17 comps
| Address | Beds | Baths | Sqft | Rent | $/sqft | DOM | Units | Dist |
|---|---|---|---|---|---|---|---|---|
| 650 Richland Rd The Villages, FL | 2.0 | 2.0 | 1188 | $4,500 | $3.79 | 21d | 1 | 0.27mi |
| 2111 Thornton Ter The Villages, FL | 2.0 | 2.0 | 1156 | $4,400 | $3.81 | 21d | 1 | 0.28mi |
| 3292 Riverton Rd The Villages, FL | 2.0 | 2.0 | 1143 | $2,100 | $1.84 | 21d | 1 | 0.65mi |
| 6367 NE 118th Ave The Villages, FL | 3.0–4.0 | 2.0–2.5 | 1645 | $1,925 | $1.17 | 21d | 10 | 0.74mi |
| 3260 Atwell Ave The Villages, FL | 3.0 | 2.0 | 1392 | $2,500 | $1.80 | 21d | 1 | 0.77mi |
| 2340 Pickens Pl The Villages, FL | 2.0 | 2.0 | 1156 | $1,900 | $1.64 | 21d | 1 | 0.83mi |
| 3207 Woodridge Dr The Villages, FL | 2.0 | 2.0 | 1148 | $4,200 | $3.66 | 21d | 1 | 0.87mi |
| 2390 Southern Oak St The Villages, FL | 2.0 | 2.0 | 1156 | $5,300 | $4.58 | 21d | 1 | 0.87mi |
| 3489 Cambria Cir The Villages, FL | 2.0 | 2.0 | 1188 | $1,745 | $1.47 | 21d | 1 | 1.00mi |
| 888 Radclife Berea Pl The Villages, FL | 2.0 | 2.0 | 1288 | $4,200 | $3.26 | 21d | 1 | 1.07mi |
| 5308 Bowline Ct Oxford, FL | 3.0 | 2.0 | 1402 | $1,800 | $1.28 | 21d | 1 | 1.09mi |
| 2685 Craven Way The Villages, FL | 2.0 | 2.0 | 1156 | $4,600 | $3.98 | 21d | 1 | 1.12mi |
| 971 Kingmont Ter The Villages, FL | 3.0 | 2.0 | 1392 | $3,400 | $2.44 | 21d | 1 | 1.15mi |
| 5336 Edgewater Way Unit 5336 Oxford, FL | 3.0 | 2.0 | 1291 | $2,000 | $1.55 | 21d | 1 | 1.19mi |
| 3545 Idlewood Loop The Villages, FL | 2.0 | 2.0 | 1240 | $4,500 | $3.63 | 21d | 1 | 1.23mi |
| 2864 Leicester Ter Unit 1525680P The Villages, FL | 2.0 | 2.0 | 1130 | $2,090 | $1.85 | 21d | 1 | 1.29mi |
| 12020 Brush Hill Rd Oxford, FL | 1.0–3.0 | 1.0–2.0 | 947 | $2,295 | $2.42 | 21d | 15 | 1.33mi |
HOA detail
- Monthly dues
- $207 · $2,484/yr
- Likely covers
- watergaspool
Listing history 20 events
-
2026-06-19days on market $425,000 Active 25 DOM
-
2026-06-18days on market $425,000 Active 24 DOM
-
2026-06-17days on market $425,000 Active 23 DOM
-
2026-06-16days on market $425,000 Active 22 DOM
-
2026-06-15days on market $425,000 Active 21 DOM
-
2026-06-14pricedays on market $425,000 Active 19 DOM
-
2026-06-13days on market $455,000 Active 18 DOM
-
2026-06-10days on market $455,000 Active 16 DOM
-
2026-06-09days on market $455,000 Active 15 DOM
-
2026-06-08days on market $455,000 Active 14 DOM
-
2026-06-07pricedays on market $455,000 Active 13 DOM
-
2026-06-02days on market $465,000 Active 8 DOM
-
2026-06-01days on market $465,000 Active 7 DOM
-
2026-05-31days on market $465,000 Active 6 DOM
-
2026-05-30days on market $465,000 Active 5 DOM
-
2026-05-26$465,000 Active
-
2015-05-17historical
-
2014-12-01historical
-
2014-11-20$279,900 Active
-
2014-11-19$279,900
ⓘ Source: listings_history table (triggers on properties + properties_extension) + one-shot
backfill from property_details.listing_events for pre-trigger history.
Tax reassessment forecast FL · Resets to sale price
- Current annual tax
- $2,296 · $191/mo
- Projected year-2 tax
- $3,528 · $294/mo
- Expected delta
- +$1,231/yr (+$103/mo · 53.6%)
ⓘ Screening estimate from a state-policy table — verify with the county assessor before closing.
Climate risk First Street
- Flood 1/10 Low FEMA zone X (unshaded) · 0% chance over 30 yrs
- Wildfire 4/10 Moderate
- Heat 8/10 Severe 6 d/yr ≥109°F today · 18 d/yr by 30 yrs out
- Wind 9/10 Extreme 99% chance of damaging wind over 30 yrs
- Air quality 3/10 Moderate 2 unhealthy d/yr today · 3 by 30 yrs out
Nearby sold comps map
Loading sold comps map…
Walkable amenities ~0.75 mi
Loading nearby amenities…
Taxation est. · year 1
- Rental income
- $40,031
- − Mortgage interest
- −$23,807
- − Property taxes
- −$2,296
- − Insurance
- −$2,125
- − Repairs & maintenance
- −$3,203
- − Management
- −$3,203
- − HOA
- −$2,484
- − Depreciation
- −$12,364
- Taxable loss
- −$9,449
- Est. tax savings @ 24.0%
- +$2,268
- After-tax cash flow
- $243/yr
For passive investors: Depreciation is non-cash, so a rental often shows a tax loss while cash-flowing — sheltering income. Rental losses are passive: they offset passive income freely, and up to $25,000/yr can offset ordinary (W-2) income if you actively participate and your MAGI is under $100k (phasing out to $0 by $150k); unused losses carry forward. On sale, claimed depreciation is recaptured at up to 25%, and gains may owe capital-gains tax (a 1031 exchange can defer both). Figures are a year-1 estimate at your 24.0% rate — not tax advice; consult a CPA.
Schools (NCES district)
- District
- Sumter
- NCES district ID
- 1201800
- Math proficiency
- 61% ▼ -4.00%
- Reading proficiency
- 61% ▼ -2.00%
- Median HH income
- $48,240
- Composite
- 51.74/100
- National rank
- #1682
- State rank
- #11 of 73 in FL
Livability — The Villages
- Score
- 70/100
- State rank
- #431
- US rank
- #7363
Category grades
Schools grade is shown separately in the Schools card above.
Census & demographics
- Census place
- The Villages, FL
- County
- Sumter County · 110,591 people
- City population
- 83,973
- Metro
- The Villages, FL
- Population (ZIP)
- 55,424
- Household income
- $74,119
- Rent vs Own
- Severe rent burden
- 987.0
Population outlook (Sumter County) Hauer SSP2
- Today (2025)
- 161,172 people
- By 2030
- 180,083 · +11.7%
- By 2040
- 209,892 · +30.2%
- By 2050
- 234,186 · +45.3%
- By 2075
- 284,602 · +76.6%
- By 2100
- 317,039 · +96.7%
Race, ethnicity, and origin ACS 2023
- Neighborhood character
- Predominantly White (95%)
- Race & ethnicity
- White 95% Two or more races 2% Hispanic / Latino 2% Asian 1% Black 1%
- Common ancestry
- Romanian 7% Slovak 4% Lithuanian 4%
- Foreign-born
- 5% · Canada
- Languages at home
- 96% English-only · Spanish 1% Tagalog/Filipino 1%
Political lean MEDSL · Sumter
- 2024 margin
- Solid R (+37.6) · D 30.9% · R 68.6%
- 2008→2024 swing
- -10.6pp toward R · 2008: -27.0pp · 2024: -37.6pp
- All cycles
- 2024: R+37.6 2020: R+36.1 2016: R+39.2 2012: R+34.9 2008: R+27.0
Not yet ingested
- Civics
- —
Market trends
- HPI YoY
- ▼ -16.16%
- Current HPI
- 218.1956
- Rent YoY
- ▲ 3.92%
- Metro
- The Villages, FL
- State GDP YoY
- ▲ 3.28%
- F500 in state
- 36
Industry mix (Fortune 500 HQ in FL)
| Industry | F500 HQs | Revenue |
|---|---|---|
| Industrial Technology | 2 | $29B |
|
||
| Insurance | 2 | $17B |
|
||
| Retail | 1 | $60B |
|
||
| Technology Distribution | 1 | $58B |
|
||
| Homebuilding | 1 | $35B |
|
||
| Technology Manufacturing | 1 | $35B |
|
||
Price history
+66.1% since first listed5 events — show timeline
- 2026-05-26 Listed $465,000 Stellar MLS as Distributed by MLS Grid
- 2015-05-17 Listing Removed — Stellar MLS as Distributed by MLS Grid
- 2014-12-01 Listing Removed — Stellar MLS as Distributed by MLS Grid
- 2014-11-20 Listed $279,900 Stellar MLS as Distributed by MLS Grid
- 2014-11-19 Listed $279,900 Stellar MLS as Distributed by MLS Grid
Property tax history
+1.1%/yrLatest (2025): $2,296 · +1.3% YoY. Source: county tax records.
Cash-flow waterfall
monthlySold comps — $/sqft
last 12 mo · ≤1 miLoading sold comps…