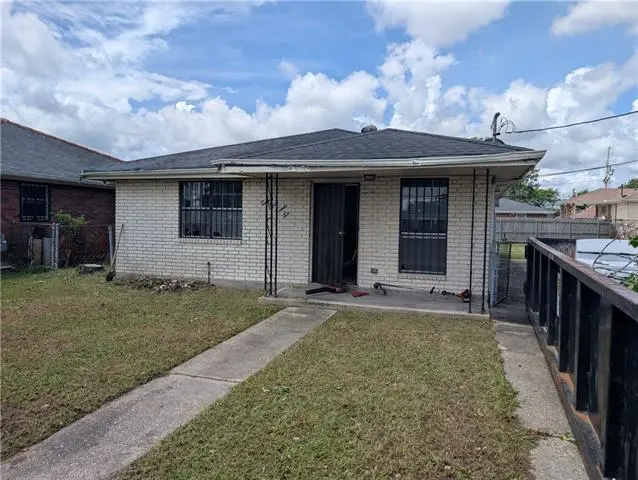
7726 Vanderkloot Ave · New Orleans, LA
Flood risk 8/10 · Major
- FEMA flood zone
- X (shaded)
- Chance of flooding over 30 yrs
- 0.6%
- Est. flood insurance / yr
- $507 – $1,088
Fire risk 1/10 · Minimal
- Est. fire insurance / yr
- $1,269 – $2,357
Heat risk 10/10 · Severe
- Hot days now (above 107°F)
- 7 days/yr
- Hot days in 30 yrs
- 21 days/yr
Wind risk 10/10 · Severe
- Chance of severe wind over 30 yrs
- 99.0%
Air-quality risk 3/10 · Minor
- Unhealthy air days now
- 3 days/yr
- Unhealthy air days in 30 yrs
- 3 days/yr
Risk factors via First Street. Map © Google.
Why this score? — see what drove the D grade
The composite is a weighted blend of 9 inputs, each scored 0–100. Each bar is that input's sub-score; the figure is the points it added to the 100-point composite (weight × sub-score).
- Cash flow +15.0/30.0
- ARV discount +7.5/15.0
- 1% rule +5.0/10.0
- DSCR +5.0/10.0
- Livability +4.0/5.0
- Rent growth +2.5/5.0
- Condition / age +2.5/5.0
- Schools +1.6/10.0
- Appreciation +0.0/10.0
$20,000
🖨 Deal sheet 📄 Offer letter ✓ Due diligence
Listing remarks MLS
GREAT LOCATION, GOOD INVESTMENT, ALL BRICK HOME. FLOODED & GUTTED.
Key facts
- Single family home
- Ranch style
- Brick veneer
Tags
Property features AI
Exterior
- Utilities: Electric service by Entergy
- Home design: Single family residence; Composition roof; Brick construction
- Construction: Brick exterior; Composition roof
- Exterior features: Chain link fencing
Interior
- Bedrooms: Bedroom 1; Bedroom 2; Bedroom 3
- Bathrooms: 1 full bathroom; 1 half bathroom
- Heating & cooling: Central heating; Central air conditioning
- Interior features: Three bedrooms
Neighborhood map
What this means for you Summary
Snapshot
- This is a 3-bed/2.0-bath single-family listed at $20k.
Deal economics
- At list price, monthly cash flow is $881 ($11k/yr) — positive.
- The deal already cash-flows at list — no discount required.
- Meets the 1% rule at list price ($1k rent vs $20k).
- Cap rate 63.1% vs local median 4.4% in New Orleans — top-decile yield for the area; either an underpriced asset or a hidden risk that comps aren't pricing in. Stress-test before assuming the spread holds.
Location & tenants
- Location reads 81/100 on livability (#3 in LA, #1,383 nationally) — a professional / high-income tenant draw. Strengths: amenities A+, commute A+, health & safety A+; Watch: crime C-, employment D.
- Orleans Parish (urban): math 11% / reading 27% proficiency, ranked #69 of 98 in LA (top 70%) — low school quality limits family demand, transient renter base, plan for 1-2y turnover; 68% free/reduced lunch — lower-income household profile, screen leases tightly.
- Market conditions: 128 active listings in the ZIP; 37 comparable units currently listed for rent nearby; rentals at typical pace (median 24d on market — plan ~3-4 weeks tenant-placement turnaround); lower-income renter base — watch delinquency; 710 units permitted in Orleans Parish in 2024 (244 in 5+ unit buildings).
- This rent runs 40% of the median local income ($41k/yr) — at the standard rent-burdened threshold; future hikes will face affordability resistance.
Forward outlook
- Local home prices are declining (-3.0%/yr); year-one equity from $138 of loan paydown is wiped out by about $600 of value loss. Plan a longer hold.
- Orleans County population projected at +61% by 2050 — long-run rental-demand tailwind backs the buy-and-hold thesis.
- At projected returns (-3.0% appreciation + 3.0% rent growth), your $6k cash investment doubles in ~1 year — after that, you're playing with house money.
Negotiation context
- Only 10 days on market — expect competitive offers; lowballing is unlikely to land.
- 5 sale attempts since 27y ago with the ask held roughly flat each time — persistent listings suggest the price (not the market) is what's stuck; bring a comps-based counter.
Risks & watch-outs
- Watch-outs: flood insurance adds $66/mo.
- Climate carrying-cost: severe flood risk; severe wind risk, 99% chance of damaging wind over 30y; extreme-heat days projected 7→21/yr by 2055 (HVAC capex compounding) — expect insurance premiums to compound above CPI over the hold.
Questions for the listing agent
- Built in 1970 — when were the roof, HVAC, electrical panel, plumbing, and water heater last replaced?
- What's the actual annual flood-insurance premium (NFIP or private), and is the property in a SFHA with mandatory coverage?
- Is there a deadline driving the sale (1031 exchange, divorce, estate, relocation)? That informs how much negotiation room exists.
- The area grade is low — what's the realistic commute time and amenity access for the typical tenant pool here? Any planned neighborhood developments (good or bad) we should know about?
- What's the average days-on-market for RENTAL listings here right now (not sales)? A rising rental-DOM trend means longer vacancies and softer asking-rent achievability than the comps imply.
- What's the recent tenant-quality profile in this submarket — average credit score on applications, eviction rate, late-payment / NSF rate, and stable-employment percentage? A property-management company in the area should have these aggregated.
- How much new for-sale + rental construction is in the pipeline within 1–3 miles? Heavy new supply typically softens prices + rents 12–24 months out; constrained supply supports both.
Investment metrics
- 1% rule
- 6.87% ✓
- Cap rate
- 63.13%
- Cash-on-cash
- 203.00%
- DSCR
- 10.03
- GRM
- 1.2
CMA / ARV
- ARV (on-the-fly)
- $133,280
- Comps found
- 4
Show comp detail 4 sales within ~0.75 mi
| Address | Dist | Beds/Ba | Sqft | Sold | Price | $/sf | Match |
|---|---|---|---|---|---|---|---|
| 7822 Hickman St | 0.08mi | 3/2.0 | 1,184 (+6%) | 20mo | $95,000 | $80 | 70 |
| 7431 Shaw Ave | 0.36mi | 2/2.0 (-1) | 1,187 (+6%) | 2mo | $149,900 | $126 | 67 |
| 7351 Poitevent St | 0.35mi | 3/2.0 | 1,019 (-9%) | 5mo | $100,000 | $98 | 65 |
| 7508 Burke Rd | 0.18mi | 4/1.5 (+1) | 1,258 (+12%) | 13mo | $150,000 | $119 | 53 |
Match score weights: distance 35% · size 25% · config 20% · recency 20%. Top-matched comps best support the ARV.
Projected returns pro-forma
-3.0% appreciation · 3.0% rent growth · sell at horizon
- IRR
- —
- Equity multiple
- 10.45×
- Total profit
- $52,923
- Equity at exit
- $2,982
- IRR
- —
- Equity multiple
- 22.17×
- Total profit
- $118,576
- Equity at exit
- $1,729
Cash invested: $5,600 (down + closing). Projections, not guarantees.
Landlord ↔ Tenant lean methodology
- Overall (STATE)
- 90 Strongly Landlord-Friendly
- State Louisiana
- 90 Strongly Landlord-Friendly · R+12
- County
- — inherits STATE
- City
- — inherits STATE
ZIP-level market 70127
- Home prices YoY
- -29.2%
- Active inventory
- 128
- Price-to-rent
- 1.2×
Monthly cashflow live
- Estimated rent
- $1,374 high interval (Pro) →
- Mortgage (P&I)
- −$105
- Tax est. 1.5%
- −$25 /mo · $300/yr
- Insurance
- −$8
- Flood insurance flood zone
- −$66 /mo · $798/yr
- HOA
- −$0
- Vacancy / Maint / Mgmt
- −$289
- Net cashflow
- $881
Break-even live
UW: 25.0% down · 7.5% · 30yr · 1.5% tax · 5.0% vac · 8.0% maint · 8.0% mgmt
Financing live
Cash to close
- Down payment
- $5,000
- Closing costs
- $600
- Reserves months
- —
- Total cash needed
- —
Loan-product check · same deal, 3 products live
Conventional
25% down · 7.5% · 30yr
- Down + closing
- —
- Monthly P&I
- —
- Monthly cashflow
- —
- DSCR
- —
- Eligible?
- —
Personal DTI + credit; lowest rate.
DSCR
20% down · 8.5% · 30yr
- Down + closing
- —
- Monthly P&I
- —
- Monthly cashflow
- —
- DSCR
- —
- Eligible?
- —
No personal income docs; deal must DSCR.
Hard money
10% down · 12.0% · 12mo
- Down + closing
- —
- Monthly P&I
- —
- Monthly cashflow
- —
- DSCR
- —
- Eligible?
- —
Short-term bridge; refi at stabilization.
Rent comps 37 comps
| Address | Beds | Baths | Sqft | Rent | $/sqft | DOM | Units | Dist |
|---|---|---|---|---|---|---|---|---|
| 9411 Dinkins St New Orleans, LA | 2.0 | 1.0 | 900 | $1,250 | $1.39 | 3d | 1 | 0.15mi |
| 8001 Brevard Ave Unit A New Orleans, LA | 2.0 | 1.0 | 802 | $1,250 | $1.56 | 23d | 1 | 0.15mi |
| 8002 Trapier Ave Unit A New Orleans, LA | 2.0 | 1.0 | 900 | $1,050 | $1.17 | 23d | 1 | 0.17mi |
| 9408 Hayne Blvd Unit G New Orleans, LA | 2.0 | 1.0 | 1200 | $1,350 | $1.12 | 23d | 1 | 0.21mi |
| 9002 Morrison Rd New Orleans, LA | 2.0 | 1.5 | 1050 | $1,150 | $1.10 | 20d | 1 | 0.33mi |
| 8802 Morrison Rd New Orleans, LA | 2.0 | 1.0 | 1071 | $1,275 | $1.19 | 23d | 1 | 0.38mi |
| 7500 Symmes Ave New Orleans, LA | 4.0 | 2.0 | 1400 | $2,100 | $1.50 | 23d | 1 | 0.48mi |
| 7861 Symmes Ave Unit 1 New Orleans, LA | 2.0 | 1.5 | 950 | $1,280 | $1.35 | 23d | 1 | 0.51mi |
| 7830 Means Ave Unit D New Orleans, LA | 2.0 | 1.5 | 900 | $1,200 | $1.33 | 23d | 1 | 0.51mi |
| 7800 Read Blvd Unit B New Orleans, LA | 2.0 | 1.5 | 931 | $1,200 | $1.29 | 21d | 1 | 0.55mi |
| 10000 Hayne Blvd Unit 201 New Orleans, LA | 2.0 | 1.0 | 736 | $1,100 | $1.49 | 23d | 1 | 0.56mi |
| 7901 Read Blvd Unit 206 New Orleans, LA | 2.0 | 1.0 | 950 | $1,100 | $1.16 | 2d | 1 | 0.62mi |
| 7937 Read Blvd New Orleans, LA | 3.0 | 2.0 | 1100 | $1,650 | $1.50 | 23d | 1 | 0.63mi |
| 9042 Bunker Hill Rd New Orleans, LA | 3.0 | 1.5 | 1400 | $1,450 | $1.04 | 16d | 1 | 0.70mi |
| 9040 Bunker Hill Rd New Orleans, LA | 3.0 | 1.5 | 1400 | $1,450 | $1.04 | 16d | 1 | 0.71mi |
| 9022 Bunker Hill Rd New Orleans, LA | 3.0 | 1.5 | 1400 | $1,400 | $1.00 | 23d | 1 | 0.71mi |
| 9020 Bunker Hill Rd New Orleans, LA | 3.0 | 1.5 | 1400 | $1,400 | $1.00 | 23d | 1 | 0.71mi |
| 7019 Crowder Blvd Unit 126 New Orleans, LA | 2.0 | 1.5 | 952 | $982 | $1.03 | 23d | 1 | 0.73mi |
| 7019 Huntington Park Dr Unit 21 New Orleans, LA | 2.0 | 1.5 | 952 | $982 | $1.03 | 23d | 1 | 0.77mi |
| 7019 Huntington Park Dr New Orleans, LA | 2.0 | 1.5 | 952 | $986 | $1.04 | 23d | 1 | 0.77mi |
| 10680 Hayne Blvd Apt B New Orleans, LA | 2.0 | 1.5 | 1000 | $1,050 | $1.05 | 14d | 1 | 0.81mi |
| 10680 Hayne Blvd Unit A New Orleans, LA | 2.0 | 1.0 | 1000 | $1,050 | $1.05 | 14d | 1 | 0.81mi |
| 8038 Lacombe St Apt A New Orleans, LA | 2.0 | 1.5 | 1000 | $1,050 | $1.05 | 3d | 1 | 0.82mi |
| 7909 Edward St New Orleans, LA | 3.0 | 1.5 | 1073 | $1,850 | $1.72 | 3d | 1 | 0.98mi |
| 8025 Pompano St New Orleans, LA | 3.0 | 1.0 | 1131 | $1,595 | $1.41 | 16d | 1 | 1.07mi |
| 10704 Roger Dr Unit D New Orleans, LA | 2.0 | 1.5 | 1050 | $950 | $0.90 | 23d | 1 | 1.15mi |
| 10821 Roger Dr Unit A New Orleans, LA | 2.0 | 1.5 | 1200 | $1,400 | $1.17 | 23d | 1 | 1.17mi |
| 6881 Parc Brittany Blvd New Orleans, LA | 1.0–2.0 | 1.0–2.0 | 741 | $1,055 | $1.42 | 1d | 31 | 1.19mi |
| 10940 Roger Dr Unit A New Orleans, LA | 2.0 | 2.0 | 1000 | $900 | $0.90 | 23d | 1 | 1.26mi |
| 11000 Roger Dr Unit A New Orleans, LA | 2.0 | 2.0 | 800 | $1,100 | $1.38 | 2d | 1 | 1.26mi |
| 6835 Mayo Blvd Unit C New Orleans, LA | 2.0 | 1.5 | 840 | $1,195 | $1.42 | 23d | 1 | 1.34mi |
| 4923 Eastview Dr New Orleans, LA | 3.0 | 2.0 | 912 | $1,400 | $1.54 | 23d | 1 | 1.40mi |
| 7835 Unity Dr New Orleans, LA | 2.0 | 1.0 | 850 | $1,300 | $1.53 | 23d | 1 | 1.40mi |
| 5131 Bundy Rd New Orleans, LA | 1.0–3.0 | 1.0–2.0 | 1000 | $1,314 | $1.31 | 1d | 21 | 1.41mi |
| 4901 Bonita Dr New Orleans, LA | 2.0 | 1.0 | 900 | $1,100 | $1.22 | 23d | 1 | 1.45mi |
| 4880 Viola St New Orleans, LA | 3.0 | 2.0 | 1150 | $1,595 | $1.39 | 23d | 1 | 1.47mi |
| 4828 Eastview Dr New Orleans, LA | 4.0 | 2.0 | 1260 | $1,675 | $1.33 | 23d | 1 | 1.47mi |
Listing history 9 events
-
2026-06-18days on market $20,000 Active 10 DOM
-
2026-06-17days on market $20,000 Active 9 DOM
-
2026-06-16days on market $20,000 Active 8 DOM
-
2026-06-15days on market $20,000 Active 7 DOM
-
2026-06-13days on market $20,000 Active 5 DOM
-
2026-06-10remarks 610-char remark
-
2026-06-10days on market $20,000 Active 2 DOM
-
2026-06-09remarks 549-char remark
-
2026-06-09$20,000 Active 1 DOM
ⓘ Source: listings_history table (triggers on properties + properties_extension) + one-shot
backfill from property_details.listing_events for pre-trigger history.
Climate risk First Street
- Flood 8/10 Severe FEMA zone X (shaded) · 60% chance over 30 yrs
- Wildfire 1/10 Low
- Heat 10/10 Extreme 7 d/yr ≥107°F today · 21 d/yr by 30 yrs out
- Wind 10/10 Extreme 99% chance of damaging wind over 30 yrs
- Air quality 3/10 Moderate 3 unhealthy d/yr today · 3 by 30 yrs out
Nearby sold comps map
Loading sold comps map…
Walkable amenities ~0.75 mi
Loading nearby amenities…
Taxation est. · year 1
- Rental income
- $16,489
- − Mortgage interest
- −$1,120
- − Property taxes
- −$300
- − Insurance
- −$897
- − Repairs & maintenance
- −$1,319
- − Management
- −$1,319
- − Depreciation
- −$582
- Taxable income
- $10,951
- Est. tax owed @ 24.0%
- −$2,628
- After-tax cash flow
- $7,942/yr
For passive investors: Depreciation is non-cash, so a rental often shows a tax loss while cash-flowing — sheltering income. Rental losses are passive: they offset passive income freely, and up to $25,000/yr can offset ordinary (W-2) income if you actively participate and your MAGI is under $100k (phasing out to $0 by $150k); unused losses carry forward. On sale, claimed depreciation is recaptured at up to 25%, and gains may owe capital-gains tax (a 1031 exchange can defer both). Figures are a year-1 estimate at your 24.0% rate — not tax advice; consult a CPA.
Schools (NCES district)
- District
- Orleans Parish
- NCES district ID
- 2201170
- Math proficiency
- 11% ▼ -52.00%
- Reading proficiency
- 27% ▼ -46.00%
- Median HH income
- $37,011
- Composite
- 15.78/100
- National rank
- #9271
- State rank
- #69 of 98 in LA
Livability — New Orleans
- Score
- 81/100
- State rank
- #3
- US rank
- #1383
Category grades
Schools grade is shown separately in the Schools card above.
Census & demographics
- Census place
- New Orleans, LA
- County
- Orleans Parish · 338,817 people
- City population
- 338,817
- Metro
- New Orleans-Metairie, LA
- Population (ZIP)
- 23,107
- Household income
- $40,765
- Rent vs Own
- Severe rent burden
- 2030.0
Population outlook (Orleans County) Hauer SSP2
- Today (2025)
- 513,025 people
- By 2030
- 575,781 · +12.2%
- By 2040
- 700,174 · +36.5%
- By 2050
- 826,541 · +61.1%
- By 2075
- 1,123,374 · +119.0%
- By 2100
- 1,355,609 · +164.2%
Race, ethnicity, and origin ACS 2023
- Neighborhood character
- Predominantly Black (91%)
- Race & ethnicity
- Black 91% Hispanic / Latino 4% Two or more races 4% White 2%
- Common ancestry
- Lithuanian 1% Hispanic 1%
- Foreign-born
- 3% · Canada, Vietnam
- Languages at home
- 96% English-only · Spanish 2%
Political lean MEDSL · Orleans
- 2024 margin
- Solid D (+67.0) · D 82.2% · R 15.2% · Other 2.7%
- 2008→2024 swing
- +6.7pp toward D · 2008: 60.3pp · 2024: 67.0pp
- All cycles
- 2024: D+67.0 2020: D+68.2 2016: D+66.2 2012: D+62.5 2008: D+60.3
Not yet ingested
- Civics
- —
Market trends
- HPI YoY
- ▼ -72.43%
- Current HPI
- 175.4465
- Rent YoY
- —
- Metro
- New Orleans-Metairie, LA
- State GDP YoY
- ▲ 3.29%
- F500 in state
- 10
Industry mix (Fortune 500 HQ in LA)
| Industry | F500 HQs | Revenue |
|---|---|---|
| Telecommunications | 2 | $23B |
|
||
| Utilities | 1 | $12B |
|
||
| Wholesale / Distribution | 1 | $5B |
|
||
| Advertising | 1 | $2B |
|
||
Price history
-70.8% since first listed9 events — show timeline
- 2026-05-26 Listed $20,000 AcadianaMLS
- 2026-04-27 Sold (Public Records) $95,000 Public Records
- 2009-03-31 Sold (MLS) $29,000 GSREIN
- 2008-11-25 Listed $65,000 GSREIN
- 2008-11-25 Listed $65,000 AcadianaMLS
- 1999-05-28 Sold (Public Records) $68,500 Public Records
- 1999-05-28 Sold (MLS) $68,500 GSREIN
- 1999-04-07 Listed $68,500 GSREIN
- 1999-04-07 Listed $68,500 AcadianaMLS
Property tax history
+1.0%/yrLatest (2026): $1,503 · +1.1% YoY. Source: county tax records.
Cash-flow waterfall
monthlySold comps — $/sqft
last 12 mo · ≤1 miLoading sold comps…