 Triplex
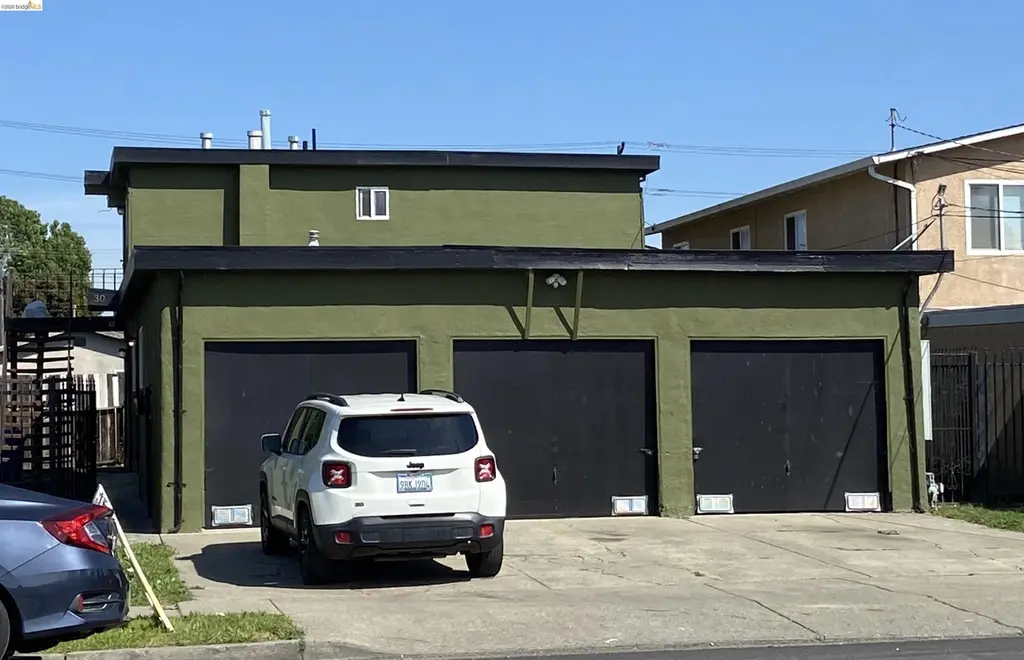
30-34 1st St · Richmond, CA
Flood risk 1/10 · Minimal
- FEMA flood zone
- X (unshaded)
- Chance of flooding over 30 yrs
- 0.0%
- Est. flood insurance / yr
- $507 – $1,088
Fire risk 1/10 · Minimal
- Est. fire insurance / yr
- $659 – $1,223
Heat risk 4/10 · Minor
- Hot days now (above 84°F)
- 7 days/yr
- Hot days in 30 yrs
- 16 days/yr
Wind risk 1/10 · Minimal
- Chance of severe wind over 30 yrs
- —
Air-quality risk 8/10 · Major
- Unhealthy air days now
- 14 days/yr
- Unhealthy air days in 30 yrs
- 14 days/yr
Risk factors via First Street. Map © Google.
Why this score? — see what drove the D grade
The composite is a weighted blend of 9 inputs, each scored 0–100. Each bar is that input's sub-score; the figure is the points it added to the 100-point composite (weight × sub-score).
- Cash flow +15.9/30.0
- DSCR +4.9/10.0
- 1% rule +4.3/10.0
- Condition / age +3.8/5.0
- ARV discount +3.5/15.0
- Rent growth +3.5/5.0
- Livability +3.1/5.0
- Schools +3.0/10.0
- Appreciation +0.0/10.0
$659,000
🖨 Deal sheet (PDF) 📄 Offer letter ✓ Due diligence
Multi-family units
County records classify this as Multi-Family (2-4 Unit). Listing-text estimate: 3 units. confirmed
Listing remarks MLS
Great opportunity for income! Good triplex building on quiet court. Live in one and collect rent on the other two! Large yard. Each unit has its own enclosed garage. Call for more details.
Key facts
- Enclosed garage
- Triplex building
- Large yard
Tags
Neighborhood map
What this means for you Summary
Snapshot
- This is a 3 × 2-bed/1.0-bath units multifamily listed at $659k. Condition is rated good.
Deal economics
- At list price, monthly cash flow is $311 ($4k/yr) — positive. Per door: $104/mo.
- The deal already cash-flows at list — no discount required.
- To meet the 1% rule (rent ≥ 1% of price), the offer needs to be $616k (6.6% below list).
- Recommended offer: $616k (6.6% below list) — sets the bar for 1% rule.
- Cap rate 6.9% vs local median 2.7% in Richmond — top-decile yield for the area; either an underpriced asset or a hidden risk that comps aren't pricing in. Stress-test before assuming the spread holds.
Location & tenants
- Location reads 62/100 on livability (#497 in CA) — a middle-class / working-renter tenant base. Strengths: commute A+, employment A, health & safety B+; Watch: schools F, crime F, amenities F.
- West Contra Costa Unified (suburban): math 24% / reading 35% proficiency, ranked #993 of 1,400 in CA (top 71%) — low school quality limits family demand, transient renter base, plan for 1-2y turnover.
- Market conditions: Rents rising (+4.0%/yr); 101 active listings in the ZIP; solid renter incomes; 2,169 units permitted in Contra Costa County in 2024 (896 in 5+ unit buildings).
- At $6,158/mo this rent would consume 90% of the median local household income ($82k/yr) (locally 1277% of renters already pay >50% of income on rent) — very limited rent-growth headroom before tenants either downsize or default.
Forward outlook
- Local home prices are declining (-3.0%/yr); year-one equity from $5k of loan paydown is wiped out by about $20k of value loss. Plan a longer hold.
- Contra Costa County population projected at +26% by 2050 — long-run rental-demand tailwind backs the buy-and-hold thesis.
Negotiation context
- It's been on market 65 days — a 6% lower offer ($619k) is reasonable based on typical stale-listing flexibility.
Questions for the listing agent
- It's been on market 65 days. Have you received any prior offers? Is the seller open to a 7% concession, seller financing, or rate buy-down credit?
- Can we see the unit-by-unit rent roll, current vacancy, and any below-market leases? What's the average tenancy length?
- What capital expenditures (roof, boiler, parking lot, exteriors) have been made in the last 5 years, and what's planned in the next 2?
- Built in 1962 — when were the roof, HVAC, electrical panel, plumbing, and water heater last replaced?
- Why hasn't it sold? Are there any deal-killer items the seller is aware of (foundation, flood, title, zoning, code violations)?
- Is there a deadline driving the sale (1031 exchange, divorce, estate, relocation)? That informs how much negotiation room exists.
- Schools are F-rated, which usually means shorter tenancies and higher turnover. Who's the typical renter profile here, and what's been the actual vacancy rate?
- Crime grade is F in this area — have there been break-ins, vandalism, or insurance claims at this property in the last 3 years? What carrier currently insures it and at what premium?
- The area grade is low — what's the realistic commute time and amenity access for the typical tenant pool here? Any planned neighborhood developments (good or bad) we should know about?
- What's the average days-on-market for RENTAL listings here right now (not sales)? A rising rental-DOM trend means longer vacancies and softer asking-rent achievability than the comps imply.
- What's the recent tenant-quality profile in this submarket — average credit score on applications, eviction rate, late-payment / NSF rate, and stable-employment percentage? A property-management company in the area should have these aggregated.
- How much new apartment / multifamily construction is in the pipeline within 1–3 miles? Heavy new supply (>2% of stock underway) typically softens rents 12–24 months out; light construction supports rent growth.
Investment metrics
- 1% rule
- 0.93% ✗
- Cap rate
- 6.86%
- Cash-on-cash
- 2.02%
- DSCR
- 1.09
- GRM
- 8.9
CMA / ARV
- ARV (median comp)
- $605,114
- List price
- $659,000
- Delta
- 8.91%
- Verdict
- FAIR
- Comps
- 20 within 1.0 mi
Projected returns pro-forma
-3.0% appreciation · 3.98% rent growth · sell at horizon
- IRR
- -12.0%
- Equity multiple
- 0.56×
- Total profit
- $-80,779
- Equity at exit
- $98,259
- IRR
- -1.4%
- Equity multiple
- 0.90×
- Total profit
- $-18,823
- Equity at exit
- $56,978
Cash invested: $184,520 (down + closing). Projections, not guarantees.
Landlord ↔ Tenant lean methodology
- Overall (STATE)
- 18 Strongly Tenant-Friendly
- State California
- 18 Strongly Tenant-Friendly · D+13
- County
- — inherits STATE
- City
- — inherits STATE
ZIP-level market 94801
- Rents YoY
- 4.0%
- Active inventory
- 101
- Price-to-rent
- 26.8×
Monthly cashflow live
- Estimated rent
- $6,158 high interval (Pro) →
- Mortgage (P&I)
- −$3,456
- Tax est. 1.5%
- −$824 /mo · $9,885/yr
- Insurance
- −$275
- HOA
- −$0
- Vacancy / Maint / Mgmt
- −$1,293
- Net cashflow
- $311
Break-even live
Sensitivity live
| Price | -10% $766 | -5% $538 | +0% $311 | +5% $83 | +10% $-145 |
|---|---|---|---|---|---|
| Rent | -10% $-176 | -5% $67 | +0% $311 | +5% $554 | +10% $797 |
| Rate | -1.0pp $642 | -0.5pp $478 | base $311 | +0.5pp $140 | +1.0pp $-34 |
3-unit breakdown (identical units grouped — click to expand)
| Units | Beds | Baths | Est. rent |
|---|---|---|---|
| 3× units | 2 | 1 | $6,159 |
| #1 | 2 | 1 | $2,053 |
| #2 | 2 | 1 | $2,053 |
| #3 | 2 | 1 | $2,053 |
| Total (3 units) | $6,158 | ||
UW: 25.0% down · 7.5% · 30yr · 1.5% tax · 5.0% vac · 8.0% maint · 8.0% mgmt
Financing live
Cash to close
- Down payment
- $164,750
- Closing costs
- $19,770
- Reserves months
- —
- Total cash needed
- —
Loan-product check · same deal, 3 products live
Conventional
25% down · 7.5% · 30yr
- Down + closing
- —
- Monthly P&I
- —
- Monthly cashflow
- —
- DSCR
- —
- Eligible?
- —
Personal DTI + credit; lowest rate.
DSCR
20% down · 8.5% · 30yr
- Down + closing
- —
- Monthly P&I
- —
- Monthly cashflow
- —
- DSCR
- —
- Eligible?
- —
No personal income docs; deal must DSCR.
Hard money
10% down · 12.0% · 12mo
- Down + closing
- —
- Monthly P&I
- —
- Monthly cashflow
- —
- DSCR
- —
- Eligible?
- —
Short-term bridge; refi at stabilization.
Listing history 16 events
-
2026-06-21days on market $659,000 Active 65 DOM
-
2026-06-18days on market $659,000 Active 62 DOM
-
2026-06-17days on market $659,000 Active 61 DOM
-
2026-06-16days on market $659,000 Active 60 DOM
-
2026-06-15days on market $659,000 Active 59 DOM
-
2026-06-13days on market $659,000 Active 57 DOM
-
2026-06-13days on market $659,000 Active 56 DOM
-
2026-06-09days on market $659,000 Active 53 DOM
-
2026-06-08days on market $659,000 Active 52 DOM
-
2026-06-07days on market $659,000 Active 51 DOM
-
2026-06-04days on market $659,000 Active 48 DOM
-
2026-06-03days on market $659,000 Active 47 DOM
-
2026-06-02days on market $659,000 Active 46 DOM
-
2026-06-01days on market $659,000 Active 45 DOM
-
2026-05-31days on market $659,000 Active 44 DOM
-
2026-04-17$659,000 Active 188-char remark
Show marketing remark (188 chars)
Great opportunity for income! Good triplex building on quiet court. Live in one and collect rent on the other two! Large yard. Each unit has its own enclosed garage. Call for more details.
ⓘ Source: listings_history table (triggers on properties + properties_extension) + one-shot
backfill from property_details.listing_events for pre-trigger history.
Climate risk First Street
- Flood 1/10 Low FEMA zone X (unshaded) · 0% chance over 30 yrs
- Wildfire 1/10 Low
- Heat 4/10 Moderate 7 d/yr ≥84°F today · 16 d/yr by 30 yrs out
- Wind 1/10 Low
- Air quality 8/10 Severe 14 unhealthy d/yr today · 14 by 30 yrs out
Nearby sold comps map
Loading sold comps map…
Walkable amenities ~0.75 mi
Loading nearby amenities…
Taxation est. · year 1
- Rental income
- $73,896
- − Mortgage interest
- −$36,914
- − Property taxes
- −$9,885
- − Insurance
- −$3,295
- − Repairs & maintenance
- −$5,912
- − Management
- −$5,912
- − Depreciation
- −$19,171
- Taxable loss
- −$7,193
- Est. tax savings @ 24.0%
- +$1,726
- After-tax cash flow
- $5,454/yr
For passive investors: Depreciation is non-cash, so a rental often shows a tax loss while cash-flowing — sheltering income. Rental losses are passive: they offset passive income freely, and up to $25,000/yr can offset ordinary (W-2) income if you actively participate and your MAGI is under $100k (phasing out to $0 by $150k); unused losses carry forward. On sale, claimed depreciation is recaptured at up to 25%, and gains may owe capital-gains tax (a 1031 exchange can defer both). Figures are a year-1 estimate at your 24.0% rate — not tax advice; consult a CPA.
Condition & rehab AI · 13 photos
This triplex is in good condition with fresh paint and well-maintained interiors, making it a solid investment for both resale and rental.
Value-add opportunities
- Both Paint freshening — Fresh paint enhances curb appeal and interior aesthetics.
- Both HVAC maintenance — Regular maintenance ensures efficient operation and reduces utility costs.
Renovation cost estimate screening
Value-add ROI direction
- Both Paint freshening — Fresh paint enhances curb appeal and interior aesthetics. ↑
- Both HVAC maintenance — Regular maintenance ensures efficient operation and reduces utility costs. ↑
ⓘ Cost ranges are severity-bucket heuristics (US national rule-of-thumb). Get contractor quotes + a written scope before underwriting a rehab budget.
Schools (NCES district)
- District
- West Contra Costa Unified
- NCES district ID
- 0632550
- Math proficiency
- 24% ▲ 1.00%
- Reading proficiency
- 35% ▲ 1.00%
- Median HH income
- $64,837
- Composite
- 30.04/100
- National rank
- #11623
- State rank
- #993 of 1400 in CA
Livability — Richmond
- Score
- 62/100
- State rank
- #497
- US rank
- #16759
Category grades
Schools grade is shown separately in the Schools card above.
Census & demographics
- Census place
- Richmond, CA
- County
- Contra Costa County · 1,059,880 people
- City population
- 183,357
- Metro
- San Francisco-Oakland-Berkeley, CA
- Population (ZIP)
- 33,591
- Household income
- $81,728
- Rent vs Own
- Severe rent burden
- 1277.0
Population outlook (Contra Costa County) Hauer SSP2
- Today (2025)
- 1,287,720 people
- By 2030
- 1,364,937 · +6.0%
- By 2040
- 1,506,209 · +17.0%
- By 2050
- 1,624,373 · +26.1%
- By 2075
- 1,853,193 · +43.9%
- By 2100
- 1,901,231 · +47.6%
Race, ethnicity, and origin ACS 2023
- Neighborhood character
- Predominantly Hispanic (66%)
- Race & ethnicity
- Hispanic / Latino 66% Two or more races 19% White 12% Black 11% Asian 6% Native American 3%
- Hispanic origin (detail)
- Mexican 42%
- Common ancestry
- Italian 3% Lithuanian 1% Swedish 1%
- Foreign-born
- 40% · Canada, China, Vietnam
- Languages at home
- 32% English-only · Spanish 61% Other Asian/Pacific 3% Chinese 2%
Political lean MEDSL · Contra Costa
- 2024 margin
- Solid D (+38.0) · D 67.3% · R 29.4% · Other 3.3%
- 2008→2024 swing
- +0.2pp no change · 2008: 37.8pp · 2024: 38.0pp
- All cycles
- 2024: D+38.0 2020: D+45.3 2016: D+43.5 2012: D+33.7 2008: D+37.8
Not yet ingested
- Civics
- —
Market trends
- HPI YoY
- ▼ -334.07%
- Current HPI
- 390.1045
- Rent YoY
- ▲ 3.98%
- Metro
- San Francisco-Oakland-Berkeley, CA
- State GDP YoY
- ▲ 3.21%
- F500 in state
- 116
Industry mix (Fortune 500 HQ in CA)
| Industry | F500 HQs | Revenue |
|---|---|---|
| Technology | 27 | $1,492B |
|
||
| Financial Services | 3 | $174B |
|
||
| Retail | 3 | $44B |
|
||
| Insurance | 3 | $26B |
|
||
| Media / Entertainment | 2 | $115B |
|
||
| Pharmaceuticals / Biotech | 2 | $62B |
|
||
Price history
1 event — show timeline
- 2026-04-17 Listed $659,000 bridgeMLS, Bay East AOR, or Contra Costa AOR
Cash-flow waterfall
monthlySold comps — $/sqft
last 12 mo · ≤1 miLoading sold comps…