304 Lockwood Dr · Houston, TX
Flood risk 4/10 · Minor
- FEMA flood zone
- X (unshaded)
- Chance of flooding over 30 yrs
- 0.22%
- Est. flood insurance / yr
- $507 – $1,088
Fire risk 1/10 · Minimal
- Est. fire insurance / yr
- $1,222 – $2,270
Heat risk 9/10 · Severe
- Hot days now (above 109°F)
- 7 days/yr
- Hot days in 30 yrs
- 24 days/yr
Wind risk 9/10 · Severe
- Chance of severe wind over 30 yrs
- 99.0%
Air-quality risk 2/10 · Minimal
- Unhealthy air days now
- 2 days/yr
- Unhealthy air days in 30 yrs
- 2 days/yr
Risk factors via First Street. Map © Google.
Why this score? — see what drove the D+ grade
The composite is a weighted blend of 9 inputs, each scored 0–100. Each bar is that input's sub-score; the figure is the points it added to the 100-point composite (weight × sub-score).
- ARV discount +15.0/15.0
- Appreciation +10.0/10.0
- Cash flow +5.8/30.0
- Livability +3.7/5.0
- 1% rule +3.4/10.0
- Schools +2.7/10.0
- Condition / age +2.5/5.0
- Rent growth +1.8/5.0
- DSCR +0.2/10.0
$299,000
🖨 Deal sheet 📄 Offer letter ✓ Due diligence
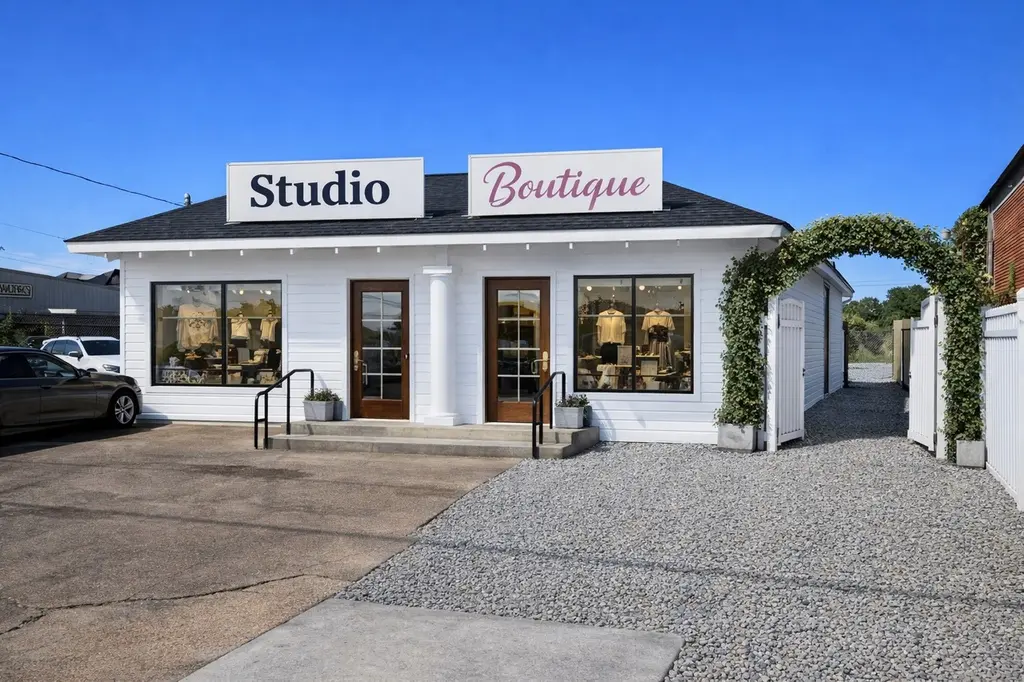
Listing remarks MLS
7,769 Cars Per Day on Lockwood. Own your own OFFICE/ studio/ boutique on a high traffic road by downtown. CASH-Flowing Commercial Investment Opportunity in rapidly developing East End /next to Hike and Bike Trail! Steps from Metro Rail!. NEW ROOF (2025) NEW WATER HEATER (2025) Office/ Retail/ Art Studio Duplex. +/- 2,000sf building with Suite A is CBD Store and Suite B is Available. Can be for your own Business as Owner/ Occupant as well. Perfect for Law Office, Optometry , Chiropractor Clinic, Physical Therapy Clinic, Art Studio/ Gallery, Yoga Studio, Therapy, Counseling, Dry Cleaner, Laundromat, To Go Deli, light retail, small cafe / bakery / sandwich shop, Boutique, Store front. Value Add opportunity with improvements. Buyer to verify all dimensions.
Key facts
- 6,000 sq ft lot
- Built 1935
- Listed 127 days
Neighborhood map
What this means for you Summary
Snapshot
- This is a other listed at $299k.
Deal economics
- At list price, monthly cash flow is $-595 ($-7k/yr) — negative.
- To cash-flow at today's rent, offer at most $214k (28.5% below list).
- To meet the 1% rule (rent ≥ 1% of price), the offer needs to be $252k (15.8% below list).
- Recommended offer: $214k (28.5% below list) — sets the bar for cash-flow.
- Cap rate 3.9% vs local median 3.2% in Houston — meaningfully above typical; check what's discounted (condition, days-on-market, listing class) to confirm the premium yield is real.
Location & tenants
- Location reads 74/100 on livability (#184 in TX, #4,771 nationally) — a middle-class / working-renter tenant base. Strengths: amenities A+, cost of living A+, housing A+; Watch: schools D, crime F.
- Houston ISD (urban): math 27% / reading 35% proficiency, ranked #593 of 826 in TX (top 72%) — families likely to look elsewhere, expect single-tenant / working-renter base with shorter leases; 71% free/reduced lunch — lower-income household profile, screen leases tightly.
- Market conditions: Rents soft (-2.9%/yr); 161 active listings in the ZIP; 21 comparable units currently listed for rent nearby; rentals leasing fast (median 8d on market — plan ~1-2 weeks tenant-placement turnaround); 29,883 units permitted in Harris County in 2024 (8,621 in 5+ unit buildings).
- At $2,517/mo this rent would consume 60% of the median local household income ($50k/yr) (locally 655% of renters already pay >50% of income on rent) — very limited rent-growth headroom before tenants either downsize or default.
Forward outlook
- In year one you build about $32k of equity ($2k loan paydown + $30k appreciation (10.0% local appreciation)).
- Harris County population projected at +47% by 2050 — long-run rental-demand tailwind backs the buy-and-hold thesis.
- By year 2, paydown + projected appreciation supports a ~$51k cash-out refi (75% LTV) — recoverable capital for the next deal without selling this one.
Negotiation context
- It's been on market 128 days — a 12% lower offer ($263k) is reasonable based on typical stale-listing flexibility.
- 7 sale attempts since 20y ago; this cycle's ask is 17488% above the opening price — seller raised mid-cycle; expect resistance to lowballs.
- Current owner paid $88k; list at $299k implies a 240% gain — meaningful room to come down on a strong offer.
Risks & watch-outs
- Watch-outs: property tax is 3.6% of price; built in 1935 — expect roof / HVAC / electrical / plumbing capex.
- Climate carrying-cost: severe wind risk, 99% chance of damaging wind over 30y; extreme-heat days projected 7→24/yr by 2055 (HVAC capex compounding) — expect insurance premiums to compound above CPI over the hold.
Questions for the listing agent
- What do current leases actually rent for vs. the listed asking? Can we see a recent rent roll and the last 12 months of T-12 income?
- It's been on market 128 days. Have you received any prior offers? Is the seller open to a 29% concession, seller financing, or rate buy-down credit?
- Built in 1935 — when were the roof, HVAC, electrical panel, plumbing, and water heater last replaced?
- Property tax is high relative to price — has the assessment been appealed recently, and will the sale trigger a re-assessment?
- Why hasn't it sold? Are there any deal-killer items the seller is aware of (foundation, flood, title, zoning, code violations)?
- Is there a deadline driving the sale (1031 exchange, divorce, estate, relocation)? That informs how much negotiation room exists.
- Schools are D-rated, which usually means shorter tenancies and higher turnover. Who's the typical renter profile here, and what's been the actual vacancy rate?
- Crime grade is F in this area — have there been break-ins, vandalism, or insurance claims at this property in the last 3 years? What carrier currently insures it and at what premium?
- The area grade is low — what's the realistic commute time and amenity access for the typical tenant pool here? Any planned neighborhood developments (good or bad) we should know about?
- What's the average days-on-market for RENTAL listings here right now (not sales)? A rising rental-DOM trend means longer vacancies and softer asking-rent achievability than the comps imply.
- What's the recent tenant-quality profile in this submarket — average credit score on applications, eviction rate, late-payment / NSF rate, and stable-employment percentage? A property-management company in the area should have these aggregated.
- How much new for-sale + rental construction is in the pipeline within 1–3 miles? Heavy new supply typically softens prices + rents 12–24 months out; constrained supply supports both.
Investment metrics
- 1% rule
- 0.84% ✗
- Cap rate
- 3.91%
- Cash-on-cash
- -8.52%
- DSCR
- 0.62
- GRM
- 9.9
CMA / ARV
- ARV (median comp)
- $415,481
- List price
- $299,000
- Delta
- -28.04%
- Verdict
- UNDERPRICED
- Comps
- 20 within 1.0 mi
Projected returns pro-forma
10.0% appreciation · 0.0% rent growth · sell at horizon
- IRR
- 17.4%
- Equity multiple
- 2.41×
- Total profit
- $117,954
- Equity at exit
- $269,363
- IRR
- 15.7%
- Equity multiple
- 5.36×
- Total profit
- $364,633
- Equity at exit
- $580,891
Cash invested: $83,720 (down + closing). Projections, not guarantees.
Landlord ↔ Tenant lean methodology
- Overall (STATE)
- 87 Strongly Landlord-Friendly
- State Texas
- 87 Strongly Landlord-Friendly · R+5
- County
- — inherits STATE
- City
- — inherits STATE
ZIP-level market 77011
- Home prices YoY
- 30.1%
- Rents YoY
- -2.9%
- Active inventory
- 161
- Price-to-rent
- 9.9×
Monthly cashflow live
- Estimated rent
- $2,517 high interval (Pro) →
- Mortgage (P&I)
- −$1,568
- Tax from tax record
- −$891 /mo · $10,687/yr
- Insurance
- −$125
- HOA
- −$0
- Vacancy / Maint / Mgmt
- −$529
- Net cashflow
- $-595
Break-even live
UW: 25.0% down · 7.5% · 30yr · 1.5% tax · 5.0% vac · 8.0% maint · 8.0% mgmt
Financing live
Cash to close
- Down payment
- $74,750
- Closing costs
- $8,970
- Reserves months
- —
- Total cash needed
- —
Loan-product check · same deal, 3 products live
Conventional
25% down · 7.5% · 30yr
- Down + closing
- —
- Monthly P&I
- —
- Monthly cashflow
- —
- DSCR
- —
- Eligible?
- —
Personal DTI + credit; lowest rate.
DSCR
20% down · 8.5% · 30yr
- Down + closing
- —
- Monthly P&I
- —
- Monthly cashflow
- —
- DSCR
- —
- Eligible?
- —
No personal income docs; deal must DSCR.
Hard money
10% down · 12.0% · 12mo
- Down + closing
- —
- Monthly P&I
- —
- Monthly cashflow
- —
- DSCR
- —
- Eligible?
- —
Short-term bridge; refi at stabilization.
Rent comps 21 comps
| Address | Beds | Baths | Sqft | Rent | $/sqft | DOM | Units | Dist |
|---|---|---|---|---|---|---|---|---|
| 2 Jenkins St Houston, TX | 3.0 | 2.0 | 1242 | $2,250 | $1.81 | 43d | 1 | 0.36mi |
| 207 Edgewood St Houston, TX | 3.0 | 4.0 | 2577 | $3,250 | $1.26 | 43d | 1 | 0.40mi |
| 5502 Texas St Unit 1514806P Houston, TX | 3.0 | 2.5 | 1808 | $7,216 | $3.99 | 7d | 1 | 0.53mi |
| 5504 Texas St Unit 1514810P Houston, TX | 3.0 | 2.5 | 1808 | $7,026 | $3.89 | 3d | 1 | 0.53mi |
| 4952 Polk St Unit 1531107P Houston, TX | 2.0 | 2.0 | 1980 | $2,327 | $1.18 | 7d | 1 | 0.56mi |
| 4001 Dallas St Unit 1029264P Houston, TX | 3.0 | 3.0 | 2174 | $5,077 | $2.34 | 5d | 1 | 0.65mi |
| 5121 Polk St Unit 1 Houston, TX | 2.0 | 1.0 | 1300 | $1,600 | $1.23 | 24d | 1 | 0.66mi |
| 3226 McKinney St Houston, TX | 3.0 | 3.0 | 2274 | $2,500 | $1.10 | 43d | 1 | 1.01mi |
| 6403 Avenue C Unit 1019625P Houston, TX | 2.0–8.0 | 1.0–4.0 | 1232 | $2,478 | $2.01 | 3d | 2 | 1.06mi |
| 2816 Rusk St Houston, TX | 3.0 | 3.5 | 2107 | $2,800 | $1.33 | 43d | 1 | 1.18mi |
| 3131 Leeland St Houston, TX | 3.0 | 3.5 | 1966 | $2,850 | $1.45 | 24d | 1 | 1.23mi |
| 800 Middle St Houston, TX | 1.0–4.0 | 1.0–2.0 | 1003 | $1,320 | $1.32 | 5d | 1 | 1.24mi |
| 3517 McIlhenny St Houston, TX | 3.0 | 3.5 | 2000 | $3,200 | $1.60 | 3d | 1 | 1.30mi |
| 2414 East Dr Unit Canal St unit Houston, TX | 3.0 | 3.5 | 2063 | $2,950 | $1.43 | 7d | 1 | 1.35mi |
| 2504 Rusk St Unit 1563174P Houston, TX | 2.0 | 2.0 | 1819 | $4,036 | $2.22 | 3d | 1 | 1.37mi |
| 1552 Lombardy St Houston, TX | 1.0 | 1.0 | 2528 | $1,150 | $0.45 | 43d | 1 | 1.39mi |
| 2404 Navigation Blvd Unit 424 Houston, TX | 2.0 | 2.0 | 1309 | $2,296 | $1.75 | 5d | 1 | 1.40mi |
| 2404 Navigation Blvd Unit 2187 Houston, TX | 2.0 | 2.0 | 1309 | $2,288 | $1.75 | 3d | 1 | 1.40mi |
| 2404 Navigation Blvd Unit 2441 Houston, TX | 2.0 | 2.0 | 1309 | $2,320 | $1.77 | 11d | 1 | 1.40mi |
| 2404 Navigation Blvd Unit 422 Houston, TX | 2.0 | 2.0 | 1309 | $2,296 | $1.75 | 7d | 1 | 1.40mi |
| 3309 Webster St Unit 1472545P Houston, TX | 3.0 | 2.0 | 1334 | $3,383 | $2.54 | 2d | 1 | 1.42mi |
Listing history 50 events
-
2026-06-18price $299,000 Active 128 DOM
-
2026-06-18days on market $309,000 Active 128 DOM
-
2026-06-17days on market $309,000 Active 127 DOM
-
2026-06-16days on market $309,000 Active 126 DOM
-
2026-06-15days on market $309,000 Active 125 DOM
-
2026-06-13days on market $309,000 Active 123 DOM
-
2026-06-10days on market $309,000 Active 119 DOM
-
2026-06-08days on market $309,000 Active 118 DOM
-
2026-06-07days on market $309,000 Active 117 DOM
-
2026-06-04days on market $309,000 Active 114 DOM
-
2026-06-01days on market $309,000 Active 111 DOM
-
2026-05-31days on market $309,000 Active 110 DOM
-
2026-03-31price $309,000 767-char remark
Show marketing remark (767 chars)
7,769 Cars Per Day on Lockwood. Own your own OFFICE/ studio/ boutique on a high traffic road by downtown. CASH-Flowing Commercial Investment Opportunity in rapidly developing East End /next to Hike and Bike Trail! Steps from Metro Rail!. NEW ROOF (2025) NEW WATER HEATER (2025) Office/ Retail/ Art Studio Duplex. +/- 2,000sf building with Suite A is CBD Store and Suite B is Available. Can be for your own Business as Owner/ Occupant as well. Perfect for Law Office, Optometry , Chiropractor Clinic, Physical Therapy Clinic, Art Studio/ Gallery, Yoga Studio, Therapy, Counseling, Dry Cleaner, Laundromat, To Go Deli, light retail, small cafe / bakery / sandwich shop, Boutique, Store front. Value Add opportunity with improvements. Buyer to verify all dimensions.
-
2026-03-31price $314,000 767-char remark
Show marketing remark (767 chars)
7,769 Cars Per Day on Lockwood. Own your own OFFICE/ studio/ boutique on a high traffic road by downtown. CASH-Flowing Commercial Investment Opportunity in rapidly developing East End /next to Hike and Bike Trail! Steps from Metro Rail!. NEW ROOF (2025) NEW WATER HEATER (2025) Office/ Retail/ Art Studio Duplex. +/- 2,000sf building with Suite A is CBD Store and Suite B is Available. Can be for your own Business as Owner/ Occupant as well. Perfect for Law Office, Optometry , Chiropractor Clinic, Physical Therapy Clinic, Art Studio/ Gallery, Yoga Studio, Therapy, Counseling, Dry Cleaner, Laundromat, To Go Deli, light retail, small cafe / bakery / sandwich shop, Boutique, Store front. Value Add opportunity with improvements. Buyer to verify all dimensions.
-
2026-03-18price $1,650
-
2026-03-17price $315,000 767-char remark
Show marketing remark (767 chars)
7,769 Cars Per Day on Lockwood. Own your own OFFICE/ studio/ boutique on a high traffic road by downtown. CASH-Flowing Commercial Investment Opportunity in rapidly developing East End /next to Hike and Bike Trail! Steps from Metro Rail!. NEW ROOF (2025) NEW WATER HEATER (2025) Office/ Retail/ Art Studio Duplex. +/- 2,000sf building with Suite A is CBD Store and Suite B is Available. Can be for your own Business as Owner/ Occupant as well. Perfect for Law Office, Optometry , Chiropractor Clinic, Physical Therapy Clinic, Art Studio/ Gallery, Yoga Studio, Therapy, Counseling, Dry Cleaner, Laundromat, To Go Deli, light retail, small cafe / bakery / sandwich shop, Boutique, Store front. Value Add opportunity with improvements. Buyer to verify all dimensions.
-
2026-02-14$1,700
-
2026-02-13price $325,000 767-char remark
Show marketing remark (767 chars)
7,769 Cars Per Day on Lockwood. Own your own OFFICE/ studio/ boutique on a high traffic road by downtown. CASH-Flowing Commercial Investment Opportunity in rapidly developing East End /next to Hike and Bike Trail! Steps from Metro Rail!. NEW ROOF (2025) NEW WATER HEATER (2025) Office/ Retail/ Art Studio Duplex. +/- 2,000sf building with Suite A is CBD Store and Suite B is Available. Can be for your own Business as Owner/ Occupant as well. Perfect for Law Office, Optometry , Chiropractor Clinic, Physical Therapy Clinic, Art Studio/ Gallery, Yoga Studio, Therapy, Counseling, Dry Cleaner, Laundromat, To Go Deli, light retail, small cafe / bakery / sandwich shop, Boutique, Store front. Value Add opportunity with improvements. Buyer to verify all dimensions.
-
2026-02-12price $340,000 767-char remark
Show marketing remark (767 chars)
7,769 Cars Per Day on Lockwood. Own your own OFFICE/ studio/ boutique on a high traffic road by downtown. CASH-Flowing Commercial Investment Opportunity in rapidly developing East End /next to Hike and Bike Trail! Steps from Metro Rail!. NEW ROOF (2025) NEW WATER HEATER (2025) Office/ Retail/ Art Studio Duplex. +/- 2,000sf building with Suite A is CBD Store and Suite B is Available. Can be for your own Business as Owner/ Occupant as well. Perfect for Law Office, Optometry , Chiropractor Clinic, Physical Therapy Clinic, Art Studio/ Gallery, Yoga Studio, Therapy, Counseling, Dry Cleaner, Laundromat, To Go Deli, light retail, small cafe / bakery / sandwich shop, Boutique, Store front. Value Add opportunity with improvements. Buyer to verify all dimensions.
-
2026-02-10$345,000 Active 767-char remark
Show marketing remark (767 chars)
7,769 Cars Per Day on Lockwood. Own your own OFFICE/ studio/ boutique on a high traffic road by downtown. CASH-Flowing Commercial Investment Opportunity in rapidly developing East End /next to Hike and Bike Trail! Steps from Metro Rail!. NEW ROOF (2025) NEW WATER HEATER (2025) Office/ Retail/ Art Studio Duplex. +/- 2,000sf building with Suite A is CBD Store and Suite B is Available. Can be for your own Business as Owner/ Occupant as well. Perfect for Law Office, Optometry , Chiropractor Clinic, Physical Therapy Clinic, Art Studio/ Gallery, Yoga Studio, Therapy, Counseling, Dry Cleaner, Laundromat, To Go Deli, light retail, small cafe / bakery / sandwich shop, Boutique, Store front. Value Add opportunity with improvements. Buyer to verify all dimensions.
-
2025-12-09historical
-
2025-12-03price $335,000
-
2025-12-01price $345,000
-
2025-11-09price $355,000
-
2025-07-24price $315,000
-
2025-06-04price $325,000
-
2025-06-02price $350,000
-
2025-05-31$375,000 Active
-
2025-05-31historical
-
2025-04-18price $375,000
-
2025-04-17price $355,000
-
2025-03-27price $335,000
-
2025-03-25price $345,000
-
2025-03-19price $349,000
-
2025-03-18price $389,000
-
2025-03-18price $393,000
-
2025-03-12price $395,000
-
2025-03-12price $399,000
-
2025-03-08price $402,000
-
2025-02-28price $403,000
-
2025-02-08price $404,000
-
2025-01-24price $405,000
-
2025-01-10price $405,500
-
2024-12-17price $410,000
-
2024-12-14price $425,000
-
2024-12-14price $450,000
-
2024-12-13$475,000 Active
-
2021-07-30soldstatus Sold
-
2021-07-28soldstatus
-
2021-05-20status Pending
ⓘ Source: listings_history table (triggers on properties + properties_extension) + one-shot
backfill from property_details.listing_events for pre-trigger history.
Tax reassessment forecast TX · Resets to sale price
- Current annual tax
- $10,687 · $891/mo
- Projected year-2 tax
- $10,687 · $891/mo
- Expected delta
- $0/yr ($0/mo · 0.0%)
ⓘ Screening estimate from a state-policy table — verify with the county assessor before closing.
Climate risk First Street
- Flood 4/10 Moderate FEMA zone X (unshaded) · 22% chance over 30 yrs
- Wildfire 1/10 Low
- Heat 9/10 Extreme 7 d/yr ≥109°F today · 24 d/yr by 30 yrs out
- Wind 9/10 Extreme 99% chance of damaging wind over 30 yrs
- Air quality 2/10 Low 2 unhealthy d/yr today · 2 by 30 yrs out
Nearby sold comps map
Loading sold comps map…
Walkable amenities ~0.75 mi
Loading nearby amenities…
Taxation est. · year 1
- Rental income
- $30,206
- − Mortgage interest
- −$16,749
- − Property taxes
- −$10,687
- − Insurance
- −$1,495
- − Repairs & maintenance
- −$2,417
- − Management
- −$2,417
- − Depreciation
- −$8,698
- Taxable loss
- −$12,255
- Est. tax savings @ 24.0%
- +$2,941
- After-tax cash flow
- $-4,193/yr
For passive investors: Depreciation is non-cash, so a rental often shows a tax loss while cash-flowing — sheltering income. Rental losses are passive: they offset passive income freely, and up to $25,000/yr can offset ordinary (W-2) income if you actively participate and your MAGI is under $100k (phasing out to $0 by $150k); unused losses carry forward. On sale, claimed depreciation is recaptured at up to 25%, and gains may owe capital-gains tax (a 1031 exchange can defer both). Figures are a year-1 estimate at your 24.0% rate — not tax advice; consult a CPA.
Schools (NCES district)
- District
- Houston ISD
- NCES district ID
- 4823640
- Math proficiency
- 27% ▼ -18.00%
- Reading proficiency
- 35% ▼ -6.00%
- Median HH income
- $46,054
- Composite
- 26.63/100
- National rank
- #7173
- State rank
- #593 of 826 in TX
Livability — Houston
- Score
- 74/100
- State rank
- #184
- US rank
- #4771
Category grades
Schools grade is shown separately in the Schools card above.
Census & demographics
- Census place
- Houston, TX
- County
- Harris County · 4,702,590 people
- City population
- 3,226,434
- Metro
- Houston-The Woodlands-Sugar Land, TX
- Population (ZIP)
- 14,940
- Household income
- $50,133
- Rent vs Own
- Severe rent burden
- 655.0
Population outlook (Harris County) Hauer SSP2
- Today (2025)
- 5,571,493 people
- By 2030
- 6,089,821 · +9.3%
- By 2040
- 7,142,806 · +28.2%
- By 2050
- 8,185,864 · +46.9%
- By 2075
- 10,574,329 · +89.8%
- By 2100
- 12,109,958 · +117.4%
Race, ethnicity, and origin ACS 2023
- Neighborhood character
- Predominantly Hispanic (88%)
- Race & ethnicity
- Hispanic / Latino 88% Two or more races 29% White 7% Black 3%
- Hispanic origin (detail)
- Mexican 81%
- Foreign-born
- 33% · Canada
- Languages at home
- 24% English-only · Spanish 76%
Political lean MEDSL · Harris
- 2024 margin
- Lean D (+5.5) · D 52.0% · R 46.4% · Other 1.6%
- 2008→2024 swing
- +3.9pp toward D · 2008: 1.6pp · 2024: 5.5pp
- All cycles
- 2024: D+5.5 2020: D+13.3 2016: D+12.4 2012: D+0.1 2008: D+1.6
Not yet ingested
- Civics
- —
Market trends
- HPI YoY
- ▲ 68.18%
- Current HPI
- 295.1198
- Rent YoY
- ▼ -2.93%
- Metro
- Houston-The Woodlands-Sugar Land, TX
- State GDP YoY
- ▲ 3.95%
- F500 in state
- 110
Industry mix (Fortune 500 HQ in TX)
| Industry | F500 HQs | Revenue |
|---|---|---|
| Energy | 16 | $1,198B |
|
||
| Technology | 5 | $198B |
|
||
| Engineering / Construction | 4 | $72B |
|
||
| Energy Services | 3 | $60B |
|
||
| Utilities | 3 | $41B |
|
||
| Healthcare | 2 | $330B |
|
||
Price history
+251.1% since first listed49 events — show timeline
- 2026-03-31 Price Changed $309,000 HARMLS
- 2026-03-31 Price Changed $314,000 HARMLS
- 2026-03-18 Price Changed $1,650 HARMLS
- 2026-03-17 Price Changed $315,000 HARMLS
- 2026-02-14 Listed for Rent $1,700 HARMLS
- 2026-02-13 Price Changed $325,000 HARMLS
- 2026-02-12 Price Changed $340,000 HARMLS
- 2026-02-10 Listed $345,000 HARMLS
- 2025-12-09 Listing Removed — HARMLS
- 2025-12-03 Price Changed $335,000 HARMLS
- 2025-12-01 Price Changed $345,000 HARMLS
- 2025-11-09 Price Changed $355,000 HARMLS
- 2025-07-24 Price Changed $315,000 HARMLS
- 2025-06-04 Price Changed $325,000 HARMLS
- 2025-06-02 Price Changed $350,000 HARMLS
- 2025-05-31 Listing Removed — HARMLS
- 2025-05-31 Listed $375,000 HARMLS
- 2025-04-18 Price Changed $375,000 HARMLS
- 2025-04-17 Price Changed $355,000 HARMLS
- 2025-03-27 Price Changed $335,000 HARMLS
- 2025-03-25 Price Changed $345,000 HARMLS
- 2025-03-19 Price Changed $349,000 HARMLS
- 2025-03-18 Price Changed $389,000 HARMLS
- 2025-03-18 Price Changed $393,000 HARMLS
- 2025-03-12 Price Changed $395,000 HARMLS
- 2025-03-12 Price Changed $399,000 HARMLS
- 2025-03-08 Price Changed $402,000 HARMLS
- 2025-02-28 Price Changed $403,000 HARMLS
- 2025-02-08 Price Changed $404,000 HARMLS
- 2025-01-24 Price Changed $405,000 HARMLS
- 2025-01-10 Price Changed $405,500 HARMLS
- 2024-12-17 Price Changed $410,000 HARMLS
- 2024-12-14 Price Changed $425,000 HARMLS
- 2024-12-14 Price Changed $450,000 HARMLS
- 2024-12-13 Listed $475,000 HARMLS
- 2021-07-30 Sold (MLS) — HARMLS
- 2021-07-28 Sold (Public Records) — Public Records
- 2021-05-20 Pending — HARMLS
- 2021-02-23 Listed $240,000 HARMLS
- 2020-04-08 Listing Removed — HARMLS
- 2020-02-03 Price Changed $215,000 HARMLS
- 2019-12-22 Price Changed $235,000 HARMLS
- 2019-07-08 Listed $248,000 HARMLS
- 2009-02-05 Sold (Public Records) — Public Records
- 2007-02-25 Listing Removed — HARMLS
- 2006-08-30 Listed $138,000 HARMLS
- 2006-05-03 Sold (Public Records) $88,000 Public Records
- 1998-06-08 Sold (Public Records) — Public Records
- 1998-01-30 Sold (Public Records) — Public Records
Property tax history
+10.7%/yrLatest (2025): $10,687 · +10.6% YoY. Source: county tax records.
Cash-flow waterfall
monthlySold comps — $/sqft
last 12 mo · ≤1 miLoading sold comps…