 🏗️ New Construction
13038 Dianna Lee Dr · Barrett, TX
Flood risk No data
- FEMA flood zone
- —
- Chance of flooding over 30 yrs
- —
- Est. flood insurance / yr
- —
Fire risk No data
- Est. fire insurance / yr
- —
Heat risk No data
- Hot days now (above threshold)
- —
- Hot days in 30 yrs
- —
Wind risk No data
- Chance of severe wind over 30 yrs
- —
Air-quality risk No data
- Unhealthy air days now
- —
- Unhealthy air days in 30 yrs
- —
Risk factors via First Street. Map © Google.
Why this score? — see what drove the D grade
The composite is a weighted blend of 9 inputs, each scored 0–100. Each bar is that input's sub-score; the figure is the points it added to the 100-point composite (weight × sub-score).
- Cash flow +12.3/30.0
- ARV discount +7.5/15.0
- 1% rule +3.8/10.0
- Condition / age +3.8/5.0
- DSCR +3.6/10.0
- Schools +3.5/10.0
- Rent growth +2.9/5.0
- Livability +2.8/5.0
- Appreciation +0.0/10.0
$241,590
🖨 Deal sheet (PDF) 📄 Offer letter ✓ Due diligence
Listing remarks
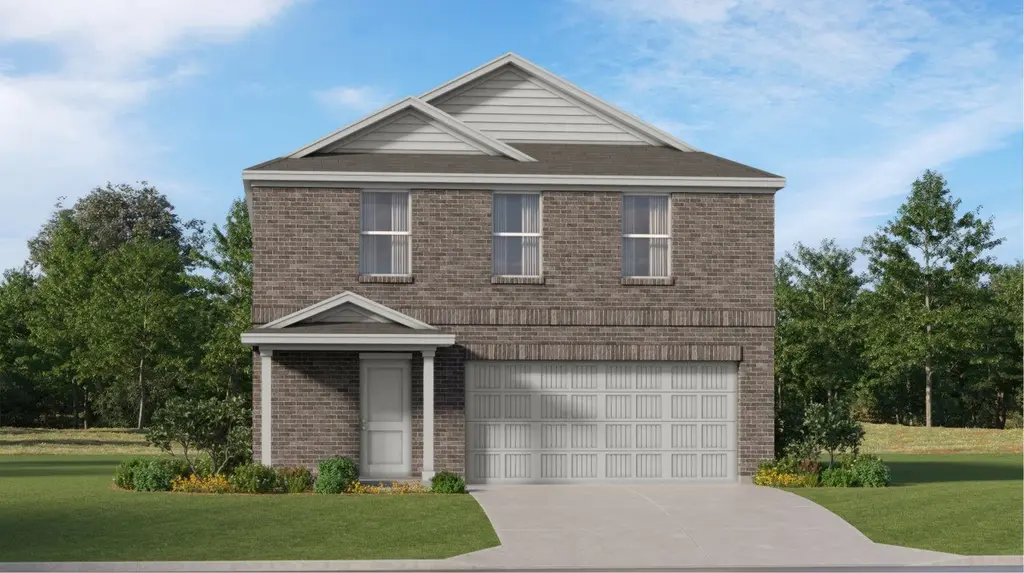
The Whitetail Floor Plan - The first floor of this two-story home shares a spacious open layout between the kitchen, dining room and family room for easy entertaining. Upstairs are three secondary bedrooms, ideal for residents and overnight guests, surrounding a versatile loft that serves as an additional shared living space. An owner's suite sprawls across the rear of the second floor and enjoys an en-suite bathroom and a walk-in closet. The completion date, prices and features may vary and are subject to change. Please verify with Lennar directly. Photos are for illustrative purposes only.
Key facts
- Walk-in closet
- Open layout
- En-suite bathroom
Tags
Property features AI
Finance
- Other: Association-maintained pool
- HOA & community: Association: Transerve Management Co, LP; Annual association fee of $600; Community amenities: Clubhouse, Fitness Center, Picnic Area, Park, Pool, Trails
Exterior
- Parking: Attached garage; 2 garage spaces
- Utilities: Public water; Public sewer
- Home design: Residential property; Under construction (new construction); Slab foundation
- Construction: Built in 2026; Brick and cement siding construction; Composition roof
- Exterior features: Back yard fence; Subdivision lot
Interior
- Kitchen: Dishwasher; Electric oven; Electric range; Gas oven; Gas range
- Bedrooms: Primary bedroom (Second floor); Bedroom (Second floor); Bedroom (Second floor); Bedroom (Second floor); Family room (First floor)
- Flooring: Carpet; Vinyl
- Bathrooms: 2 full bathrooms
- Heating & cooling: Central heating (Electric and Gas); Central air conditioning (Electric and Gas)
- Interior features: Breakfast bar; Kitchen and family room combo; Kitchen and dining combo; Separate shower; Tub with shower; Loft
- Laundry & utility: Washer hookup; Electric dryer hookup; Gas dryer hookup
Neighborhood map
What this means for you Summary
Snapshot
- This is a 4-bed/2.0-bath single-family listed at $242k. Condition is rated good.
Deal economics
- At list price, monthly cash flow is $-49 ($-593/yr) — negative.
- The deal already cash-flows at list — no discount required.
- To meet the 1% rule (rent ≥ 1% of price), the offer needs to be $229k (5.1% below list).
- Recommended offer: $229k (5.1% below list) — sets the bar for 1% rule.
Location & tenants
- Location reads 56/100 on livability (#1,335 in TX) — a working-class tenant base; expect higher turnover. Strengths: cost of living A+, housing A-, crime B+; Watch: employment D, amenities F, commute F.
- Crosby ISD (rural): math 39% / reading 40% proficiency, ranked #369 of 826 in TX (top 45%) — families likely to look elsewhere, expect single-tenant / working-renter base with shorter leases.
- Zoned schools: Crosby Middle (math 36% / reading 37%, grade F, #786 of 1,662 statewide, top 48%, 1,549 students, 60% FRL); Highpoint School East (Crosby) (20 students, 80% FRL) — zoned schools average 70% FRL vs 50% district-wide (20 pts higher); higher-poverty schools than district average — tighter screening recommended.
- Market conditions: Rents rising (+1.5%/yr); 1189 active listings in the ZIP; solid renter incomes; 29,883 units permitted in Harris County in 2024 (8,621 in 5+ unit buildings).
Forward outlook
- Local home prices are declining (-3.0%/yr); year-one equity from $2k of loan paydown is wiped out by about $8k of value loss. Plan a longer hold.
- Harris County population projected at +47% by 2050 — long-run rental-demand tailwind backs the buy-and-hold thesis.
Negotiation context
- It's been on market 41 days — a 3% lower offer ($234k) is reasonable based on typical stale-listing flexibility.
Questions for the listing agent
- What do current leases actually rent for vs. the listed asking? Can we see a recent rent roll and the last 12 months of T-12 income?
- It's been on market 41 days. Have you received any prior offers? Is the seller open to a 5% concession, seller financing, or rate buy-down credit?
- What does the HOA fee cover, when was the last increase, and are there any pending special assessments or reserve-fund shortfalls?
- Is there a deadline driving the sale (1031 exchange, divorce, estate, relocation)? That informs how much negotiation room exists.
- Schools are F-rated, which usually means shorter tenancies and higher turnover. Who's the typical renter profile here, and what's been the actual vacancy rate?
- The area grade is low — what's the realistic commute time and amenity access for the typical tenant pool here? Any planned neighborhood developments (good or bad) we should know about?
- What's the average days-on-market for RENTAL listings here right now (not sales)? A rising rental-DOM trend means longer vacancies and softer asking-rent achievability than the comps imply.
- What's the recent tenant-quality profile in this submarket — average credit score on applications, eviction rate, late-payment / NSF rate, and stable-employment percentage? A property-management company in the area should have these aggregated.
- How much new for-sale + rental construction is in the pipeline within 1–3 miles? Heavy new supply typically softens prices + rents 12–24 months out; constrained supply supports both.
Investment metrics
- 1% rule
- 0.88% ✗
- Cap rate
- 6.07%
- Cash-on-cash
- -0.81%
- DSCR
- 0.96
- GRM
- 9.5
CMA / ARV
- ARV (median comp)
- $261,990
- List price
- $241,590
- Delta
- -7.79%
- Verdict
- FAIR
- Comps
- 20 within 1.0 mi
Show comp detail 12 sales within ~0.75 mi
| Address | Dist | Beds/Ba | Sqft | Sold | Price | $/sf | Match |
|---|---|---|---|---|---|---|---|
| 13046 Dianna Lee Dr | 0.01mi | 4/2.0 | 1,979 (0%) | 1mo | $233,490 | $118 | 99 |
| 13007 Dianna Lee Ln | 0.06mi | 4/2.5 | 1,979 (0%) | 1mo | $282,990 | $143 | 94 |
| 12919 Dianna Lee Dr | 0.07mi | 4/2.5 | 1,979 (0%) | 1mo | $280,490 | $142 | 94 |
| 12942 Dianna Lee Ln | 0.06mi | 4/2.5 | 1,979 (0%) | 2mo | $285,990 | $145 | 94 |
| 12746 Oat Grass Dr | 0.28mi | 4/2.5 | 1,922 (-3%) | 2mo | $302,990 | $158 | 79 |
| 1338 Sea Oats Dr | 0.30mi | 4/2.5 | 1,922 (-3%) | 2mo | $306,990 | $160 | 78 |
| 1331 Sea Oats Dr | 0.30mi | 4/2.5 | 1,922 (-3%) | 2mo | $304,990 | $159 | 77 |
| 12734 Oat Grass Dr | 0.30mi | 4/2.5 | 1,922 (-3%) | 2mo | $307,990 | $160 | 77 |
| 1223 Bonnerjee Dr | 0.46mi | 4/2.0 | 1,859 (-6%) | 1mo | $292,990 | $158 | 68 |
| 1339 Sea Oats Dr | 0.29mi | 4/3.0 | 2,157 (+9%) | 1mo | $316,990 | $147 | 67 |
| 1226 Bonnerjee Dr | 0.46mi | 3/2.0 (-1) | 1,904 (-4%) | 1mo | $301,990 | $159 | 66 |
| 1218 Bonnerjee Dr | 0.47mi | 3/2.0 (-1) | 1,904 (-4%) | 1mo | $272,040 | $143 | 66 |
Match score weights: distance 35% · size 25% · config 20% · recency 20%. Top-matched comps best support the ARV.
Projected returns pro-forma
-3.0% appreciation · 1.48% rent growth · sell at horizon
- IRR
- -19.4%
- Equity multiple
- 0.33×
- Total profit
- $-48,989
- Equity at exit
- $39,064
- IRR
- -15.6%
- Equity multiple
- 0.18×
- Total profit
- $-60,191
- Equity at exit
- $22,652
Cash invested: $73,357 (down + closing). Projections, not guarantees.
Landlord ↔ Tenant lean methodology
- Overall (STATE)
- 87 Strongly Landlord-Friendly
- State Texas
- 87 Strongly Landlord-Friendly · R+5
- County
- — inherits STATE
- City
- — inherits STATE
ZIP-level market 77532
- Home prices YoY
- -28.6%
- Rents YoY
- 1.5%
- Active inventory
- 1189
- Price-to-rent
- 8.8×
Monthly cashflow live
- Estimated rent
- $2,293 medium interval (Pro) →
- Mortgage (P&I)
- −$1,374
- Tax est. 1.5%
- −$327 /mo · $3,930/yr
- Insurance
- −$109
- HOA
- −$50
- Vacancy / Maint / Mgmt
- −$481
- Net cashflow
- $-49
Break-even live
Sensitivity live
| Price | -10% $132 | -5% $41 | +0% $-49 | +5% $-140 | +10% $-230 |
|---|---|---|---|---|---|
| Rent | -10% $-231 | -5% $-140 | +0% $-49 | +5% $41 | +10% $132 |
| Rate | -1.0pp $83 | -0.5pp $17 | base $-49 | +0.5pp $-117 | +1.0pp $-186 |
UW: 25.0% down · 7.5% · 30yr · 1.5% tax · 5.0% vac · 8.0% maint · 8.0% mgmt
Financing live
Cash to close
- Down payment
- $65,498
- Closing costs
- $7,860
- Reserves months
- —
- Total cash needed
- —
Loan-product check · same deal, 3 products live
Conventional
25% down · 7.5% · 30yr
- Down + closing
- —
- Monthly P&I
- —
- Monthly cashflow
- —
- DSCR
- —
- Eligible?
- —
Personal DTI + credit; lowest rate.
DSCR
20% down · 8.5% · 30yr
- Down + closing
- —
- Monthly P&I
- —
- Monthly cashflow
- —
- DSCR
- —
- Eligible?
- —
No personal income docs; deal must DSCR.
Hard money
10% down · 12.0% · 12mo
- Down + closing
- —
- Monthly P&I
- —
- Monthly cashflow
- —
- DSCR
- —
- Eligible?
- —
Short-term bridge; refi at stabilization.
HOA detail
- Monthly dues
- $50 · $600/yr
Listing history 16 events
-
2026-06-15status $241,590 Pending 41 DOM
-
2026-06-15days on market $241,590 Active 41 DOM
-
2026-06-13days on market $241,590 Active 39 DOM
-
2026-06-09days on market $241,590 Active 35 DOM
-
2026-06-08days on market $241,590 Active 34 DOM
-
2026-06-07days on market $241,590 Active 33 DOM
-
2026-06-04days on market $241,590 Active 30 DOM
-
2026-06-03days on market $241,590 Active 29 DOM
-
2026-06-02days on market $241,590 Active 28 DOM
-
2026-06-01days on market $241,590 Active 27 DOM
-
2026-05-31days on market $241,590 Active 26 DOM
-
2026-05-12price $268,190 415-char remark
-
2026-05-11price $268,190 598-char remark
-
2026-05-10price $260,040 415-char remark
-
2026-05-05$247,990 Active 415-char remark
-
2026-05-05$247,990 Active 598-char remark
ⓘ Source: listings_history table (triggers on properties + properties_extension) + one-shot
backfill from property_details.listing_events for pre-trigger history.
Nearby sold comps map
Loading sold comps map…
Walkable amenities ~0.75 mi
Loading nearby amenities…
Taxation est. · year 1
- Rental income
- $27,511
- − Mortgage interest
- −$14,676
- − Property taxes
- −$3,930
- − Insurance
- −$1,310
- − Repairs & maintenance
- −$2,201
- − Management
- −$2,201
- − HOA
- −$600
- − Depreciation
- −$7,622
- Taxable loss
- −$5,027
- Est. tax savings @ 24.0%
- +$1,207
- After-tax cash flow
- $614/yr
For passive investors: Depreciation is non-cash, so a rental often shows a tax loss while cash-flowing — sheltering income. Rental losses are passive: they offset passive income freely, and up to $25,000/yr can offset ordinary (W-2) income if you actively participate and your MAGI is under $100k (phasing out to $0 by $150k); unused losses carry forward. On sale, claimed depreciation is recaptured at up to 25%, and gains may owe capital-gains tax (a 1031 exchange can defer both). Figures are a year-1 estimate at your 24.0% rate — not tax advice; consult a CPA.
Condition & rehab AI · 1 photo
This two-story home presents as move-in ready with a good condition score and minimal maintenance required. Fresh paint and clean gutters can significantly enhance its curb appeal and value.
Value-add opportunities
- Both Paint exterior siding — Fresh paint enhances curb appeal and can increase both resale and rental value.
- Both Clean and maintain gutters — Clean gutters prevent water damage and improve the home's appearance, boosting both resale and rental value.
Renovation cost estimate screening
Value-add ROI direction
- Both Paint exterior siding — Fresh paint enhances curb appeal and can increase both resale and rental value. ↑
- Both Clean and maintain gutters — Clean gutters prevent water damage and improve the home's appearance, boosting both resale and rental value. ↑
ⓘ Cost ranges are severity-bucket heuristics (US national rule-of-thumb). Get contractor quotes + a written scope before underwriting a rehab budget.
Schools (NCES district)
- District
- Crosby ISD
- NCES district ID
- 4815750
- Math proficiency
- 39% ▼ -13.00%
- Reading proficiency
- 40% ▼ -5.00%
- Median HH income
- $61,079
- Composite
- 35.14/100
- National rank
- #5012
- State rank
- #369 of 826 in TX
Livability — Barrett
- Score
- 56/100
- State rank
- #1335
- US rank
- #22991
Category grades
Schools grade is shown separately in the Schools card above.
Census & demographics
- Census place
- Barrett, TX
- County
- Harris County · 4,702,590 people
- Metro
- Houston-The Woodlands-Sugar Land, TX
- Population (ZIP)
- 33,780
- Household income
- $92,201
- Rent vs Own
- Severe rent burden
- 382.0
Population outlook (Harris County) Hauer SSP2
- Today (2025)
- 5,571,493 people
- By 2030
- 6,089,821 · +9.3%
- By 2040
- 7,142,806 · +28.2%
- By 2050
- 8,185,864 · +46.9%
- By 2075
- 10,574,329 · +89.8%
- By 2100
- 12,109,958 · +117.4%
Race, ethnicity, and origin ACS 2023
- Neighborhood character
- Diverse neighborhood (Simpson 0.60)
- Race & ethnicity
- White 54% Hispanic / Latino 31% Two or more races 16% Black 9%
- Hispanic origin (detail)
- Mexican 24%
- Common ancestry
- Lithuanian 4% Romanian 3% Italian 2%
- Foreign-born
- 10% · Canada
- Languages at home
- 78% English-only · Spanish 21%
Political lean MEDSL · Harris
- 2024 margin
- Lean D (+5.5) · D 52.0% · R 46.4% · Other 1.6%
- 2008→2024 swing
- +3.9pp toward D · 2008: 1.6pp · 2024: 5.5pp
- All cycles
- 2024: D+5.5 2020: D+13.3 2016: D+12.4 2012: D+0.1 2008: D+1.6
Not yet ingested
- Civics
- —
Market trends
- HPI YoY
- ▼ -105.63%
- Current HPI
- 264.0126
- Rent YoY
- ▲ 1.48%
- Metro
- Houston-The Woodlands-Sugar Land, TX
- State GDP YoY
- ▲ 3.95%
- F500 in state
- 110
Industry mix (Fortune 500 HQ in TX)
| Industry | F500 HQs | Revenue |
|---|---|---|
| Energy | 16 | $1,198B |
|
||
| Technology | 5 | $198B |
|
||
| Engineering / Construction | 4 | $72B |
|
||
| Energy Services | 3 | $60B |
|
||
| Utilities | 3 | $41B |
|
||
| Healthcare | 2 | $330B |
|
||
Price history
-2.6% since first listed6 events — show timeline
- 2026-06-15 Pending — HARMLS
- 2026-05-29 Price Changed $241,590 HARMLS
- 2026-05-26 Price Changed $249,990 HARMLS
- 2026-05-26 Price Changed $255,990 HARMLS
- 2026-05-11 Price Changed $268,190 HARMLS
- 2026-05-05 Listed $247,990 HARMLS
Cash-flow waterfall
monthlySold comps — $/sqft
last 12 mo · ≤1 miLoading sold comps…