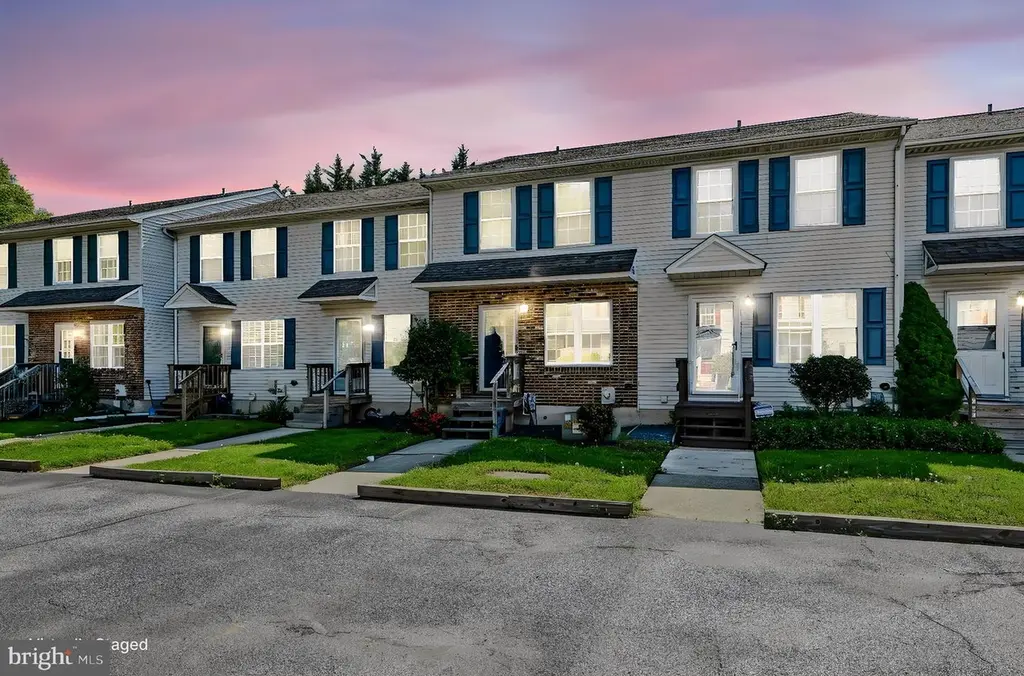
126 Cobble Creek Curv #126 · Glasgow, DE
Flood risk 1/10 · Minimal
- FEMA flood zone
- X (unshaded)
- Chance of flooding over 30 yrs
- 0.0%
- Est. flood insurance / yr
- $507 – $1,088
Fire risk 1/10 · Minimal
- Est. fire insurance / yr
- $476 – $884
Heat risk 7/10 · Major
- Hot days now (above 104°F)
- 7 days/yr
- Hot days in 30 yrs
- 15 days/yr
Wind risk 6/10 · Moderate
- Chance of severe wind over 30 yrs
- 27.0%
Air-quality risk 4/10 · Minor
- Unhealthy air days now
- 3 days/yr
- Unhealthy air days in 30 yrs
- 5 days/yr
Risk factors via First Street. Map © Google.
Why this score? — see what drove the C grade
The composite is a weighted blend of 9 inputs, each scored 0–100. Each bar is that input's sub-score; the figure is the points it added to the 100-point composite (weight × sub-score).
- Cash flow +18.8/30.0
- ARV discount +15.0/15.0
- 1% rule +6.1/10.0
- DSCR +5.9/10.0
- Livability +3.9/5.0
- Rent growth +3.0/5.0
- Condition / age +2.8/5.0
- Schools +2.5/10.0
- Appreciation +0.0/10.0
$185,000
🖨 Deal sheet (PDF) 📄 Offer letter ✓ Due diligence
Listing remarks
Opportunity knocks at 126 Cobble Creek Curve #126 in the desirable Stones Throw community! This townhome offers incredible potential for buyers looking to build equity or investors seeking their next addition. Major systems have already been addressed, including a newer roof, HVAC (2022), water heater (2015), Roof(2020) and dishwasher (2020)—providing a strong foundation for your improvements. With a little vision and updates, this property can truly shine. Being sold as-is, this is an excellent opportunity for a handy homeowner ready to customize their space or for an investor looking to enhance and maximize value. Conveniently located near shopping, dining, and major routes, making
Key facts
- $150 HOA
- 2 parking spots
- Built 1988
Property features AI
Finance
- Other: Property manager present
- HOA & community: HOA fee of $150 monthly; HOA covers lawn care (front and rear), lawn maintenance, snow removal, and trash
Exterior
- Parking: Assigned parking; Asphalt driveway with two driveway spaces; Two total garage and parking spaces (two assigned)
- Utilities: Public water; Public sewer; Electric for heating, cooling, and hot water
- Home design: Interior townhouse/rowhouse; Fee simple ownership; Year built per assessor
- Construction: Brick, vinyl siding, and aluminum siding exterior; Shingle roof; Block foundation
- Exterior features: No tidal water; Lawn care and snow removal included in HOA (front and rear); Trash service included in HOA
Interior
- Kitchen: Eat-in kitchen
- Bedrooms: Two bedrooms on the first upper level
- Flooring: Carpet; Laminate
- Bathrooms: One full bathroom on the upper level; One half bathroom on the main level
- Heating & cooling: Heat pump heating; Central air conditioning; Electric hot water
- Interior features: Open floor plan; Eat-in kitchen; Dining area; Ceiling fans; Tub with shower; Drywall walls and ceilings; Full finished basement
- Laundry & utility: Laundry located in the basement
Neighborhood map
What this means for you Summary
Snapshot
- This is a 2-bed/1.5-bath townhouse listed at $185k. Condition is rated average.
Deal economics
- At list price, monthly cash flow is $187 ($2k/yr) — positive.
- The deal already cash-flows at list — no discount required.
- Meets the 1% rule at list price ($2k rent vs $185k).
- Cap rate 7.5% vs local median 3.5% in Glasgow — top-decile yield for the area; either an underpriced asset or a hidden risk that comps aren't pricing in. Stress-test before assuming the spread holds.
Location & tenants
- Location reads 77/100 on livability (#4 in DE, #3,151 nationally) — a middle-class / working-renter tenant base. Strengths: employment A+, housing A+, health & safety A+; Watch: amenities F, commute F.
- Christina School District (suburban): math 22% / reading 33% proficiency, ranked #18 of 26 in DE (top 69%) — low school quality limits family demand, transient renter base, plan for 1-2y turnover.
- Zoned schools: Brader (Henry M.) Elementary School (math 22% / reading 27%, grade F, #67 of 105 statewide, top 65%, 323 students, 0% FRL); Gauger-Cobbs Middle School (math 11% / reading 26%, grade F, #30 of 36 statewide, top 86%, 779 students, 0% FRL); Glasgow High School (math 8% / reading 17%, grade F, #36 of 40 statewide, top 90%, 895 students, 0% FRL) — zoned schools average 0% FRL vs 50% district-wide (50 pts lower); this property's tenant base skews higher-income than the district average.
- Market conditions: Rents rising (+2.2%/yr); 154 active listings in the ZIP; 8 comparable units currently listed for rent nearby; rentals lingering (median 45d on market — plan ~5-8 weeks vacancy on turnover, expect pricing pressure); 62% of comp listings sitting > 30 days — soft ceiling on asking rent; solid renter incomes; 1,367 units permitted in New Castle County in 2024 (201 in 5+ unit buildings).
Forward outlook
- Local home prices are declining (-3.0%/yr); year-one equity from $1k of loan paydown is wiped out by about $6k of value loss. Plan a longer hold.
- New Castle County population projected at +9% by 2050 — modest demand growth; plan on rents tracking national, not racing it.
Negotiation context
- Only 4 days on market — expect competitive offers; lowballing is unlikely to land.
Risks & watch-outs
- Climate carrying-cost: major wind risk, 27% chance of damaging wind over 30y; extreme-heat days projected 7→15/yr by 2055 (HVAC capex compounding) — expect insurance premiums to compound above CPI over the hold.
Questions for the listing agent
- What does the HOA fee cover, when was the last increase, and are there any pending special assessments or reserve-fund shortfalls?
- Is there a deadline driving the sale (1031 exchange, divorce, estate, relocation)? That informs how much negotiation room exists.
- What's the average days-on-market for RENTAL listings here right now (not sales)? A rising rental-DOM trend means longer vacancies and softer asking-rent achievability than the comps imply.
- What's the recent tenant-quality profile in this submarket — average credit score on applications, eviction rate, late-payment / NSF rate, and stable-employment percentage? A property-management company in the area should have these aggregated.
- How much new for-sale + rental construction is in the pipeline within 1–3 miles? Heavy new supply typically softens prices + rents 12–24 months out; constrained supply supports both.
Investment metrics
- 1% rule
- 1.11% ✓
- Cap rate
- 7.50%
- Cash-on-cash
- 4.32%
- DSCR
- 1.19
- GRM
- 7.5
CMA / ARV
- ARV (on-the-fly)
- $253,000
- Comps found
- 9
Show comp detail 9 sales within ~0.75 mi
| Address | Dist | Beds/Ba | Sqft | Sold | Price | $/sf | Match |
|---|---|---|---|---|---|---|---|
| 126 Cobble Creek Curv #126 | 0.00mi | 2/1.5 | 1,150 (0%) | 1mo | $185,000 | $161 | 100 |
| 809 Cobble Creek Curv #809 | 0.12mi | 2/1.5 | 1,152 (+0%) | 2mo | $255,000 | $221 | 93 |
| 208 Cobble Creek Curv | 0.09mi | 2/1.5 | 1,275 (+11%) | 7mo | $205,000 | $161 | 72 |
| 601 Waters Edge Dr | 0.35mi | 2/2.0 | 1,120 (-3%) | 10mo | $220,000 | $196 | 69 |
| 2009 Waters Edge Dr | 0.40mi | 3/2.0 (+1) | 1,120 (-3%) | 2mo | $259,816 | $232 | 69 |
| 806 Waters Edge Dr #187 | 0.32mi | 3/2.0 (+1) | 1,120 (-3%) | 6mo | $255,000 | $228 | 68 |
| 1907 Waters Edge Dr #128 | 0.41mi | 2/2.0 | 1,120 (-3%) | 9mo | $222,000 | $198 | 68 |
| 409 Waters Edge Dr | 0.35mi | 2/2.0 | 1,000 (-13%) | 23mo | $230,000 | $230 | 41 |
| 408 Waters Edge Dr #59 | 0.38mi | 2/2.0 | 1,000 (-13%) | 22mo | $220,000 | $220 | 40 |
Match score weights: distance 35% · size 25% · config 20% · recency 20%. Top-matched comps best support the ARV.
Projected returns pro-forma
-3.0% appreciation · 2.19% rent growth · sell at horizon
- IRR
- -10.5%
- Equity multiple
- 0.62×
- Total profit
- $-19,626
- Equity at exit
- $27,584
- IRR
- -2.4%
- Equity multiple
- 0.85×
- Total profit
- $-7,964
- Equity at exit
- $15,995
Cash invested: $51,800 (down + closing). Projections, not guarantees.
Landlord ↔ Tenant lean methodology
- Overall (STATE)
- 70 Landlord-Friendly
- State Delaware
- 70 Landlord-Friendly · D+7
- County
- — inherits STATE
- City
- — inherits STATE
ZIP-level market 19702
- Rents YoY
- 2.2%
- Active inventory
- 154
- Price-to-rent
- 7.5×
Monthly cashflow live
- Estimated rent
- $2,044 high interval (Pro) →
- Mortgage (P&I)
- −$970
- Tax est. 1.5%
- −$231 /mo · $2,775/yr
- Insurance
- −$77
- HOA
- −$150
- Vacancy / Maint / Mgmt
- −$429
- Net cashflow
- $187
Break-even live
Sensitivity live
| Price | -10% $314 | -5% $250 | +0% $187 | +5% $123 | +10% $59 |
|---|---|---|---|---|---|
| Rent | -10% $25 | -5% $106 | +0% $187 | +5% $267 | +10% $348 |
| Rate | -1.0pp $280 | -0.5pp $234 | base $187 | +0.5pp $139 | +1.0pp $90 |
UW: 25.0% down · 7.5% · 30yr · 1.5% tax · 5.0% vac · 8.0% maint · 8.0% mgmt
Financing live
Cash to close
- Down payment
- $46,250
- Closing costs
- $5,550
- Reserves months
- —
- Total cash needed
- —
Loan-product check · same deal, 3 products live
Conventional
25% down · 7.5% · 30yr
- Down + closing
- —
- Monthly P&I
- —
- Monthly cashflow
- —
- DSCR
- —
- Eligible?
- —
Personal DTI + credit; lowest rate.
DSCR
20% down · 8.5% · 30yr
- Down + closing
- —
- Monthly P&I
- —
- Monthly cashflow
- —
- DSCR
- —
- Eligible?
- —
No personal income docs; deal must DSCR.
Hard money
10% down · 12.0% · 12mo
- Down + closing
- —
- Monthly P&I
- —
- Monthly cashflow
- —
- DSCR
- —
- Eligible?
- —
Short-term bridge; refi at stabilization.
Rent comps 8 comps
| Address | Beds | Baths | Sqft | Rent | $/sqft | DOM | Units | Dist |
|---|---|---|---|---|---|---|---|---|
| 907 Cobble Creek Curv Newark, DE | 2.0 | 1.5 | 1325 | $2,000 | $1.51 | 45d | 1 | 0.08mi |
| 337 Cobble Creek Curv Newark, DE | 2.0 | 2.5 | 1325 | $2,500 | $1.89 | 26d | 1 | 0.11mi |
| 1907 Waters Edge Dr Newark, DE | 2.0 | 2.0 | 1120 | $1,795 | $1.60 | 45d | 1 | 0.40mi |
| 2702 Waters Edge Dr Newark, DE | 1.0 | 1.0 | 729 | $1,599 | $2.19 | 0d | 1 | 0.44mi |
| 222 Britain Ct Newark, DE | 2.0 | 2.5 | 1300 | $2,100 | $1.62 | 14d | 1 | 0.47mi |
| 27 Harkfort Rd Newark, DE | 3.0 | 1.5 | 1000 | $2,300 | $2.30 | 45d | 1 | 0.52mi |
| 84 Welsh Tract Rd #208 Newark, DE | 1.0 | 1.0 | 800 | $1,450 | $1.81 | 45d | 1 | 1.43mi |
| 200 Vinings Way Newark, DE | 1.0–3.0 | 1.0–2.0 | 907 | $1,690 | $1.86 | 45d | 1 | 1.48mi |
HOA detail
- Monthly dues
- $150 · $1,800/yr
- Likely covers
- water
Listing history 3 events
-
2026-05-03status Pending 853-char remark
-
2026-04-30$185,000 Active 853-char remark
-
2026-04-22historical $185,000 853-char remark
ⓘ Source: listings_history table (triggers on properties + properties_extension) + one-shot
backfill from property_details.listing_events for pre-trigger history.
Climate risk First Street
- Flood 1/10 Low FEMA zone X (unshaded) · 0% chance over 30 yrs
- Wildfire 1/10 Low
- Heat 7/10 Severe 7 d/yr ≥104°F today · 15 d/yr by 30 yrs out
- Wind 6/10 Major 27% chance of damaging wind over 30 yrs
- Air quality 4/10 Moderate 3 unhealthy d/yr today · 5 by 30 yrs out
Nearby sold comps map
Loading sold comps map…
Walkable amenities ~0.75 mi
Loading nearby amenities…
Taxation est. · year 1
- Rental income
- $24,532
- − Mortgage interest
- −$10,363
- − Property taxes
- −$2,775
- − Insurance
- −$925
- − Repairs & maintenance
- −$1,963
- − Management
- −$1,963
- − HOA
- −$1,800
- − Depreciation
- −$5,382
- Taxable loss
- −$638
- Est. tax savings @ 24.0%
- +$153
- After-tax cash flow
- $2,392/yr
For passive investors: Depreciation is non-cash, so a rental often shows a tax loss while cash-flowing — sheltering income. Rental losses are passive: they offset passive income freely, and up to $25,000/yr can offset ordinary (W-2) income if you actively participate and your MAGI is under $100k (phasing out to $0 by $150k); unused losses carry forward. On sale, claimed depreciation is recaptured at up to 25%, and gains may owe capital-gains tax (a 1031 exchange can defer both). Figures are a year-1 estimate at your 24.0% rate — not tax advice; consult a CPA.
Condition & rehab AI · 12 photos
This townhome has good systems and a solid structure, but needs moderate updates to the kitchen and bathroom to improve its resale and rental value.
Repairs flagged
- Moderate kitchen cabinets — dated and in need of updating
- Moderate kitchen appliances — outdated and in need of replacement
- Moderate bathroom vanity — basic and in need of updating
Value-add opportunities
- Both update kitchen cabinets and appliances — modernizing the kitchen would improve both resale and rental value
- Both update bathroom vanity and fixtures — modernizing the bathroom would improve both resale and rental value
Renovation cost estimate screening
| Repair item | Severity | Est. cost |
|---|---|---|
| kitchen cabinets · dated and in need of updating | Moderate | $3,000–15,000 |
| kitchen appliances · outdated and in need of replacement | Moderate | $3,000–15,000 |
| bathroom vanity · basic and in need of updating | Moderate | $3,000–15,000 |
| Total estimated repair cost · 3 items | $9,000–45,000 |
Value-add ROI direction
- Both update kitchen cabinets and appliances — modernizing the kitchen would improve both resale and rental value ↑
- Both update bathroom vanity and fixtures — modernizing the bathroom would improve both resale and rental value ↑
ⓘ Cost ranges are severity-bucket heuristics (US national rule-of-thumb). Get contractor quotes + a written scope before underwriting a rehab budget.
Schools (NCES district)
- District
- Christina School District
- NCES district ID
- 1000200
- Math proficiency
- 22% ▼ -12.00%
- Reading proficiency
- 33% ▼ -5.00%
- Median HH income
- $58,838
- Composite
- 24.93/100
- National rank
- #7567
- State rank
- #18 of 26 in DE
Livability — Glasgow
- Score
- 77/100
- State rank
- #4
- US rank
- #3151
Category grades
Schools grade is shown separately in the Schools card above.
Census & demographics
- County
- New Castle County · 483,412 people
- City population
- 56,049
- Metro
- Philadelphia-Camden-Wilmington, PA-NJ-DE-MD
- Population (ZIP)
- 55,683
- Household income
- $92,446
- Rent vs Own
- Severe rent burden
- 1421.0
Population outlook (New Castle County) Hauer SSP2
- Today (2025)
- 594,686 people
- By 2030
- 609,164 · +2.4%
- By 2040
- 632,154 · +6.3%
- By 2050
- 649,068 · +9.1%
- By 2075
- 687,771 · +15.7%
- By 2100
- 694,961 · +16.9%
Race, ethnicity, and origin ACS 2023
- Neighborhood character
- Highly diverse neighborhood (Simpson 0.73)
- Race & ethnicity
- White 38% Black 31% Hispanic / Latino 14% Asian 12% Two or more races 8%
- Hispanic origin (detail)
- Mexican 7% Puerto Rican 3%
- Common ancestry
- Romanian 3% Lithuanian 1% Slovak 1%
- Foreign-born
- 22% · Canada, China, South Korea
- Languages at home
- 73% English-only · Spanish 11% Other Indo-European 5% Other Asian/Pacific 3%
Political lean MEDSL · New Castle
- 2024 margin
- Solid D (+32.6) · D 65.5% · R 32.9% · Other 1.6%
- 2008→2024 swing
- -8.1pp toward R · 2008: 40.6pp · 2024: 32.6pp
- All cycles
- 2024: D+32.6 2020: D+37.1 2016: D+29.6 2012: D+34.1 2008: D+40.6
Not yet ingested
- Civics
- —
Market trends
- HPI YoY
- ▼ -241.79%
- Current HPI
- 248.8414
- Rent YoY
- ▲ 2.19%
- Metro
- Philadelphia-Camden-Wilmington, PA-NJ-DE-MD
- State GDP YoY
- —
- F500 in state
- 0
Price history
+0.0% since first listed4 events — show timeline
- 2026-06-03 Sold (MLS) $185,000 BRIGHT MLS
- 2026-05-03 Pending — BRIGHT MLS
- 2026-04-30 Listed $185,000 BRIGHT MLS
- 2026-04-22 Coming Soon $185,000 BRIGHT MLS
Cash-flow waterfall
monthlySold comps — $/sqft
last 12 mo · ≤1 miLoading sold comps…