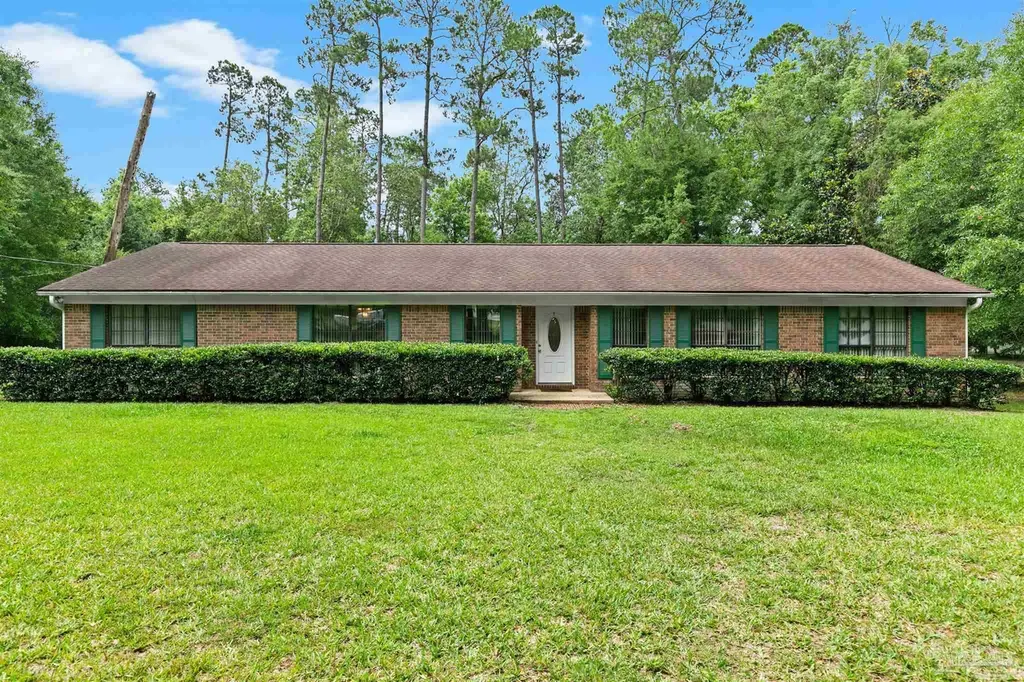
3507 Stoddard Rd · Ensley, FL
Flood risk 1/10 · Minimal
- FEMA flood zone
- X (unshaded)
- Chance of flooding over 30 yrs
- 0.0%
- Est. flood insurance / yr
- $507 – $1,088
Fire risk 4/10 · Minor
- Est. fire insurance / yr
- $947 – $1,759
Heat risk 10/10 · Severe
- Hot days now (above 105°F)
- 7 days/yr
- Hot days in 30 yrs
- 21 days/yr
Wind risk 9/10 · Severe
- Chance of severe wind over 30 yrs
- 99.0%
Air-quality risk 1/10 · Minimal
- Unhealthy air days now
- 0 days/yr
- Unhealthy air days in 30 yrs
- 0 days/yr
Risk factors via First Street. Map © Google.
Why this score? — see what drove the D+ grade
The composite is a weighted blend of 9 inputs, each scored 0–100. Each bar is that input's sub-score; the figure is the points it added to the 100-point composite (weight × sub-score).
- ARV discount +15.0/15.0
- Cash flow +12.8/30.0
- Livability +4.0/5.0
- DSCR +3.8/10.0
- Rent growth +3.6/5.0
- Schools +3.6/10.0
- 1% rule +2.5/10.0
- Condition / age +2.5/5.0
- Appreciation +0.0/10.0
$275,000
🖨 Deal sheet 📄 Offer letter ✓ Due diligence
Listing remarks
Tucked away at the end of a quiet dead-end road, this cozy 3-bedroom, 2-bath home offers the perfect blend of privacy, space, and convenience. Situated on over an acre, you'll enjoy a peaceful setting surrounded by nature while being just minutes from I-10, beautiful Gulf Coast beaches, NAS Pensacola, and Navy Federal Credit Union. Inside, the open-concept floor plan creates a welcoming atmosphere, with the living room, dining area, and kitchen flowing seamlessly together. An oversized wood-burning fireplace serves as the focal point of the home, adding warmth and character to the space. The spacious master suite features a large walk-in closet and plenty of room to create your own private
Key facts
- Private backyard
- Back deck
- Over an acre
Tags
Property features AI
Finance
- Other: Lot approximately 1 acre (dimensions ~161 x 271); Directions: Pine Forest Rd to West on Wild Lake Blvd to Left on Eight Mile Creek Rd to Right on Stoddard Rd. The home is on your left.
- HOA & community: No association
Exterior
- Parking: Attached 2-car garage; Rear entrance; Garage door opener; 2 covered parking spaces (2 total parking spaces)
- Security: Smoke detector(s)
- Utilities: Public sewer; Circuit breaker electric; Cable available
- Home design: One-story brick home; Resale property; Not attached to another property; Homestead eligible; Ridge vent (energy efficient)
- Construction: Brick construction; Slab foundation; Built as a single level
- Exterior features: Deck; Porch; Shingle roof; Public water; Central access to the lot; Paved, public maintained road
Interior
- Kitchen: Laminate counters; Dishwasher; Oven
- Bedrooms: Master bedroom on the first floor (approx. 20 x 20); Second bedroom on the first floor (approx. 15 x 15); Third bedroom on the first floor (approx. 12 x 16)
- Flooring: Vinyl; Carpet
- Bathrooms: 2 full bathrooms
- Heating & cooling: Central heating; Central air; Ceiling fans; Fireplace(s)
- Interior features: Storage; Baseboards; Bookcases; Ceiling fans; Chair rail; Crown molding; High speed internet; Blinds; Drapes
- Laundry & utility: Laundry inside with washer/dryer hookups; Electric water heater
Neighborhood map
What this means for you Summary
Snapshot
- This is a 3-bed/2.0-bath single-family listed at $275k.
Deal economics
- At list price, monthly cash flow is $-27 ($-329/yr) — negative.
- To cash-flow at today's rent, offer at most $270k (1.8% below list).
- To meet the 1% rule (rent ≥ 1% of price), the offer needs to be $206k (25.2% below list).
- Recommended offer: $206k (25.2% below list) — sets the bar for 1% rule.
- Cap rate 6.2% vs local median 4.7% in Ensley — top-decile yield for the area; either an underpriced asset or a hidden risk that comps aren't pricing in. Stress-test before assuming the spread holds.
Location & tenants
- Location reads 79/100 on livability (#133 in FL, #1,996 nationally) — a middle-class / working-renter tenant base. Strengths: cost of living A+, housing A+, health & safety A+; Watch: amenities D, employment D, schools F.
- Escambia (suburban): math 40% / reading 45% proficiency, ranked #56 of 73 in FL (top 77%) — families likely to look elsewhere, expect single-tenant / working-renter base with shorter leases.
- Market conditions: Rents rising fast (+4.4%/yr); 417 active listings in the ZIP; 4 comparable units currently listed for rent nearby; rentals at typical pace (median 24d on market — plan ~3-4 weeks tenant-placement turnaround); solid renter incomes; 1,479 units permitted in Escambia County in 2024 (0 in 5+ unit buildings).
- This rent runs 33% of the median local income ($75k/yr) — at the standard rent-burdened threshold; future hikes will face affordability resistance.
Forward outlook
- Local home prices are declining (-3.0%/yr); year-one equity from $2k of loan paydown is wiped out by about $8k of value loss. Plan a longer hold.
- Escambia County population projected at +13% by 2050 — modest demand growth; plan on rents tracking national, not racing it.
Negotiation context
- It's been on market 18 days — a 2% lower offer ($271k) is reasonable based on typical stale-listing flexibility.
Risks & watch-outs
- Climate carrying-cost: severe wind risk, 99% chance of damaging wind over 30y; extreme-heat days projected 7→21/yr by 2055 (HVAC capex compounding) — expect insurance premiums to compound above CPI over the hold.
Questions for the listing agent
- What do current leases actually rent for vs. the listed asking? Can we see a recent rent roll and the last 12 months of T-12 income?
- Is there a deadline driving the sale (1031 exchange, divorce, estate, relocation)? That informs how much negotiation room exists.
- Schools are F-rated, which usually means shorter tenancies and higher turnover. Who's the typical renter profile here, and what's been the actual vacancy rate?
- The area grade is low — what's the realistic commute time and amenity access for the typical tenant pool here? Any planned neighborhood developments (good or bad) we should know about?
- What's the average days-on-market for RENTAL listings here right now (not sales)? A rising rental-DOM trend means longer vacancies and softer asking-rent achievability than the comps imply.
- What's the recent tenant-quality profile in this submarket — average credit score on applications, eviction rate, late-payment / NSF rate, and stable-employment percentage? A property-management company in the area should have these aggregated.
- How much new for-sale + rental construction is in the pipeline within 1–3 miles? Heavy new supply typically softens prices + rents 12–24 months out; constrained supply supports both.
Investment metrics
- 1% rule
- 0.75% ✗
- Cap rate
- 6.17%
- Cash-on-cash
- -0.43%
- DSCR
- 0.98
- GRM
- 11.1
CMA / ARV
- ARV (on-the-fly)
- $401,778
- Comps found
- 12
Show comp detail 12 sales within ~0.75 mi
| Address | Dist | Beds/Ba | Sqft | Sold | Price | $/sf | Match |
|---|---|---|---|---|---|---|---|
| 7950 Klondike Rd Unit 25 (lot ) | 0.37mi | 4/2.0 (+1) | 1,986 (-0%) | 3mo | $394,500 | $199 | 75 |
| 2083 Juno Cir | 0.21mi | 3/2.0 | 2,133 (+7%) | 6mo | $455,000 | $213 | 73 |
| 3152 Camphor Rd Unit 22 (lot ) | 0.42mi | 4/2.0 (+1) | 1,986 (-0%) | 6mo | $389,760 | $196 | 70 |
| 3336 Holt Cir | 0.56mi | 3/2.0 | 1,913 (-4%) | 0mo | $418,000 | $219 | 67 |
| 3147 Camphor Rd Unit 3 (lot ) | 0.39mi | 3/2.0 | 1,848 (-7%) | 4mo | $372,000 | $201 | 67 |
| 3156 Camphor Rd Unit 23 (lot ) | 0.42mi | 3/2.0 | 1,848 (-7%) | 3mo | $369,230 | $200 | 66 |
| 8042 Mossy Crk | 0.18mi | 3/2.0 | 2,280 (+15%) | 1mo | $470,000 | $206 | 66 |
| 3139 Camphor Rd Unit 5 (lot ) | 0.42mi | 3/2.0 | 1,848 (-7%) | 4mo | $373,235 | $202 | 65 |
| 3144 Camphor Rd Unit 20 (lot ) | 0.42mi | 3/2.0 | 1,848 (-7%) | 6mo | $372,605 | $202 | 63 |
| 7954 Klondike Rd Unit 24 (lot ) | 0.37mi | 3/2.0 | 1,820 (-8%) | 7mo | $372,670 | $205 | 63 |
| 3151 Camphor Rd Unit 2 (lot ) | 0.40mi | 3/2.0 | 1,820 (-8%) | 7mo | $385,590 | $212 | 61 |
| 7416 Dunwalt Rd | 0.67mi | 4/2.0 (+1) | 1,899 (-4%) | 6mo | $250,000 | $132 | 52 |
Match score weights: distance 35% · size 25% · config 20% · recency 20%. Top-matched comps best support the ARV.
Projected returns pro-forma
-3.0% appreciation · 4.42% rent growth · sell at horizon
- IRR
- -15.7%
- Equity multiple
- 0.44×
- Total profit
- $-43,450
- Equity at exit
- $41,003
- IRR
- -5.3%
- Equity multiple
- 0.64×
- Total profit
- $-27,986
- Equity at exit
- $23,777
Cash invested: $77,000 (down + closing). Projections, not guarantees.
Landlord ↔ Tenant lean methodology
- Overall (STATE)
- 87 Strongly Landlord-Friendly
- State Florida
- 87 Strongly Landlord-Friendly · R+3
- County
- — inherits STATE
- City
- — inherits STATE
ZIP-level market 32526
- Home prices YoY
- -28.3%
- Rents YoY
- 4.4%
- Active inventory
- 417
- Price-to-rent
- 11.1×
Monthly cashflow live
- Estimated rent
- $2,057 medium interval (Pro) →
- Mortgage (P&I)
- −$1,442
- Tax from tax record
- −$96 /mo · $1,152/yr
- Insurance
- −$115
- HOA
- −$0
- Vacancy / Maint / Mgmt
- −$432
- Net cashflow
- $-27
Break-even live
UW: 25.0% down · 7.5% · 30yr · 1.5% tax · 5.0% vac · 8.0% maint · 8.0% mgmt
Financing live
Cash to close
- Down payment
- $68,750
- Closing costs
- $8,250
- Reserves months
- —
- Total cash needed
- —
Loan-product check · same deal, 3 products live
Conventional
25% down · 7.5% · 30yr
- Down + closing
- —
- Monthly P&I
- —
- Monthly cashflow
- —
- DSCR
- —
- Eligible?
- —
Personal DTI + credit; lowest rate.
DSCR
20% down · 8.5% · 30yr
- Down + closing
- —
- Monthly P&I
- —
- Monthly cashflow
- —
- DSCR
- —
- Eligible?
- —
No personal income docs; deal must DSCR.
Hard money
10% down · 12.0% · 12mo
- Down + closing
- —
- Monthly P&I
- —
- Monthly cashflow
- —
- DSCR
- —
- Eligible?
- —
Short-term bridge; refi at stabilization.
Rent comps 4 comps
| Address | Beds | Baths | Sqft | Rent | $/sqft | DOM | Units | Dist |
|---|---|---|---|---|---|---|---|---|
| 4626 Pebble Creek Dr Pensacola, FL | 3.0 | 2.0 | 2427 | $1,995 | $0.82 | 23d | 1 | 1.10mi |
| 8800 Pine Forest Rd Pensacola, FL | 1.0–3.0 | 1.0–2.0 | 1077 | $1,809 | $1.68 | 14d | 18 | 1.24mi |
| 2292 Sparrow Ln Pensacola, FL | 3.0 | 2.0 | 1275 | $1,525 | $1.20 | 23d | 1 | 1.33mi |
| 3440 Fallschase Blvd Pensacola, FL | 4.0 | 2.0 | 1787 | $2,200 | $1.23 | 14d | 1 | 1.40mi |
Listing history 13 events
-
2026-06-16statusdays on market $275,000 Pending 18 DOM
-
2026-06-15days on market $275,000 Active 17 DOM
-
2026-06-14pricedays on market $275,000 Active 15 DOM
-
2026-06-10days on market $299,900 Active 12 DOM
-
2026-06-09days on market $299,900 Active 11 DOM
-
2026-06-08days on market $299,900 Active 10 DOM
-
2026-06-07days on market $299,900 Active 9 DOM
-
2026-06-03days on market $299,900 Active 5 DOM
-
2026-06-02days on market $299,900 Active 4 DOM
-
2026-06-01days on market $299,900 Active 3 DOM
-
2026-05-31days on market $299,900 Active 2 DOM
-
2026-05-31remarks 699-char remark
-
2026-05-31$299,900 Active 1 DOM
ⓘ Source: listings_history table (triggers on properties + properties_extension) + one-shot
backfill from property_details.listing_events for pre-trigger history.
Tax reassessment forecast FL · Resets to sale price
- Current annual tax
- $1,152 · $96/mo
- Projected year-2 tax
- $2,282 · $190/mo
- Expected delta
- +$1,130/yr (+$94/mo · 98.1%)
ⓘ Screening estimate from a state-policy table — verify with the county assessor before closing.
Climate risk First Street
- Flood 1/10 Low FEMA zone X (unshaded) · 0% chance over 30 yrs
- Wildfire 4/10 Moderate
- Heat 10/10 Extreme 7 d/yr ≥105°F today · 21 d/yr by 30 yrs out
- Wind 9/10 Extreme 99% chance of damaging wind over 30 yrs
- Air quality 1/10 Low 0 unhealthy d/yr today · 0 by 30 yrs out
Nearby sold comps map
Loading sold comps map…
Walkable amenities ~0.75 mi
Loading nearby amenities…
Taxation est. · year 1
- Rental income
- $24,688
- − Mortgage interest
- −$15,404
- − Property taxes
- −$1,152
- − Insurance
- −$1,375
- − Repairs & maintenance
- −$1,975
- − Management
- −$1,975
- − Depreciation
- −$8,000
- Taxable loss
- −$5,194
- Est. tax savings @ 24.0%
- +$1,246
- After-tax cash flow
- $917/yr
For passive investors: Depreciation is non-cash, so a rental often shows a tax loss while cash-flowing — sheltering income. Rental losses are passive: they offset passive income freely, and up to $25,000/yr can offset ordinary (W-2) income if you actively participate and your MAGI is under $100k (phasing out to $0 by $150k); unused losses carry forward. On sale, claimed depreciation is recaptured at up to 25%, and gains may owe capital-gains tax (a 1031 exchange can defer both). Figures are a year-1 estimate at your 24.0% rate — not tax advice; consult a CPA.
Schools (NCES district)
- District
- Escambia
- NCES district ID
- 1200510
- Math proficiency
- 40% ▼ -9.00%
- Reading proficiency
- 45% ▼ -4.00%
- Median HH income
- $44,649
- Composite
- 36.04/100
- National rank
- #4773
- State rank
- #56 of 73 in FL
Livability — Ensley
- Score
- 79/100
- State rank
- #133
- US rank
- #1996
Category grades
Schools grade is shown separately in the Schools card above.
Census & demographics
- County
- Escambia County · 301,722 people
- City population
- 15,879
- Metro
- Pensacola-Ferry Pass-Brent, FL
- Population (ZIP)
- 44,680
- Household income
- $75,098
- Rent vs Own
- Severe rent burden
- 1166.0
Population outlook (Escambia County) Hauer SSP2
- Today (2025)
- 334,637 people
- By 2030
- 345,779 · +3.3%
- By 2040
- 364,828 · +9.0%
- By 2050
- 378,514 · +13.1%
- By 2075
- 403,220 · +20.5%
- By 2100
- 386,125 · +15.4%
Race, ethnicity, and origin ACS 2023
- Neighborhood character
- Predominantly White (66%)
- Race & ethnicity
- White 66% Black 19% Two or more races 8% Hispanic / Latino 5% Asian 3%
- Common ancestry
- Lithuanian 2% Slovak 2% Serbian 2%
- Foreign-born
- 5% · Canada, China
- Languages at home
- 94% English-only · Spanish 2% Tagalog/Filipino 1% Other Indo-European 1%
Political lean MEDSL · Escambia
- 2024 margin
- R (+19.5) · D 39.7% · R 59.2% · Other 1.1%
- 2008→2024 swing
- -0.2pp no change · 2008: -19.3pp · 2024: -19.5pp
- All cycles
- 2024: R+19.5 2020: R+15.1 2016: R+20.6 2012: R+20.6 2008: R+19.3
Not yet ingested
- Civics
- —
Market trends
- HPI YoY
- ▼ -99.68%
- Current HPI
- 252.6406
- Rent YoY
- ▲ 4.42%
- Metro
- Pensacola-Ferry Pass-Brent, FL
- State GDP YoY
- ▲ 3.28%
- F500 in state
- 36
Industry mix (Fortune 500 HQ in FL)
| Industry | F500 HQs | Revenue |
|---|---|---|
| Industrial Technology | 2 | $29B |
|
||
| Insurance | 2 | $17B |
|
||
| Retail | 1 | $60B |
|
||
| Technology Distribution | 1 | $58B |
|
||
| Homebuilding | 1 | $35B |
|
||
| Technology Manufacturing | 1 | $35B |
|
||
Price history
1 event — show timeline
- 2026-05-28 Listed $299,900 PARMLS
Property tax history
+3.5%/yrLatest (2025): $1,152 · +18.1% YoY. Source: county tax records.
Cash-flow waterfall
monthlySold comps — $/sqft
last 12 mo · ≤1 miLoading sold comps…