 Triplex
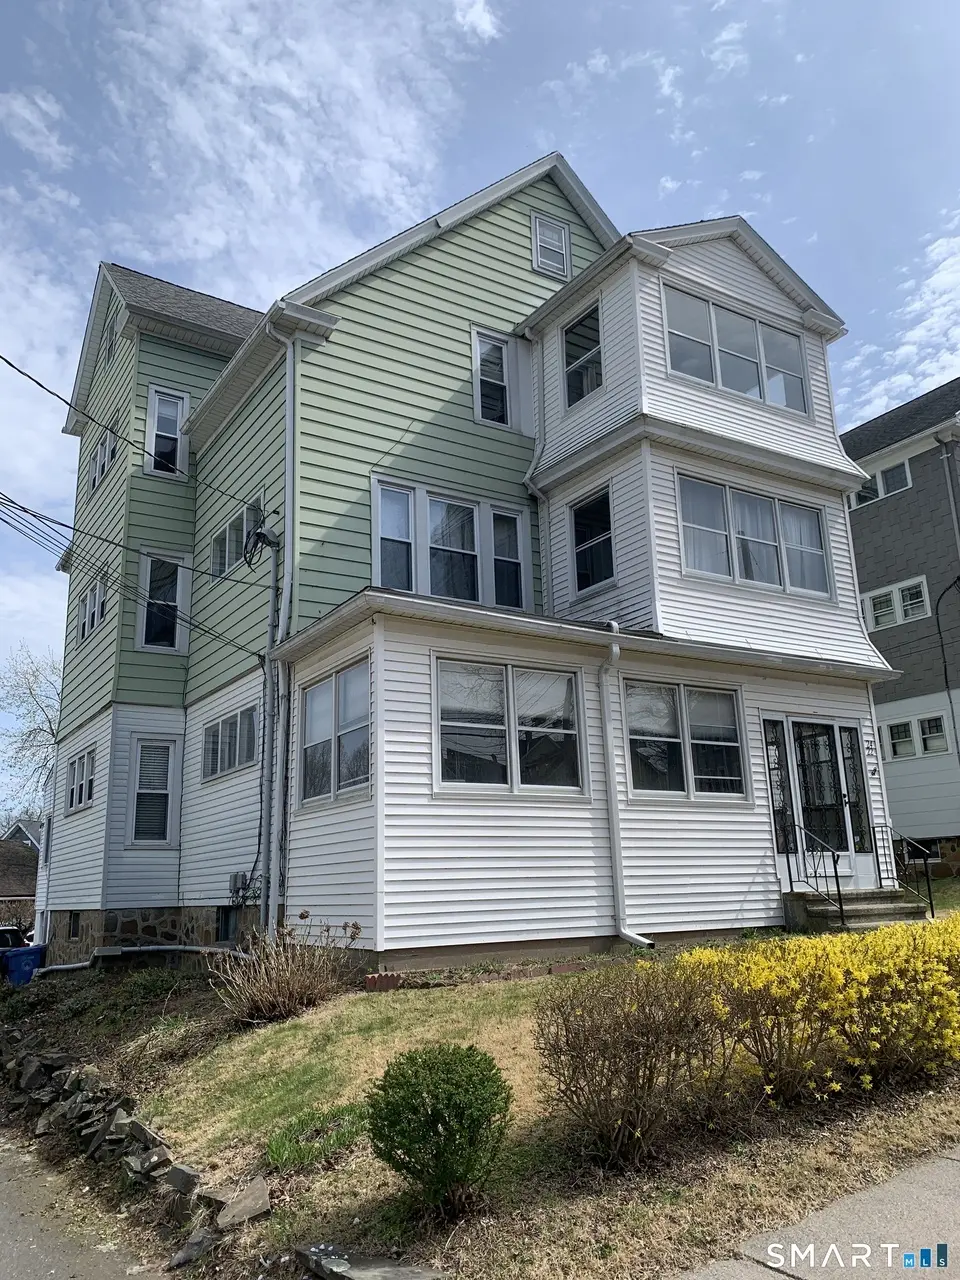
22-24 Kimball Dr · New Britain, CT
Flood risk 1/10 · Minimal
- FEMA flood zone
- X (unshaded)
- Chance of flooding over 30 yrs
- 0.0%
- Est. flood insurance / yr
- $473 – $860
Fire risk 1/10 · Minimal
- Est. fire insurance / yr
- $829 – $1,539
Heat risk 5/10 · Moderate
- Hot days now (above 97°F)
- 7 days/yr
- Hot days in 30 yrs
- 15 days/yr
Wind risk 6/10 · Moderate
- Chance of severe wind over 30 yrs
- 27.0%
Air-quality risk 3/10 · Minor
- Unhealthy air days now
- 2 days/yr
- Unhealthy air days in 30 yrs
- 3 days/yr
Risk factors via First Street. Map © Google.
Why this score? — see what drove the C+ grade
The composite is a weighted blend of 9 inputs, each scored 0–100. Each bar is that input's sub-score; the figure is the points it added to the 100-point composite (weight × sub-score).
- Cash flow +21.4/30.0
- Appreciation +10.0/10.0
- ARV discount +9.2/15.0
- DSCR +6.8/10.0
- 1% rule +5.6/10.0
- Livability +3.7/5.0
- Condition / age +2.8/5.0
- Rent growth +2.4/5.0
- Schools +1.0/10.0
$499,990
🖨 Deal sheet (PDF) 📄 Offer letter ✓ Due diligence
Multi-family units
County records classify this as Multi-Family (2-4 Unit). Listing-text estimate: 3 units. confirmed
Listing remarks
Incredible owner occupied or investor opportunity. This impressive three-family home offers almost 4000 sq. ft. of living space. Each unit boasts two bedrooms and one bath with a spacious kitchen, dining-room, and living-room. Separate gas furnaces, water heaters and electric panels (plus Owner's panel). Also, a 3 car detached garage with power for additional income. (current tenants do not have access to the garage). Ample off-street and on-street parking. Excellent cashflow potential and upside in a strong rental market. Don't miss out! Large multi-Families like these Don't Last Long!
Key facts
- 6,534 sq ft lot
- 3 garage spots
- Built 1923
Neighborhood map
What this means for you Summary
Snapshot
- This is a 3 × 2-bed/1-bath units multifamily listed at $500k. Condition is rated average.
Deal economics
- At list price, monthly cash flow is $744 ($9k/yr) — positive. Per door: $248/mo.
- The deal already cash-flows at list — no discount required.
- Meets the 1% rule at list price ($5k rent vs $500k).
- Cap rate 8.1% vs local median 4.2% in New Britain — top-decile yield for the area; either an underpriced asset or a hidden risk that comps aren't pricing in. Stress-test before assuming the spread holds.
Location & tenants
- Location reads 74/100 on livability (#67 in CT, #4,936 nationally) — a middle-class / working-renter tenant base. Strengths: health & safety A+, cost of living A, housing A; Watch: crime D, employment D.
- New Britain School District (suburban): math 6% / reading 17% proficiency, ranked #153 of 153 in CT (top 100%) — low school quality limits family demand, transient renter base, plan for 1-2y turnover; 71% free/reduced lunch — lower-income household profile, screen leases tightly.
- Zoned schools: Diloreto Elementary & Middle School (math 4% / reading 15%, grade F, #522 of 553 statewide, top 95%, 842 students, 73% FRL); Slade Middle School (math 0% / reading 8%, grade F, #174 of 175 statewide, top 99%, 795 students, 77% FRL); New Britain High School (math 10% / reading 31%, grade F, #162 of 194 statewide, top 83%, 2,331 students, 71% FRL) — zoned schools at 74% FRL track the district average.
- Market conditions: Rents soft (-0.6%/yr); 62 active listings in the ZIP; 1 comparable units currently listed for rent nearby; 1,867 units permitted in Capitol Planning Region in 2024 (1,399 in 5+ unit buildings).
- At $5,315/mo this rent would consume 125% of the median local household income ($51k/yr) (locally 2100% of renters already pay >50% of income on rent) — very limited rent-growth headroom before tenants either downsize or default.
Forward outlook
- In year one you build about $53k of equity ($3k loan paydown + $50k appreciation (10.0% local appreciation)).
- At projected returns (10.0% appreciation + 0.0% rent growth), your $140k cash investment doubles in ~3 years — after that, you're playing with house money.
- By year 2, paydown + projected appreciation supports a ~$86k cash-out refi (75% LTV) — recoverable capital for the next deal without selling this one.
Negotiation context
- Only 7 days on market — expect competitive offers; lowballing is unlikely to land.
Risks & watch-outs
- Watch-outs: built in 1923 — expect roof / HVAC / electrical / plumbing capex.
- Climate carrying-cost: major wind risk, 27% chance of damaging wind over 30y; extreme-heat days projected 7→15/yr by 2055 (HVAC capex compounding) — expect insurance premiums to compound above CPI over the hold.
Questions for the listing agent
- Can we see the unit-by-unit rent roll, current vacancy, and any below-market leases? What's the average tenancy length?
- What capital expenditures (roof, boiler, parking lot, exteriors) have been made in the last 5 years, and what's planned in the next 2?
- Built in 1923 — when were the roof, HVAC, electrical panel, plumbing, and water heater last replaced?
- Is there a deadline driving the sale (1031 exchange, divorce, estate, relocation)? That informs how much negotiation room exists.
- Schools are F-rated, which usually means shorter tenancies and higher turnover. Who's the typical renter profile here, and what's been the actual vacancy rate?
- Crime grade is D in this area — have there been break-ins, vandalism, or insurance claims at this property in the last 3 years? What carrier currently insures it and at what premium?
- What's the average days-on-market for RENTAL listings here right now (not sales)? A rising rental-DOM trend means longer vacancies and softer asking-rent achievability than the comps imply.
- What's the recent tenant-quality profile in this submarket — average credit score on applications, eviction rate, late-payment / NSF rate, and stable-employment percentage? A property-management company in the area should have these aggregated.
- How much new apartment / multifamily construction is in the pipeline within 1–3 miles? Heavy new supply (>2% of stock underway) typically softens rents 12–24 months out; light construction supports rent growth.
Investment metrics
- 1% rule
- 1.06% ✓
- Cap rate
- 8.08%
- Cash-on-cash
- 6.37%
- DSCR
- 1.28
- GRM
- 7.8
CMA / ARV
- ARV (on-the-fly)
- $519,740
- Comps found
- 12
Show comp detail 12 sales within ~0.75 mi
| Address | Dist | Beds/Ba | Sqft | Sold | Price | $/sf | Match |
|---|---|---|---|---|---|---|---|
| 17 Kensington Ave | 0.02mi | 6/3.0 | 3,852 (-4%) | 7mo | $450,000 | $117 | 87 |
| 100 Shuttle Meadow Ave | 0.17mi | 6/3.0 | 3,732 (-7%) | 5mo | $540,000 | $145 | 77 |
| 14 Buell St | 0.51mi | 6/3.0 | 3,924 (-2%) | 3mo | $495,000 | $126 | 71 |
| 156 Columbia St | 0.30mi | 6/3.0 | 3,858 (-4%) | 14mo | $599,900 | $155 | 68 |
| 63 Lyons St | 0.22mi | 6/3.0 | 4,140 (+4%) | 19mo | $420,000 | $101 | 68 |
| 40 Shuttle Meadow Ave | 0.09mi | 7/3.0 (+1) | 4,462 (+12%) | 7mo | $539,000 | $121 | 66 |
| 27 Andrews St | 0.14mi | 6/4.0 | 3,479 (-13%) | 5mo | $535,000 | $154 | 64 |
| 68 Trinity St | 0.48mi | 6/3.0 | 3,862 (-3%) | 14mo | $420,000 | $109 | 60 |
| 276 Linwood St | 0.11mi | 6/3.0 | 3,534 (-12%) | 19mo | $425,000 | $120 | 60 |
| 150 Greenwood St | 0.21mi | 6/3.0 | 3,426 (-14%) | 8mo | $445,000 | $130 | 59 |
| 208 Brook St | 0.24mi | 6/3.0 | 3,432 (-14%) | 9mo | $475,000 | $138 | 58 |
| 46 Camp St | 0.61mi | 7/4.0 (+1) | 3,740 (-6%) | 15mo | $550,000 | $147 | 39 |
Match score weights: distance 35% · size 25% · config 20% · recency 20%. Top-matched comps best support the ARV.
Projected returns pro-forma
10.0% appreciation · 0.0% rent growth · sell at horizon
- IRR
- 27.7%
- Equity multiple
- 3.17×
- Total profit
- $304,168
- Equity at exit
- $450,431
- IRR
- 23.4%
- Equity multiple
- 6.93×
- Total profit
- $830,753
- Equity at exit
- $971,371
Cash invested: $139,997 (down + closing). Projections, not guarantees.
Landlord ↔ Tenant lean methodology
- Overall (STATE)
- 27 Tenant-Leaning
- State Connecticut
- 27 Tenant-Leaning · D+7
- County
- — inherits STATE
- City
- — inherits STATE
ZIP-level market 06051
- Home prices YoY
- 9.0%
- Rents YoY
- -0.6%
- Active inventory
- 62
- Price-to-rent
- 23.5×
Monthly cashflow live
- Estimated rent
- $5,315 high interval (Pro) →
- Mortgage (P&I)
- −$2,622
- Tax est. 1.5%
- −$625 /mo · $7,500/yr
- Insurance
- −$208
- HOA
- −$0
- Vacancy / Maint / Mgmt
- −$1,116
- Net cashflow
- $744
Break-even live
Sensitivity live
| Price | -10% $1,089 | -5% $916 | +0% $744 | +5% $571 | +10% $398 |
|---|---|---|---|---|---|
| Rent | -10% $324 | -5% $534 | +0% $744 | +5% $953 | +10% $1,163 |
| Rate | -1.0pp $995 | -0.5pp $871 | base $744 | +0.5pp $614 | +1.0pp $482 |
3-unit breakdown (identical units grouped — click to expand)
| Units | Beds | Baths | Est. rent |
|---|---|---|---|
| 3× units | 2 | 1 | $5,316 |
| #1 | 2 | 1 | $1,772 |
| #2 | 2 | 1 | $1,772 |
| #3 | 2 | 1 | $1,772 |
| Total (3 units) | $5,315 | ||
UW: 25.0% down · 7.5% · 30yr · 1.5% tax · 5.0% vac · 8.0% maint · 8.0% mgmt
Financing live
Cash to close
- Down payment
- $124,998
- Closing costs
- $15,000
- Reserves months
- —
- Total cash needed
- —
Loan-product check · same deal, 3 products live
Conventional
25% down · 7.5% · 30yr
- Down + closing
- —
- Monthly P&I
- —
- Monthly cashflow
- —
- DSCR
- —
- Eligible?
- —
Personal DTI + credit; lowest rate.
DSCR
20% down · 8.5% · 30yr
- Down + closing
- —
- Monthly P&I
- —
- Monthly cashflow
- —
- DSCR
- —
- Eligible?
- —
No personal income docs; deal must DSCR.
Hard money
10% down · 12.0% · 12mo
- Down + closing
- —
- Monthly P&I
- —
- Monthly cashflow
- —
- DSCR
- —
- Eligible?
- —
Short-term bridge; refi at stabilization.
Rent comps 1 comps
| Address | Beds | Baths | Sqft | Rent | $/sqft | DOM | Units | Dist |
|---|---|---|---|---|---|---|---|---|
| 151 Fairview St New Britain, CT | 6.0 | 3.0 | 4098 | $1,800 | $0.44 | 4d | 1 | 1.25mi |
Listing history 2 events
-
2026-04-21status Under Contract
-
2026-04-13$499,990 Active
ⓘ Source: listings_history table (triggers on properties + properties_extension) + one-shot
backfill from property_details.listing_events for pre-trigger history.
Climate risk First Street
- Flood 1/10 Low FEMA zone X (unshaded) · 0% chance over 30 yrs
- Wildfire 1/10 Low
- Heat 5/10 Major 7 d/yr ≥97°F today · 15 d/yr by 30 yrs out
- Wind 6/10 Major 27% chance of damaging wind over 30 yrs
- Air quality 3/10 Moderate 2 unhealthy d/yr today · 3 by 30 yrs out
Nearby sold comps map
Loading sold comps map…
Walkable amenities ~0.75 mi
Loading nearby amenities…
Taxation est. · year 1
- Rental income
- $63,780
- − Mortgage interest
- −$28,007
- − Property taxes
- −$7,500
- − Insurance
- −$2,500
- − Repairs & maintenance
- −$5,102
- − Management
- −$5,102
- − Depreciation
- −$14,545
- Taxable income
- $1,023
- Est. tax owed @ 24.0%
- −$246
- After-tax cash flow
- $8,677/yr
For passive investors: Depreciation is non-cash, so a rental often shows a tax loss while cash-flowing — sheltering income. Rental losses are passive: they offset passive income freely, and up to $25,000/yr can offset ordinary (W-2) income if you actively participate and your MAGI is under $100k (phasing out to $0 by $150k); unused losses carry forward. On sale, claimed depreciation is recaptured at up to 25%, and gains may owe capital-gains tax (a 1031 exchange can defer both). Figures are a year-1 estimate at your 24.0% rate — not tax advice; consult a CPA.
Condition & rehab AI · 12 photos
This three-family home offers a good amount of living space and potential for improvement. It requires moderate repairs and maintenance to bring it up to date and increase its value.
Repairs flagged
- Moderate kitchen cabinets — dated and in need of replacement
- Moderate bathroom fixtures — outdated and in need of replacement
- Minor landscaping — some overgrown areas
Value-add opportunities
- Both update kitchen cabinets and appliances — modernizing the kitchen would appeal to both buyers and renters
- Both update bathroom fixtures and tiles — modernizing the bathrooms would appeal to both buyers and renters
- Both landscaping and curb appeal — improving the landscaping would enhance the home's curb appeal and attract more potential buyers
Renovation cost estimate screening
| Repair item | Severity | Est. cost |
|---|---|---|
| kitchen cabinets · dated and in need of replacement | Moderate | $3,000–15,000 |
| bathroom fixtures · outdated and in need of replacement | Moderate | $3,000–15,000 |
| landscaping · some overgrown areas | Minor | $500–3,000 |
| Total estimated repair cost · 3 items | $6,500–33,000 |
Value-add ROI direction
- Both update kitchen cabinets and appliances — modernizing the kitchen would appeal to both buyers and renters ↑
- Both update bathroom fixtures and tiles — modernizing the bathrooms would appeal to both buyers and renters ↑
- Both landscaping and curb appeal — improving the landscaping would enhance the home's curb appeal and attract more potential buyers ↑
ⓘ Cost ranges are severity-bucket heuristics (US national rule-of-thumb). Get contractor quotes + a written scope before underwriting a rehab budget.
Schools (NCES district)
- District
- New Britain School District
- NCES district ID
- 0902670
- Math proficiency
- 6% ▼ -6.00%
- Reading proficiency
- 17% ▼ -5.00%
- Median HH income
- $40,827
- Composite
- 9.95/100
- National rank
- #9816
- State rank
- #153 of 153 in CT
Livability — New Britain
- Score
- 74/100
- State rank
- #67
- US rank
- #4936
Category grades
Schools grade is shown separately in the Schools card above.
Census & demographics
- Census place
- New Britain, CT
- County
- Hartford County · 754,208 people
- City population
- 66,322
- Metro
- Hartford-East Hartford-Middletown, CT
- Population (ZIP)
- 29,548
- Household income
- $51,022
- Rent vs Own
- Severe rent burden
- 2100.0
Population outlook (Capitol County) Hauer SSP2
- By 2040
- 1,063,519
Race, ethnicity, and origin ACS 2023
- Neighborhood character
- Diverse neighborhood (Simpson 0.63)
- Race & ethnicity
- Hispanic / Latino 52% White 30% Two or more races 17% Black 11% Asian 2%
- Hispanic origin (detail)
- Mexican 2% Puerto Rican 40% Dominican 4%
- Common ancestry
- Romanian 7% Lithuanian 6% Slovak 1%
- Foreign-born
- 15% · Canada, Jamaica
- Languages at home
- 51% English-only · Spanish 39% Russian/Polish/Slavic 6% Arabic 3%
Political lean MEDSL · Capitol
- 2024 margin
- Strong D (+21.9) · D 60.1% · R 38.2% · Other 1.7%
- All cycles
- 2024: D+21.9
Not yet ingested
- Civics
- —
Market trends
- HPI YoY
- ▲ 31.52%
- Current HPI
- 382.7816
- Rent YoY
- ▼ -0.58%
- Metro
- Hartford-East Hartford-Middletown, CT
- State GDP YoY
- ▲ 1.06%
- F500 in state
- 38
Industry mix (Fortune 500 HQ in CT)
| Industry | F500 HQs | Revenue |
|---|---|---|
| Industrial Machinery | 4 | $38B |
|
||
| Insurance | 3 | $71B |
|
||
| Financial Services | 2 | $25B |
|
||
| Transportation / Logistics | 2 | $18B |
|
||
| Healthcare | 1 | $247B |
|
||
| Telecommunications | 1 | $55B |
|
||
Price history
2 events — show timeline
- 2026-04-21 Pending — Smart MLS
- 2026-04-13 Listed $499,990 Smart MLS
Cash-flow waterfall
monthlySold comps — $/sqft
last 12 mo · ≤1 miLoading sold comps…