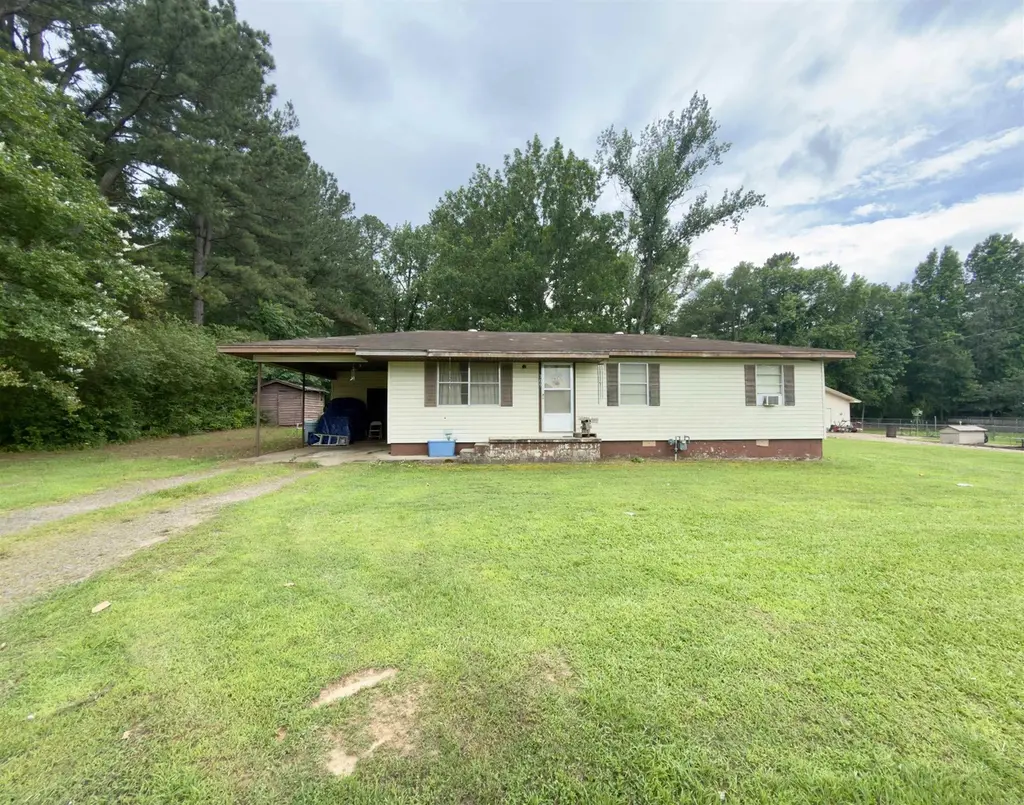
309 Cliff St · Danville, AR
Flood risk 1/10 · Minimal
- FEMA flood zone
- X (unshaded)
- Chance of flooding over 30 yrs
- 0.0%
- Est. flood insurance / yr
- $507 – $1,088
Fire risk 5/10 · Moderate
- Est. fire insurance / yr
- $1,499 – $2,785
Heat risk 6/10 · Moderate
- Hot days now (above 110°F)
- 7 days/yr
- Hot days in 30 yrs
- 19 days/yr
Wind risk 2/10 · Minimal
- Chance of severe wind over 30 yrs
- 3.0%
Air-quality risk 1/10 · Minimal
- Unhealthy air days now
- 0 days/yr
- Unhealthy air days in 30 yrs
- 0 days/yr
Risk factors via First Street. Map © Google.
Why this score? — see what drove the B- grade
The composite is a weighted blend of 9 inputs, each scored 0–100. Each bar is that input's sub-score; the figure is the points it added to the 100-point composite (weight × sub-score).
- Cash flow +27.0/30.0
- DSCR +9.4/10.0
- 1% rule +6.3/10.0
- ARV discount +5.1/15.0
- Appreciation +5.0/10.0
- Livability +3.8/5.0
- Schools +3.7/10.0
- Rent growth +2.5/5.0
- Condition / age +2.5/5.0
$91,520
🖨 Deal sheet 📄 Offer letter ✓ Due diligence
Listing remarks MLS
Opportunity awaits in Danville! This 3-bedroom, 1.5-bath home offers plenty of potential for buyers looking to add their personal touch. With a functional layout and solid bones, this property is ready for a little TLC to bring it back to its full charm. Whether you're a first-time homebuyer searching for an affordable starter home or an investor looking for your next project, this home presents a great opportunity. Conveniently located in Danville with easy access to local amenities, schools, and parks. Don't miss your chance to turn this property into something special. Schedule your showing today and imagine the possibilities!
Key facts
- Solid bones
- Functional layout
- Parks
Tags
Property features AI
Finance
- Other: Lot approximately 120 x 150 (0.41 acre)
Exterior
- Parking: Carport for 1 car
- Utilities: Public sewer; Public water; Electric service (municipal/Entergy); Natural gas
- Home design: Single-family property
- Construction: Crawl space and piers foundation; Other roof (see remarks)
- Exterior features: Metal/vinyl siding; Paved road access; Cleared lot; Located in a subdivision
Interior
- Kitchen: Electric range
- Flooring: Carpet; Other (see remarks)
- Bathrooms: 1 full bathroom; 1 half bathroom
- Heating & cooling: Central gas heat; Window air conditioning units
- Interior features: Gas water heater; Formal living room; Laundry room
- Laundry & utility: Laundry room (interior)
Neighborhood map
What this means for you Summary
Snapshot
- This is a 3-bed/1.5-bath single-family listed at $92k.
Deal economics
- At list price, monthly cash flow is $257 ($3k/yr) — positive.
- The deal already cash-flows at list — no discount required.
- Meets the 1% rule at list price ($1k rent vs $92k).
Location & tenants
- Location reads 75/100 on livability (#14 in AR, #4,201 nationally) — a middle-class / working-renter tenant base. Strengths: cost of living A+, housing A+, health & safety A+; Watch: schools C-, amenities F, commute F.
- Danville School District (rural): math 43% / reading 44% proficiency, ranked #46 of 238 in AR (top 19%) — families likely to look elsewhere, expect single-tenant / working-renter base with shorter leases; 67% free/reduced lunch — lower-income household profile, screen leases tightly.
- Market conditions: 29 active listings in the ZIP; 10 units permitted in Yell County in 2024 (0 in 5+ unit buildings).
Forward outlook
- In year one you build about $3k of equity ($633 loan paydown + $3k appreciation (3.0% local appreciation)).
- Yell County population projected at -24% by 2050 — secular population decline; favor cash flow + early exit over multi-decade hold.
- At projected returns (3.0% appreciation + 3.0% rent growth), your $26k cash investment doubles in ~4 years — after that, you're playing with house money.
- By year 10, paydown + projected appreciation supports a ~$33k cash-out refi (75% LTV) — recoverable capital for the next deal without selling this one.
Negotiation context
- Only 14 days on market — expect competitive offers; lowballing is unlikely to land.
- 2 sale attempts with the ask held roughly flat each time — persistent listings suggest the price (not the market) is what's stuck; bring a comps-based counter.
Risks & watch-outs
- Climate carrying-cost: moderate wildfire risk; extreme-heat days projected 7→19/yr by 2055 (HVAC capex compounding) — expect insurance premiums to compound above CPI over the hold.
Questions for the listing agent
- Built in 1971 — when were the roof, HVAC, electrical panel, plumbing, and water heater last replaced?
- Is there a deadline driving the sale (1031 exchange, divorce, estate, relocation)? That informs how much negotiation room exists.
- What's the average days-on-market for RENTAL listings here right now (not sales)? A rising rental-DOM trend means longer vacancies and softer asking-rent achievability than the comps imply.
- What's the recent tenant-quality profile in this submarket — average credit score on applications, eviction rate, late-payment / NSF rate, and stable-employment percentage? A property-management company in the area should have these aggregated.
- How much new for-sale + rental construction is in the pipeline within 1–3 miles? Heavy new supply typically softens prices + rents 12–24 months out; constrained supply supports both.
Investment metrics
- 1% rule
- 1.13% ✓
- Cap rate
- 9.67%
- Cash-on-cash
- 12.05%
- DSCR
- 1.54
- GRM
- 7.3
CMA / ARV
- ARV (on-the-fly)
- $86,944
- Comps found
- 3
Show comp detail 3 sales within ~0.75 mi
| Address | Dist | Beds/Ba | Sqft | Sold | Price | $/sf | Match |
|---|---|---|---|---|---|---|---|
| 308 Mountain St | 0.04mi | 3/1.5 | 1,188 (+4%) | 16mo | $90,000 | $76 | 78 |
| 207 Dutch St | 0.13mi | 3/1.5 | 1,215 (+6%) | 12mo | $75,000 | $62 | 74 |
| 108 Dutch St | 0.16mi | 3/1.5 | 1,305 (+14%) | 15mo | $130,000 | $100 | 56 |
Match score weights: distance 35% · size 25% · config 20% · recency 20%. Top-matched comps best support the ARV.
Projected returns pro-forma
3.0% appreciation · 3.0% rent growth · sell at horizon
- IRR
- 18.8%
- Equity multiple
- 2.07×
- Total profit
- $27,387
- Equity at exit
- $41,151
- IRR
- 20.1%
- Equity multiple
- 3.91×
- Total profit
- $74,503
- Equity at exit
- $63,419
Cash invested: $25,626 (down + closing). Projections, not guarantees.
Landlord ↔ Tenant lean methodology
- Overall (STATE)
- 92 Strongly Landlord-Friendly
- State Arkansas
- 92 Strongly Landlord-Friendly · R+14
- County
- — inherits STATE
- City
- — inherits STATE
ZIP-level market 72833
- Active inventory
- 29
- Price-to-rent
- 7.3×
Monthly cashflow live
- Estimated rent
- $1,038 medium interval (Pro) →
- Mortgage (P&I)
- −$480
- Tax from tax record
- −$45 /mo · $535/yr
- Insurance
- −$38
- HOA
- −$0
- Vacancy / Maint / Mgmt
- −$218
- Net cashflow
- $257
Break-even live
UW: 25.0% down · 7.5% · 30yr · 1.5% tax · 5.0% vac · 8.0% maint · 8.0% mgmt
Financing live
Cash to close
- Down payment
- $22,880
- Closing costs
- $2,746
- Reserves months
- —
- Total cash needed
- —
Loan-product check · same deal, 3 products live
Conventional
25% down · 7.5% · 30yr
- Down + closing
- —
- Monthly P&I
- —
- Monthly cashflow
- —
- DSCR
- —
- Eligible?
- —
Personal DTI + credit; lowest rate.
DSCR
20% down · 8.5% · 30yr
- Down + closing
- —
- Monthly P&I
- —
- Monthly cashflow
- —
- DSCR
- —
- Eligible?
- —
No personal income docs; deal must DSCR.
Hard money
10% down · 12.0% · 12mo
- Down + closing
- —
- Monthly P&I
- —
- Monthly cashflow
- —
- DSCR
- —
- Eligible?
- —
Short-term bridge; refi at stabilization.
Listing history 12 events
-
2026-06-19days on market $91,520 Active 14 DOM
-
2026-06-18days on market $91,520 Active 13 DOM
-
2026-06-17days on market $91,520 Active 12 DOM
-
2026-06-16days on market $91,520 Active 11 DOM
-
2026-06-15days on market $91,520 Active 10 DOM
-
2026-06-14days on market $91,520 Active 8 DOM
-
2026-06-12statusdays on market $91,520 Active 7 DOM
-
2026-06-09days on market $91,520 New Listing 4 DOM
-
2026-06-08days on market $91,520 New Listing 3 DOM
-
2026-06-07days on market $91,520 New Listing 2 DOM
-
2026-06-07remarks 637-char remark
-
2026-06-07$91,520 New Listing 1 DOM
ⓘ Source: listings_history table (triggers on properties + properties_extension) + one-shot
backfill from property_details.listing_events for pre-trigger history.
Tax reassessment forecast AR · Resets to sale price
- Current annual tax
- $535 · $45/mo
- Projected year-2 tax
- $586 · $49/mo
- Expected delta
- +$51/yr (+$4/mo · 9.5%)
ⓘ Screening estimate from a state-policy table — verify with the county assessor before closing.
Climate risk First Street
- Flood 1/10 Low FEMA zone X (unshaded) · 0% chance over 30 yrs
- Wildfire 5/10 Major
- Heat 6/10 Major 7 d/yr ≥110°F today · 19 d/yr by 30 yrs out
- Wind 2/10 Low 3% chance of damaging wind over 30 yrs
- Air quality 1/10 Low 0 unhealthy d/yr today · 0 by 30 yrs out
Nearby sold comps map
Loading sold comps map…
Walkable amenities ~0.75 mi
Loading nearby amenities…
Taxation est. · year 1
- Rental income
- $12,455
- − Mortgage interest
- −$5,127
- − Property taxes
- −$535
- − Insurance
- −$458
- − Repairs & maintenance
- −$996
- − Management
- −$996
- − Depreciation
- −$2,662
- Taxable income
- $1,681
- Est. tax owed @ 24.0%
- −$403
- After-tax cash flow
- $2,684/yr
For passive investors: Depreciation is non-cash, so a rental often shows a tax loss while cash-flowing — sheltering income. Rental losses are passive: they offset passive income freely, and up to $25,000/yr can offset ordinary (W-2) income if you actively participate and your MAGI is under $100k (phasing out to $0 by $150k); unused losses carry forward. On sale, claimed depreciation is recaptured at up to 25%, and gains may owe capital-gains tax (a 1031 exchange can defer both). Figures are a year-1 estimate at your 24.0% rate — not tax advice; consult a CPA.
Schools (NCES district)
- District
- Danville School District
- NCES district ID
- 0504890
- Math proficiency
- 43% ▼ -8.00%
- Reading proficiency
- 44% ▼ -7.00%
- Median HH income
- $41,295
- Composite
- 36.57/100
- National rank
- #4634
- State rank
- #46 of 238 in AR
Livability — Danville
- Score
- 75/100
- State rank
- #14
- US rank
- #4201
Category grades
Schools grade is shown separately in the Schools card above.
Census & demographics
- Census place
- Danville, AR
- Population (ZIP)
- 3,432
Population outlook (Yell County) Hauer SSP2
- Today (2025)
- 20,438 people
- By 2030
- 19,561 · -4.3%
- By 2040
- 17,654 · -13.6%
- By 2050
- 15,569 · -23.8%
- By 2075
- 10,746 · -47.4%
- By 2100
- 6,907 · -66.2%
Race, ethnicity, and origin ACS 2023
- Neighborhood character
- Majority White (58%)
- Race & ethnicity
- White 58% Hispanic / Latino 40% Two or more races 8% Native American 2%
- Hispanic origin (detail)
- Mexican 25% Puerto Rican 12%
- Common ancestry
- Slovak 1% Iranian 1% Serbian 1%
- Foreign-born
- 15% · Canada
- Languages at home
- 66% English-only · Spanish 34%
Political lean MEDSL · Yell
- 2024 margin
- Solid R (+60.7) · D 18.7% · R 79.5% · Other 1.8%
- 2008→2024 swing
- -30.8pp toward R · 2008: -29.9pp · 2024: -60.7pp
- All cycles
- 2024: R+60.7 2020: R+58.5 2016: R+49.0 2012: R+38.9 2008: R+29.9
Not yet ingested
- Civics
- —
Market trends
- HPI YoY
- —
- Current HPI
- —
- Rent YoY
- —
- Metro
- —
- State GDP YoY
- ▲ 3.80%
- F500 in state
- 10
Industry mix (Fortune 500 HQ in AR)
| Industry | F500 HQs | Revenue |
|---|---|---|
| Retail | 1 | $681B |
|
||
| Food / Agriculture | 1 | $53B |
|
||
| Retail / Energy | 1 | $22B |
|
||
| Transportation / Logistics | 1 | $12B |
|
||
| Energy | 1 | $4B |
|
||
Price history
+0.0% since first listed2 events — show timeline
- 2026-06-04 Listed $91,520 CARMLS
- 2026-06-04 Listed $91,520 NWARMLS
Property tax history
+4.4%/yrLatest (2025): $535 · -0.1% YoY. Source: county tax records.
Cash-flow waterfall
monthlySold comps — $/sqft
last 12 mo · ≤1 miLoading sold comps…