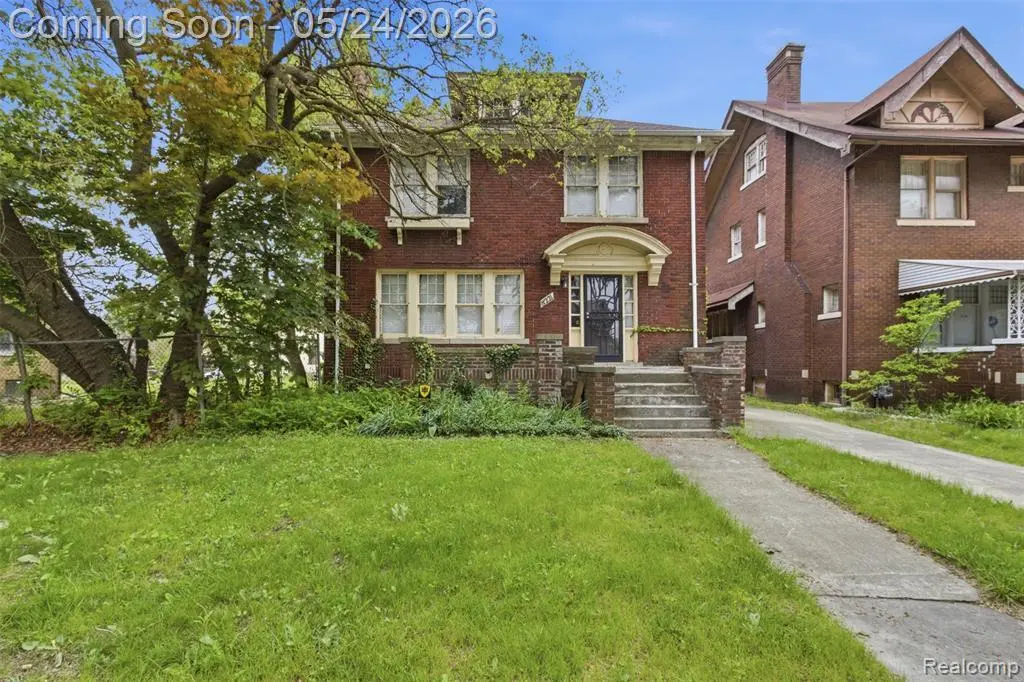
8221 Dexter Ave · Detroit, MI
Flood risk 1/10 · Minimal
- FEMA flood zone
- X (unshaded)
- Chance of flooding over 30 yrs
- 0.0%
- Est. flood insurance / yr
- $473 – $860
Fire risk 1/10 · Minimal
- Est. fire insurance / yr
- $784 – $1,456
Heat risk 3/10 · Minor
- Hot days now (above 97°F)
- 7 days/yr
- Hot days in 30 yrs
- 15 days/yr
Wind risk 2/10 · Minimal
- Chance of severe wind over 30 yrs
- —
Air-quality risk 4/10 · Minor
- Unhealthy air days now
- 4 days/yr
- Unhealthy air days in 30 yrs
- 6 days/yr
Risk factors via First Street. Map © Google.
Why this score? — see what drove the B+ grade
The composite is a weighted blend of 9 inputs, each scored 0–100. Each bar is that input's sub-score; the figure is the points it added to the 100-point composite (weight × sub-score).
- Cash flow +30.0/30.0
- ARV discount +15.0/15.0
- 1% rule +10.0/10.0
- DSCR +10.0/10.0
- Rent growth +3.8/5.0
- Livability +3.7/5.0
- Condition / age +2.5/5.0
- Schools +1.3/10.0
- Appreciation +0.0/10.0
$95,000
🖨 Deal sheet 📄 Offer letter ✓ Due diligence
Listing remarks
Welcome to this large brick fixer-upper located just 10 minutes from Downtown Detroit and close to major freeways for an easy commute. Situated in Detroit’s revitalizing Dexter-Linwood area, this spacious home offers tons of potential for a first-time homeowner looking to build equity or an investor searching for their next rehab project. Features include a two-car garage, fireplace, newer roof, and electrical and plumbing work already started — giving buyers a head start on renovations. Conveniently located near shopping, dining, Midtown, and New Center with classic Detroit charm throughout the neighborhood.
Key facts
- 4,792 sq ft lot
- 2 garage spots
- Built 1919
Property features AI
Exterior
- Parking: Detached 2-car garage
- Utilities: Public water
- Home design: Residential 2-story; Built in 1919
- Construction: Basement foundation; Below-grade area noted (960)
- Exterior features: Brick exterior; Paved street frontage; Frontage approximately 50 feet
Interior
- Bedrooms: Three bedrooms on the second floor (approx. 11 x 11; 13 x 15; ~13)
- Bathrooms: One full bathroom on the second floor (approx. 9 x 8)
- Heating & cooling: Radiant heating; Gas water heater; Natural gas fuel
- Interior features: Total of 4 rooms; Unfinished basement
Neighborhood map
What this means for you Summary
Snapshot
- This is a 3-bed/2.0-bath single-family listed at $95k.
Deal economics
- At list price, monthly cash flow is $787 ($9k/yr) — positive.
- The deal already cash-flows at list — no discount required.
- Meets the 1% rule at list price ($2k rent vs $95k).
- Recommended offer: $94k (1.5% below list) — sets the bar for market timing.
- Cap rate 16.2% vs local median 10.2% in Detroit — top-decile yield for the area; either an underpriced asset or a hidden risk that comps aren't pricing in. Stress-test before assuming the spread holds.
Location & tenants
- Location reads 73/100 on livability (#218 in MI) — a middle-class / working-renter tenant base. Strengths: amenities A+, commute A+, cost of living A+; Watch: schools F, crime F, employment F.
- Detroit Public Schools Community District (urban): math 10% / reading 24% proficiency, ranked #499 of 540 in MI (top 92%) — low school quality limits family demand, transient renter base, plan for 1-2y turnover; 90% free/reduced lunch — lower-income household profile, screen leases tightly.
- Market conditions: Rents rising fast (+5.2%/yr); 271 active listings in the ZIP; 24 comparable units currently listed for rent nearby; rentals at typical pace (median 17d on market — plan ~3-4 weeks tenant-placement turnaround); 2,639 units permitted in Wayne County in 2024 (1,216 in 5+ unit buildings).
- At $1,719/mo this rent would consume 46% of the median local household income ($45k/yr) (locally 646% of renters already pay >50% of income on rent) — very limited rent-growth headroom before tenants either downsize or default.
Forward outlook
- Local home prices are declining (-3.0%/yr); year-one equity from $657 of loan paydown is wiped out by about $3k of value loss. Plan a longer hold.
- Wayne County population projected at -17% by 2050 — secular population decline; favor cash flow + early exit over multi-decade hold.
- At projected returns (-3.0% appreciation + 5.2% rent growth), your $27k cash investment doubles in ~4 years — after that, you're playing with house money.
Negotiation context
- It's been on market 26 days — a 2% lower offer ($94k) is reasonable based on typical stale-listing flexibility.
Risks & watch-outs
- Watch-outs: built in 1919 — expect roof / HVAC / electrical / plumbing capex.
Questions for the listing agent
- Built in 1919 — when were the roof, HVAC, electrical panel, plumbing, and water heater last replaced?
- Is there a deadline driving the sale (1031 exchange, divorce, estate, relocation)? That informs how much negotiation room exists.
- Schools are F-rated, which usually means shorter tenancies and higher turnover. Who's the typical renter profile here, and what's been the actual vacancy rate?
- Crime grade is F in this area — have there been break-ins, vandalism, or insurance claims at this property in the last 3 years? What carrier currently insures it and at what premium?
- What's the average days-on-market for RENTAL listings here right now (not sales)? A rising rental-DOM trend means longer vacancies and softer asking-rent achievability than the comps imply.
- What's the recent tenant-quality profile in this submarket — average credit score on applications, eviction rate, late-payment / NSF rate, and stable-employment percentage? A property-management company in the area should have these aggregated.
- How much new for-sale + rental construction is in the pipeline within 1–3 miles? Heavy new supply typically softens prices + rents 12–24 months out; constrained supply supports both.
Investment metrics
- 1% rule
- 1.81% ✓
- Cap rate
- 16.23%
- Cash-on-cash
- 35.48%
- DSCR
- 2.58
- GRM
- 4.6
CMA / ARV
- ARV (on-the-fly)
- $127,716
- Comps found
- 12
Show comp detail 12 sales within ~0.75 mi
| Address | Dist | Beds/Ba | Sqft | Sold | Price | $/sf | Match |
|---|---|---|---|---|---|---|---|
| 3739 Montgomery Ave | 0.10mi | 4/2.5 (+1) | 2,189 (-1%) | 15mo | $128,000 | $58 | 75 |
| 2665 Columbus St | 0.48mi | 3/2.0 | 2,228 (+1%) | 3mo | $150,000 | $67 | 73 |
| 3761 Taylor St | 0.45mi | 3/2.0 | 2,145 (-3%) | 7mo | $65,409 | $30 | 69 |
| 4033 Clairmount St | 0.52mi | 3/1.0 | 2,058 (-6%) | 0mo | $150,000 | $73 | 60 |
| 4032 Vicksburg St | 0.15mi | 4/2.0 (+1) | 1,900 (-14%) | 9mo | $248,500 | $131 | 58 |
| 3254 Hogarth St | 0.28mi | 3/1.0 | 2,349 (+7%) | 18mo | $65,000 | $28 | 57 |
| 4676 Vancouver St | 0.58mi | 3/2.0 | 2,143 (-3%) | 17mo | $90,000 | $42 | 55 |
| 4443 Oregon St | 0.40mi | 4/3.0 (+1) | 2,029 (-8%) | 9mo | $65,000 | $32 | 52 |
| 2530 W Philadelphia St | 0.59mi | 3/1.5 | 2,130 (-3%) | 16mo | $110,000 | $52 | 52 |
| 3774 Gladstone St | 0.38mi | 4/1.5 (+1) | 1,957 (-11%) | 10mo | $125,000 | $64 | 49 |
| 8740 Arcadia St | 0.54mi | 3/3.0 | 1,900 (-14%) | 5mo | $52,000 | $27 | 44 |
| 5051 Allendale St | 0.70mi | 3/2.5 | 1,900 (-14%) | 12mo | $138,000 | $73 | 33 |
Match score weights: distance 35% · size 25% · config 20% · recency 20%. Top-matched comps best support the ARV.
Projected returns pro-forma
-3.0% appreciation · 5.2% rent growth · sell at horizon
- IRR
- 33.4%
- Equity multiple
- 2.45×
- Total profit
- $38,563
- Equity at exit
- $14,165
- IRR
- 41.5%
- Equity multiple
- 5.31×
- Total profit
- $114,674
- Equity at exit
- $8,214
Cash invested: $26,600 (down + closing). Projections, not guarantees.
Landlord ↔ Tenant lean methodology
- Overall (STATE)
- 62 Landlord-Friendly
- State Michigan
- 62 Landlord-Friendly · EVEN
- County
- — inherits STATE
- City
- — inherits STATE
ZIP-level market 48206
- Rents YoY
- 5.2%
- Active inventory
- 271
- Price-to-rent
- 4.6×
Monthly cashflow live
- Estimated rent
- $1,719 high interval (Pro) →
- Mortgage (P&I)
- −$498
- Tax from tax record
- −$34 /mo · $409/yr
- Insurance
- −$40
- HOA
- −$0
- Vacancy / Maint / Mgmt
- −$361
- Net cashflow
- $787
Break-even live
UW: 25.0% down · 7.5% · 30yr · 1.5% tax · 5.0% vac · 8.0% maint · 8.0% mgmt
Financing live
Cash to close
- Down payment
- $23,750
- Closing costs
- $2,850
- Reserves months
- —
- Total cash needed
- —
Loan-product check · same deal, 3 products live
Conventional
25% down · 7.5% · 30yr
- Down + closing
- —
- Monthly P&I
- —
- Monthly cashflow
- —
- DSCR
- —
- Eligible?
- —
Personal DTI + credit; lowest rate.
DSCR
20% down · 8.5% · 30yr
- Down + closing
- —
- Monthly P&I
- —
- Monthly cashflow
- —
- DSCR
- —
- Eligible?
- —
No personal income docs; deal must DSCR.
Hard money
10% down · 12.0% · 12mo
- Down + closing
- —
- Monthly P&I
- —
- Monthly cashflow
- —
- DSCR
- —
- Eligible?
- —
Short-term bridge; refi at stabilization.
Rent comps 24 comps
| Address | Beds | Baths | Sqft | Rent | $/sqft | DOM | Units | Dist |
|---|---|---|---|---|---|---|---|---|
| 3786 Carter St Unit 2 Detroit, MI | 3.0 | 1.0 | 1400 | $1,100 | $0.79 | 24d | 1 | 0.31mi |
| 3012 Lothrop Detroit, MI | 2.0 | 1.0 | 1800 | $1,300 | $0.72 | 3d | 1 | 0.44mi |
| 2506 W Euclid St Detroit, MI | 3.0 | 1.0 | 1475 | $1,675 | $1.14 | 44d | 1 | 0.59mi |
| 2504 W Euclid St Unit 2504 Detroit, MI | 3.0 | 1.0 | 1475 | $1,650 | $1.12 | 44d | 1 | 0.59mi |
| 2504 W Euclid St Unit 2506 Detroit, MI | 3.0 | 1.0 | 1475 | $1,675 | $1.14 | 44d | 1 | 0.59mi |
| 2509 Gladstone St Unit 1 Detroit, MI | 3.0 | 2.0 | 3000 | $2,650 | $0.88 | 2d | 1 | 0.65mi |
| 8951 La Salle Blvd Unit NA Detroit, MI | 4.0 | 2.5 | 2440 | $2,500 | $1.02 | 10d | 1 | 0.80mi |
| 8951 La Salle Blvd Detroit, MI | 4.0 | 2.5 | 2440 | $2,500 | $1.02 | 2d | 1 | 0.80mi |
| 5315 Spokane St Detroit, MI | 3.0 | 1.0 | 2110 | $1,200 | $0.57 | 17d | 1 | 0.83mi |
| 2302 Hazelwood St Unit 1 Detroit, MI | 3.0 | 1.0 | 1550 | $1,273 | $0.82 | 24d | 1 | 0.84mi |
| 2047 Seward St Detroit, MI | 3.0 | 1.0 | 1421 | $1,523 | $1.07 | 5d | 1 | 0.88mi |
| 2080 Gladstone St #1 Detroit, MI | 4.0 | 2.0 | 2426 | $3,000 | $1.24 | 2d | 1 | 0.92mi |
| 2925 Calvert St Detroit, MI | 3.0 | 1.0 | 1400 | $1,300 | $0.93 | 17d | 1 | 1.06mi |
| 3241 Lawrence St Detroit, MI | 4.0 | 2.0 | 2636 | $1,800 | $0.68 | 17d | 1 | 1.14mi |
| 3031 Lawrence St Detroit, MI | 4.0 | 1.0 | 1700 | $1,600 | $0.94 | 17d | 1 | 1.16mi |
| 2655 Collingwood St Detroit, MI | 4.0 | 1.5 | 1881 | $2,700 | $1.44 | 2d | 1 | 1.17mi |
| 4426 McGraw Ave Unit 1 Detroit, MI | 3.0 | 1.0 | 1400 | $1,200 | $0.86 | 44d | 1 | 1.17mi |
| 3322 Webb St Unit 1 Detroit, MI | 3.0 | 1.0 | 1656 | $1,350 | $0.82 | 44d | 1 | 1.29mi |
| 3322 Webb St Unit 2 Detroit, MI | 3.0 | 1.0 | 1656 | $1,350 | $0.82 | 44d | 1 | 1.29mi |
| 3322 Webb St Detroit, MI | 3.0 | 1.0 | 1600 | $1,250 | $0.78 | 17d | 1 | 1.29mi |
| 1441 W Euclid St Detroit, MI | 3.0 | 1.0 | 2380 | $2,600 | $1.09 | 24d | 1 | 1.32mi |
| 2045 Calvert St Detroit, MI | 2.0 | 2.0 | 1400 | $1,600 | $1.14 | 44d | 1 | 1.34mi |
| 1418 W Euclid St Detroit, MI | 3.0 | 1.0 | 2264 | $1,200 | $0.53 | 44d | 1 | 1.34mi |
| 1929 Calvert Ave Unit 2 Detroit, MI | 3.0 | 1.0 | 1414 | $1,199 | $0.85 | 15d | 1 | 1.41mi |
Listing history 14 events
-
2026-06-18days on market $95,000 Active 26 DOM
-
2026-06-17days on market $95,000 Active 25 DOM
-
2026-06-15days on market $95,000 Active 23 DOM
-
2026-06-13days on market $95,000 Active 21 DOM
-
2026-06-13pricedays on market $95,000 Active 20 DOM
-
2026-06-09days on market $105,000 Active 17 DOM
-
2026-06-08days on market $105,000 Active 16 DOM
-
2026-06-07days on market $105,000 Active 15 DOM
-
2026-06-04days on market $105,000 Active 12 DOM
-
2026-06-03pricedays on market $105,000 Active 11 DOM
-
2026-06-02days on market $120,000 Active 10 DOM
-
2026-06-01days on market $120,000 Active 9 DOM
-
2026-05-31days on market $120,000 Active 8 DOM
-
2026-05-23historical $120,000
ⓘ Source: listings_history table (triggers on properties + properties_extension) + one-shot
backfill from property_details.listing_events for pre-trigger history.
Tax reassessment forecast MI · Partial reset (capped growth)
- Current annual tax
- $409 · $34/mo
- Projected year-2 tax
- $936 · $78/mo
- Expected delta
- +$527/yr (+$44/mo · 128.8%)
ⓘ Screening estimate from a state-policy table — verify with the county assessor before closing.
Climate risk First Street
- Flood 1/10 Low FEMA zone X (unshaded) · 0% chance over 30 yrs
- Wildfire 1/10 Low
- Heat 3/10 Moderate 7 d/yr ≥97°F today · 15 d/yr by 30 yrs out
- Wind 2/10 Low
- Air quality 4/10 Moderate 4 unhealthy d/yr today · 6 by 30 yrs out
Nearby sold comps map
Loading sold comps map…
Walkable amenities ~0.75 mi
Loading nearby amenities…
Taxation est. · year 1
- Rental income
- $20,634
- − Mortgage interest
- −$5,321
- − Property taxes
- −$409
- − Insurance
- −$475
- − Repairs & maintenance
- −$1,651
- − Management
- −$1,651
- − Depreciation
- −$2,764
- Taxable income
- $8,363
- Est. tax owed @ 24.0%
- −$2,007
- After-tax cash flow
- $7,431/yr
For passive investors: Depreciation is non-cash, so a rental often shows a tax loss while cash-flowing — sheltering income. Rental losses are passive: they offset passive income freely, and up to $25,000/yr can offset ordinary (W-2) income if you actively participate and your MAGI is under $100k (phasing out to $0 by $150k); unused losses carry forward. On sale, claimed depreciation is recaptured at up to 25%, and gains may owe capital-gains tax (a 1031 exchange can defer both). Figures are a year-1 estimate at your 24.0% rate — not tax advice; consult a CPA.
Schools (NCES district)
- District
- Detroit Public Schools Community District
- NCES district ID
- 2601103
- Math proficiency
- 10% ▼ -2.00%
- Reading proficiency
- 24% ▲ 6.00%
- Median HH income
- $25,815
- Composite
- 13.06/100
- National rank
- #9564
- State rank
- #499 of 540 in MI
Livability — Detroit
- Score
- 73/100
- State rank
- #218
- US rank
- #5427
Category grades
Schools grade is shown separately in the Schools card above.
Census & demographics
- Census place
- Detroit, MI
- County
- Wayne County · 1,562,939 people
- City population
- 572,865
- Metro
- Detroit-Warren-Dearborn, MI
- Population (ZIP)
- 15,227
- Household income
- $45,046
- Rent vs Own
- Severe rent burden
- 646.0
Population outlook (Wayne County) Hauer SSP2
- Today (2025)
- 1,675,273 people
- By 2030
- 1,620,300 · -3.3%
- By 2040
- 1,502,341 · -10.3%
- By 2050
- 1,384,039 · -17.4%
- By 2075
- 1,124,592 · -32.9%
- By 2100
- 881,193 · -47.4%
Race, ethnicity, and origin ACS 2023
- Neighborhood character
- Predominantly Black (81%)
- Race & ethnicity
- Black 81% White 12% Two or more races 5% Hispanic / Latino 3%
- Common ancestry
- Iranian 3% Romanian 1% Slovak 1%
- Foreign-born
- 4% · Canada
- Languages at home
- 94% English-only · Spanish 4% Other Indo-European 1%
Political lean MEDSL · Wayne
- 2024 margin
- Strong D (+29.0) · D 62.7% · R 33.7% · Other 3.6%
- 2008→2024 swing
- -20.5pp toward R · 2008: 49.5pp · 2024: 29.0pp
- All cycles
- 2024: D+29.0 2020: D+38.1 2016: D+37.3 2012: D+46.9 2008: D+49.5
Not yet ingested
- Civics
- —
Market trends
- HPI YoY
- ▼ -139.60%
- Current HPI
- 130.9545
- Rent YoY
- ▲ 5.20%
- Metro
- Detroit-Warren-Dearborn, MI
- State GDP YoY
- ▲ 1.37%
- F500 in state
- 28
Industry mix (Fortune 500 HQ in MI)
| Industry | F500 HQs | Revenue |
|---|---|---|
| Automotive Parts | 3 | $48B |
|
||
| Automotive | 2 | $372B |
|
||
| Chemicals | 1 | $45B |
|
||
| Automotive Retail | 1 | $29B |
|
||
| Healthcare / Medical Devices | 1 | $23B |
|
||
| Automotive Technology | 1 | $20B |
|
||
Price history
1 event — show timeline
- 2026-05-23 Coming Soon $120,000 MiRealSource-MiMLS
Property tax history
+4.5%/yrLatest (2025): $409 · -52.0% YoY. Source: county tax records.
Cash-flow waterfall
monthlySold comps — $/sqft
last 12 mo · ≤1 miLoading sold comps…