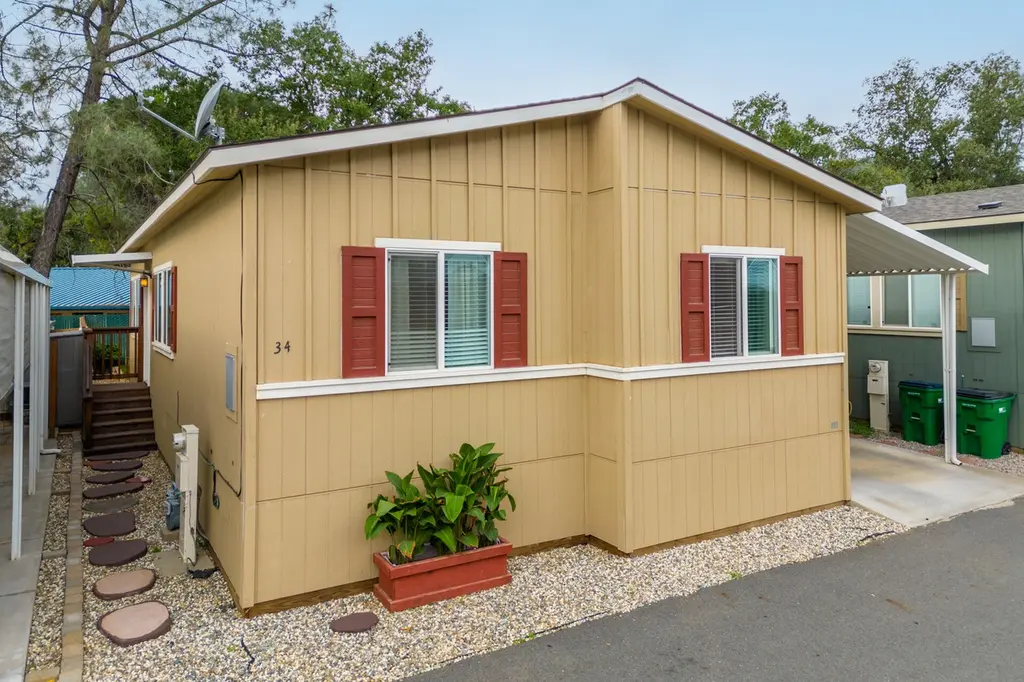
14740 Bass Dr #34 · Mountain Gate, CA
Flood risk 1/10 · Minimal
- FEMA flood zone
- X (unshaded)
- Chance of flooding over 30 yrs
- 0.0%
- Est. flood insurance / yr
- $507 – $1,088
Fire risk 8/10 · Major
- Est. fire insurance / yr
- $659 – $1,223
Heat risk 8/10 · Major
- Hot days now (above 105°F)
- 7 days/yr
- Hot days in 30 yrs
- 18 days/yr
Wind risk 1/10 · Minimal
- Chance of severe wind over 30 yrs
- —
Air-quality risk 10/10 · Severe
- Unhealthy air days now
- 45 days/yr
- Unhealthy air days in 30 yrs
- 48 days/yr
Risk factors via First Street. Map © Google.
Why this score? — see what drove the C+ grade
The composite is a weighted blend of 9 inputs, each scored 0–100. Each bar is that input's sub-score; the figure is the points it added to the 100-point composite (weight × sub-score).
- Cash flow +30.0/30.0
- 1% rule +10.0/10.0
- DSCR +10.0/10.0
- Rent growth +4.0/5.0
- Condition / age +4.0/5.0
- Schools +2.5/10.0
- Livability +2.4/5.0
- ARV discount +0.0/15.0
- Appreciation +0.0/10.0
$119,900
🖨 Deal sheet 📄 Offer letter ✓ Due diligence
Listing remarks MLS
Welcome to this stunning 3-bedroom, 2-bath home built in 2019, nestled in the sought-after Mountain Gate Family Park community with views of the mountains. This well-designed, split floor plan offers an open kitchen perfect for family gatherings. The spacious bedrooms feature large closets, including a walk-in closet in the primary suite. Enjoy a sunny breakfast nook, a formal dining area, and a fully fenced backyard with a cement patio and a storage shed. Plus, there's a covered carport to keep your vehicles protected. Don't miss out on this perfect family home and it is close to Shasta Lake, for the boating and fishing lovers!! Pets welcome with approval! come have a look!!
Key facts
- Breakfast nook
- Storage shed
- Formal dining area
Tags
Neighborhood map
What this means for you Summary
Snapshot
- This is a 3-bed/2.0-bath manufactured listed at $120k. Condition is rated good.
Deal economics
- At list price, monthly cash flow is $851 ($10k/yr) — positive.
- The deal already cash-flows at list — no discount required.
- Meets the 1% rule at list price ($2k rent vs $120k).
- Recommended offer: $113k (6.0% below list) — sets the bar for market timing.
Location & tenants
- Location reads 47/100 on livability (#1,255 in CA) — a working-class tenant base; expect higher turnover. Watch: cost of living D+, schools F, crime F.
- Gateway Unified (suburban): math 25% / reading 35% proficiency, ranked #355 of 517 in CA (top 69%) — families likely to look elsewhere, expect single-tenant / working-renter base with shorter leases.
- Market conditions: Rents rising fast (+6.0%/yr); 391 active listings in the ZIP; 246 units permitted in Shasta County in 2024 (0 in 5+ unit buildings).
- This rent runs 35% of the median local income ($72k/yr) — at the standard rent-burdened threshold; future hikes will face affordability resistance.
Forward outlook
- Local home prices are declining (-3.0%/yr); year-one equity from $829 of loan paydown is wiped out by about $4k of value loss. Plan a longer hold.
- Shasta County population projected to shrink 9% by 2050 — rents likely to lag national; underwrite the cash flow, not the appreciation.
- At projected returns (-3.0% appreciation + 6.0% rent growth), your $34k cash investment doubles in ~4 years — after that, you're playing with house money.
Negotiation context
- It's been on market 77 days — a 6% lower offer ($113k) is reasonable based on typical stale-listing flexibility.
- 5 sale attempts since 7y ago with the ask held roughly flat each time — persistent listings suggest the price (not the market) is what's stuck; bring a comps-based counter.
- Current owner paid $90k; 34% above their basis — modest negotiation headroom, anchor on the comps not their cost.
Risks & watch-outs
- Climate carrying-cost: severe wildfire risk; extreme-heat days projected 7→18/yr by 2055 (HVAC capex compounding) — expect insurance premiums to compound above CPI over the hold.
Questions for the listing agent
- It's been on market 77 days. Have you received any prior offers? Is the seller open to a 6% concession, seller financing, or rate buy-down credit?
- Why hasn't it sold? Are there any deal-killer items the seller is aware of (foundation, flood, title, zoning, code violations)?
- Is there a deadline driving the sale (1031 exchange, divorce, estate, relocation)? That informs how much negotiation room exists.
- Schools are F-rated, which usually means shorter tenancies and higher turnover. Who's the typical renter profile here, and what's been the actual vacancy rate?
- Crime grade is F in this area — have there been break-ins, vandalism, or insurance claims at this property in the last 3 years? What carrier currently insures it and at what premium?
- What's the average days-on-market for RENTAL listings here right now (not sales)? A rising rental-DOM trend means longer vacancies and softer asking-rent achievability than the comps imply.
- What's the recent tenant-quality profile in this submarket — average credit score on applications, eviction rate, late-payment / NSF rate, and stable-employment percentage? A property-management company in the area should have these aggregated.
- How much new for-sale + rental construction is in the pipeline within 1–3 miles? Heavy new supply typically softens prices + rents 12–24 months out; constrained supply supports both.
Investment metrics
- 1% rule
- 1.77% ✓
- Cap rate
- 14.81%
- Cash-on-cash
- 30.41%
- DSCR
- 2.35
- GRM
- 4.7
CMA / ARV
- ARV (median comp)
- $91,631
- List price
- $119,900
- Delta
- 30.85%
- Verdict
- OVERPRICED
- Comps
- 20 within 1.0 mi
Show comp detail 9 sales within ~0.75 mi
| Address | Dist | Beds/Ba | Sqft | Sold | Price | $/sf | Match |
|---|---|---|---|---|---|---|---|
| 14740 Bass Dr #36 | 0.00mi | 3/2.0 | 1,152 (-2%) | 7mo | $119,990 | $104 | 91 |
| 14740 Bass Dr #23 | 0.00mi | 3/2.0 | 1,200 (+2%) | 11mo | $99,000 | $83 | 88 |
| 14740 Bass Dr #8 | 0.00mi | 3/2.0 | 1,064 (-10%) | 3mo | $105,000 | $99 | 82 |
| 14578 Bass Dr #7 | 0.38mi | 3/2.0 | 1,180 (+0%) | 3mo | $55,000 | $47 | 80 |
| 14740 Bass Dr #11 | 0.00mi | 3/2.0 | 1,065 (-9%) | 11mo | $89,000 | $84 | 75 |
| 14740 Bass Dr #4 | 0.02mi | 3/2.0 | 1,296 (+10%) | 13mo | $97,990 | $76 | 71 |
| 14578 Bass Dr #14 | 0.38mi | 3/2.0 | 1,080 (-8%) | 13mo | $40,000 | $37 | 58 |
| 14578 Bass Dr #30 | 0.38mi | 3/2.0 | 1,012 (-14%) | 14mo | $78,000 | $77 | 48 |
| 15005 Wonderland Blvd Blvd | 0.63mi | 2/2.0 (-1) | 1,056 (-10%) | 15mo | $110,000 | $104 | 36 |
Match score weights: distance 35% · size 25% · config 20% · recency 20%. Top-matched comps best support the ARV.
Projected returns pro-forma
-3.0% appreciation · 5.98% rent growth · sell at horizon
- IRR
- 28.4%
- Equity multiple
- 2.23×
- Total profit
- $41,351
- Equity at exit
- $17,877
- IRR
- 37.6%
- Equity multiple
- 5.01×
- Total profit
- $134,545
- Equity at exit
- $10,367
Cash invested: $33,572 (down + closing). Projections, not guarantees.
Landlord ↔ Tenant lean methodology
- Overall (STATE)
- 18 Strongly Tenant-Friendly
- State California
- 18 Strongly Tenant-Friendly · D+13
- County
- — inherits STATE
- City
- — inherits STATE
ZIP-level market 96003
- Rents YoY
- 6.0%
- Active inventory
- 391
- Price-to-rent
- 4.7×
Monthly cashflow live
- Estimated rent
- $2,126 medium interval (Pro) →
- Mortgage (P&I)
- −$629
- Tax est. 1.5%
- −$150 /mo · $1,798/yr
- Insurance
- −$50
- HOA
- −$0
- Vacancy / Maint / Mgmt
- −$446
- Net cashflow
- $851
Break-even live
UW: 25.0% down · 7.5% · 30yr · 1.5% tax · 5.0% vac · 8.0% maint · 8.0% mgmt
Financing live
Cash to close
- Down payment
- $29,975
- Closing costs
- $3,597
- Reserves months
- —
- Total cash needed
- —
Loan-product check · same deal, 3 products live
Conventional
25% down · 7.5% · 30yr
- Down + closing
- —
- Monthly P&I
- —
- Monthly cashflow
- —
- DSCR
- —
- Eligible?
- —
Personal DTI + credit; lowest rate.
DSCR
20% down · 8.5% · 30yr
- Down + closing
- —
- Monthly P&I
- —
- Monthly cashflow
- —
- DSCR
- —
- Eligible?
- —
No personal income docs; deal must DSCR.
Hard money
10% down · 12.0% · 12mo
- Down + closing
- —
- Monthly P&I
- —
- Monthly cashflow
- —
- DSCR
- —
- Eligible?
- —
Short-term bridge; refi at stabilization.
Listing history 24 events
-
2026-06-19days on market $119,900 Active 77 DOM
-
2026-06-18days on market $119,900 Active 76 DOM
-
2026-06-17days on market $119,900 Active 75 DOM
-
2026-06-16days on market $119,900 Active 74 DOM
-
2026-06-15days on market $119,900 Active 73 DOM
-
2026-06-14days on market $119,900 Active 71 DOM
-
2026-06-13days on market $119,900 Active 70 DOM
-
2026-06-10days on market $119,900 Active 68 DOM
-
2026-06-09days on market $119,900 Active 67 DOM
-
2026-06-08days on market $119,900 Active 66 DOM
-
2026-06-07days on market $119,900 Active 65 DOM
-
2026-06-03days on market $119,900 Active 61 DOM
-
2026-06-02days on market $119,900 Active 60 DOM
-
2026-06-01days on market $119,900 Active 59 DOM
-
2026-05-31days on market $119,900 Active 58 DOM
-
2026-05-30days on market $119,900 Active 57 DOM
-
2026-04-03$119,900 Active 685-char remark
Show marketing remark (685 chars)
Welcome to this stunning 3-bedroom, 2-bath home built in 2019, nestled in the sought-after Mountain Gate Family Park community with views of the mountains. This well-designed, split floor plan offers an open kitchen perfect for family gatherings. The spacious bedrooms feature large closets, including a walk-in closet in the primary suite. Enjoy a sunny breakfast nook, a formal dining area, and a fully fenced backyard with a cement patio and a storage shed. Plus, there's a covered carport to keep your vehicles protected. Don't miss out on this perfect family home and it is close to Shasta Lake, for the boating and fishing lovers!! Pets welcome with approval! come have a look!!
-
2024-01-28status Active
-
2024-01-07price $125,000
-
2023-11-20price $128,000
-
2023-10-27$132,000 Active
-
2021-02-01soldstatus $89,500
-
2020-10-27$91,900
-
2019-09-04$91,900
ⓘ Source: listings_history table (triggers on properties + properties_extension) + one-shot
backfill from property_details.listing_events for pre-trigger history.
Climate risk First Street
- Flood 1/10 Low FEMA zone X (unshaded) · 0% chance over 30 yrs
- Wildfire 8/10 Severe
- Heat 8/10 Severe 7 d/yr ≥105°F today · 18 d/yr by 30 yrs out
- Wind 1/10 Low
- Air quality 10/10 Extreme 45 unhealthy d/yr today · 48 by 30 yrs out
Nearby sold comps map
Loading sold comps map…
Walkable amenities ~0.75 mi
Loading nearby amenities…
Taxation est. · year 1
- Rental income
- $25,509
- − Mortgage interest
- −$6,716
- − Property taxes
- −$1,798
- − Insurance
- −$600
- − Repairs & maintenance
- −$2,041
- − Management
- −$2,041
- − Depreciation
- −$3,488
- Taxable income
- $8,825
- Est. tax owed @ 24.0%
- −$2,118
- After-tax cash flow
- $8,091/yr
For passive investors: Depreciation is non-cash, so a rental often shows a tax loss while cash-flowing — sheltering income. Rental losses are passive: they offset passive income freely, and up to $25,000/yr can offset ordinary (W-2) income if you actively participate and your MAGI is under $100k (phasing out to $0 by $150k); unused losses carry forward. On sale, claimed depreciation is recaptured at up to 25%, and gains may owe capital-gains tax (a 1031 exchange can defer both). Figures are a year-1 estimate at your 24.0% rate — not tax advice; consult a CPA.
Condition & rehab AI · 13 photos
This 2019 manufactured home in Mountain Gate is in good condition with a good exterior and interior. It's move-in ready with minor maintenance needed.
Value-add opportunities
- Both Paint exterior — Enhances curb appeal and resale value
- Both Replace carpets — Fresh carpet improves comfort and rental appeal
Renovation cost estimate screening
Value-add ROI direction
- Both Paint exterior — Enhances curb appeal and resale value ↑
- Both Replace carpets — Fresh carpet improves comfort and rental appeal ↑
ⓘ Cost ranges are severity-bucket heuristics (US national rule-of-thumb). Get contractor quotes + a written scope before underwriting a rehab budget.
Schools (NCES district)
- District
- Gateway Unified
- NCES district ID
- 0614950
- Math proficiency
- 25% ▼ -5.00%
- Reading proficiency
- 35% ▲ 2.00%
- Median HH income
- $41,888
- Composite
- 25.39/100
- National rank
- #7465
- State rank
- #355 of 517 in CA
Livability — Mountain Gate
- Score
- 47/100
- State rank
- #1255
- US rank
- #26371
Category grades
Schools grade is shown separately in the Schools card above.
Census & demographics
- Census place
- Mountain Gate, CA
- County
- Shasta County · 147,641 people
- Metro
- Redding, CA
- Population (ZIP)
- 44,923
- Household income
- $72,445
- Rent vs Own
- Severe rent burden
- 1668.0
Population outlook (Shasta County) Hauer SSP2
- Today (2025)
- 179,231 people
- By 2030
- 176,953 · -1.3%
- By 2040
- 169,982 · -5.2%
- By 2050
- 162,547 · -9.3%
- By 2075
- 145,649 · -18.7%
- By 2100
- 123,025 · -31.4%
Race, ethnicity, and origin ACS 2023
- Neighborhood character
- Predominantly White (76%)
- Race & ethnicity
- White 76% Hispanic / Latino 11% Two or more races 10% Asian 4% Native American 1% Black 1%
- Hispanic origin (detail)
- Mexican 7%
- Common ancestry
- Italian 5% Slovak 3% Lithuanian 3%
- Foreign-born
- 6% · Canada, China
- Languages at home
- 92% English-only · Spanish 3% German/W. Germanic 1% Other Asian/Pacific 1%
Political lean MEDSL · Shasta
- 2024 margin
- Solid R (+36.5) · D 30.5% · R 67.0% · Other 2.5%
- 2008→2024 swing
- -10.7pp toward R · 2008: -25.8pp · 2024: -36.5pp
- All cycles
- 2024: R+36.5 2020: R+33.1 2016: R+37.4 2012: R+30.3 2008: R+25.8
Not yet ingested
- Civics
- —
Market trends
- HPI YoY
- ▼ -181.66%
- Current HPI
- 152.3069
- Rent YoY
- ▲ 5.98%
- Metro
- Redding, CA
- State GDP YoY
- ▲ 3.21%
- F500 in state
- 116
Industry mix (Fortune 500 HQ in CA)
| Industry | F500 HQs | Revenue |
|---|---|---|
| Technology | 27 | $1,492B |
|
||
| Financial Services | 3 | $174B |
|
||
| Retail | 3 | $44B |
|
||
| Insurance | 3 | $26B |
|
||
| Media / Entertainment | 2 | $115B |
|
||
| Pharmaceuticals / Biotech | 2 | $62B |
|
||
Price history
+30.5% since first listed8 events — show timeline
- 2026-04-03 Listed $119,900 SAOR
- 2024-01-28 Relisted — SAOR
- 2024-01-07 Price Changed $125,000 SAOR
- 2023-11-20 Price Changed $128,000 SAOR
- 2023-10-27 Listed $132,000 SAOR
- 2021-02-01 Sold (MLS) $89,500 SAOR
- 2020-10-27 Listed $91,900 SAOR
- 2019-09-04 Listed $91,900 SAOR
Cash-flow waterfall
monthlySold comps — $/sqft
last 12 mo · ≤1 miLoading sold comps…