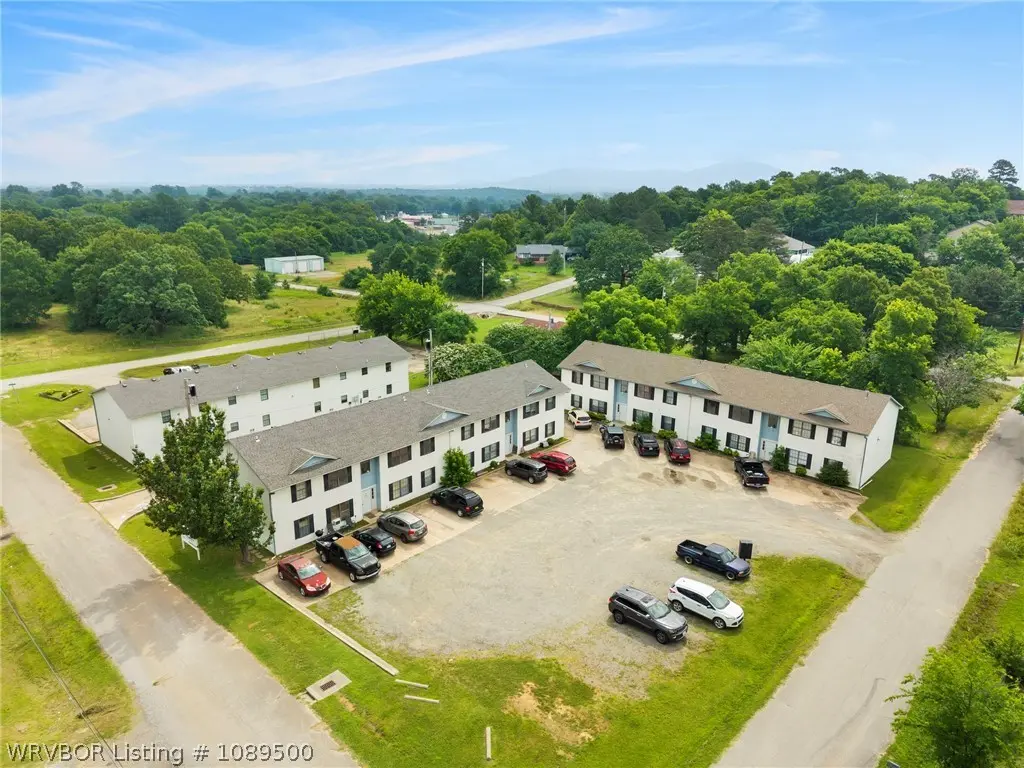
200 Folsom St · Poteau, OK
Flood risk 1/10 · Minimal
- FEMA flood zone
- X (unshaded)
- Chance of flooding over 30 yrs
- 0.0%
- Est. flood insurance / yr
- $507 – $1,088
Fire risk 5/10 · Moderate
- Est. fire insurance / yr
- $2,463 – $4,575
Heat risk 7/10 · Major
- Hot days now (above 114°F)
- 7 days/yr
- Hot days in 30 yrs
- 20 days/yr
Wind risk 2/10 · Minimal
- Chance of severe wind over 30 yrs
- 4.0%
Air-quality risk 2/10 · Minimal
- Unhealthy air days now
- 2 days/yr
- Unhealthy air days in 30 yrs
- 2 days/yr
Risk factors via First Street. Map © Google.
Why this score? — see what drove the F grade
The composite is a weighted blend of 9 inputs, each scored 0–100. Each bar is that input's sub-score; the figure is the points it added to the 100-point composite (weight × sub-score).
- ARV discount +7.5/15.0
- Appreciation +7.1/10.0
- Livability +2.9/5.0
- Rent growth +2.5/5.0
- Schools +2.5/10.0
- Condition / age +2.5/5.0
- Cash flow +0.0/30.0
- 1% rule +0.0/10.0
- DSCR +0.0/10.0
$1,500,000
🖨 Deal sheet (PDF) 📄 Offer letter ✓ Due diligence
Listing remarks MLS
Investment Opportunity – 200 Folsom St, Poteau, OK Explore this excellent investment opportunity in Poteau! This two-story multifamily property offers 24 spacious two-bedroom, one-bath apartments, each with 810 sq ft of living space. Currently rented at $625 per month, this property provides a steady cash flow. All 24 apartments include washer & dryer hook ups. The tenants will be responsible for electric and water bills, while all other expenses are covered within the rent, simplifying management. With a total of 19,440 sq ft, this well-maintained complex is designed for low upkeep and high returns. Whether you're a seasoned investor or looking to start, this property is ideal for long-term growth and profitability. Don’t miss out on this chance to expand your portfolio!
Key facts
- New roof
- Built 1995
- Listed 19 days
Tags
Property features AI
Exterior
- Parking: Concrete parking lot
- Home design: Residential apartment; Two levels
- Construction: Vinyl siding; Shingle roof; Slab foundation; Built with residential apartment construction
- Exterior features: No fencing; Public maintained road access
Interior
- Flooring: Vinyl
- Heating & cooling: Central heating; Central air conditioning
- Interior features: Electric water heater; Vinyl flooring
- Laundry & utility: Electric dryer hookup
Neighborhood map
What this means for you Summary
Snapshot
- This is a townhouse listed at $1.50M.
Deal economics
- At list price, monthly cash flow is $-9k ($-109k/yr) — negative.
- Rent doesn't cover operating costs at any purchase price — skip.
- Recommended offer: $1.48M (1.5% below list) — sets the bar for market timing.
- Cap rate -1.0% vs local median 3.8% in Poteau — below-typical yield; the buyer is paying a premium for something (appreciation thesis, condition, location) that the cap rate doesn't capture.
Location & tenants
- Location reads 57/100 on livability (#485 in OK) — a working-class tenant base; expect higher turnover. Strengths: cost of living A+, housing A+; Watch: crime D+, amenities F, commute F.
- Poteau (town): math 30% / reading 29% proficiency, ranked #68 of 270 in OK (top 25%) — low school quality limits family demand, transient renter base, plan for 1-2y turnover.
- Zoned schools: Poteau Upper Es (math 45% / reading 36%, grade F, #98 of 845 statewide, top 12%, 471 students, 0% FRL); Pansy Kidd Ms (math 22% / reading 30%, grade F, #79 of 345 statewide, top 24%, 280 students, 0% FRL); Poteau Hs (math 22% / reading 32%, grade F, #125 of 447 statewide, top 31%, 636 students, 0% FRL) — zoned schools average 0% FRL vs 54% district-wide (54 pts lower); this property's tenant base skews higher-income than the district average.
- Market conditions: 142 active listings in the ZIP; 73 units permitted in Le Flore County in 2024 (0 in 5+ unit buildings).
Forward outlook
- In year one you build about $74k of equity ($10k loan paydown + $63k appreciation (4.2% local appreciation)).
- Le Flore County population projected at -13% by 2050 — secular population decline; favor cash flow + early exit over multi-decade hold.
- By year 2, paydown + projected appreciation supports a ~$119k cash-out refi (75% LTV) — recoverable capital for the next deal without selling this one.
Negotiation context
- It's been on market 19 days — a 2% lower offer ($1.48M) is reasonable based on typical stale-listing flexibility.
- 5 sale attempts since 2y ago with the ask held roughly flat each time — persistent listings suggest the price (not the market) is what's stuck; bring a comps-based counter.
- Current owner paid $1.16M; 30% above their basis — modest negotiation headroom, anchor on the comps not their cost.
Risks & watch-outs
- Climate carrying-cost: moderate wildfire risk; extreme-heat days projected 7→20/yr by 2055 (HVAC capex compounding) — expect insurance premiums to compound above CPI over the hold.
Questions for the listing agent
- What do current leases actually rent for vs. the listed asking? Can we see a recent rent roll and the last 12 months of T-12 income?
- Is there a deadline driving the sale (1031 exchange, divorce, estate, relocation)? That informs how much negotiation room exists.
- Schools are F-rated, which usually means shorter tenancies and higher turnover. Who's the typical renter profile here, and what's been the actual vacancy rate?
- Crime grade is D in this area — have there been break-ins, vandalism, or insurance claims at this property in the last 3 years? What carrier currently insures it and at what premium?
- The area grade is low — what's the realistic commute time and amenity access for the typical tenant pool here? Any planned neighborhood developments (good or bad) we should know about?
- What's the average days-on-market for RENTAL listings here right now (not sales)? A rising rental-DOM trend means longer vacancies and softer asking-rent achievability than the comps imply.
- What's the recent tenant-quality profile in this submarket — average credit score on applications, eviction rate, late-payment / NSF rate, and stable-employment percentage? A property-management company in the area should have these aggregated.
- How much new for-sale + rental construction is in the pipeline within 1–3 miles? Heavy new supply typically softens prices + rents 12–24 months out; constrained supply supports both.
Investment metrics
- 1% rule
- 0.00% ✗
- Cap rate
- -0.99%
- Cash-on-cash
- -26.02%
- DSCR
- -0.16
- GRM
- 0.0
CMA / ARV
No comps found within radius.
Projected returns pro-forma
4.22% appreciation · 3.0% rent growth · sell at horizon
- IRR
- -11.3%
- Equity multiple
- 0.28×
- Total profit
- $-300,778
- Equity at exit
- $780,095
- IRR
- -4.8%
- Equity multiple
- 0.11×
- Total profit
- $-374,996
- Equity at exit
- $1,291,777
Cash invested: $420,000 (down + closing). Projections, not guarantees.
Landlord ↔ Tenant lean methodology
- Overall (STATE)
- 83 Strongly Landlord-Friendly
- State Oklahoma
- 83 Strongly Landlord-Friendly · R+20
- County
- — inherits STATE
- City
- — inherits STATE
ZIP-level market 74953
- Home prices YoY
- 1.7%
- Active inventory
- 142
Monthly cashflow live
- Estimated rent
- $0 none
- Mortgage (P&I)
- −$7,866
- Tax from tax record
- −$615 /mo · $7,383/yr
- Insurance
- −$625
- HOA
- −$0
- Lot rent
- −$0
- Vacancy / Maint / Mgmt
- −$0
- Net cashflow
- $-9,106
Break-even live
Sensitivity live
| Price | -10% $-8,257 | -5% $-8,682 | +0% $-9,106 | +5% $-9,531 | +10% $-9,956 |
|---|---|---|---|---|---|
| Rent | -10% $-9,106 | -5% $-9,106 | +0% $-9,106 | +5% $-9,106 | +10% $-9,106 |
| Rate | -1.0pp $-8,351 | -0.5pp $-8,725 | base $-9,106 | +0.5pp $-9,495 | +1.0pp $-9,891 |
UW: 25.0% down · 7.5% · 30yr · 1.5% tax · 5.0% vac · 8.0% maint · 8.0% mgmt
Financing live
Cash to close
- Down payment
- $375,000
- Closing costs
- $45,000
- Reserves months
- —
- Total cash needed
- —
Loan-product check · same deal, 3 products live
Conventional
25% down · 7.5% · 30yr
- Down + closing
- —
- Monthly P&I
- —
- Monthly cashflow
- —
- DSCR
- —
- Eligible?
- —
Personal DTI + credit; lowest rate.
DSCR
20% down · 8.5% · 30yr
- Down + closing
- —
- Monthly P&I
- —
- Monthly cashflow
- —
- DSCR
- —
- Eligible?
- —
No personal income docs; deal must DSCR.
Hard money
10% down · 12.0% · 12mo
- Down + closing
- —
- Monthly P&I
- —
- Monthly cashflow
- —
- DSCR
- —
- Eligible?
- —
Short-term bridge; refi at stabilization.
Listing history 15 events
-
2026-06-22days on market $1,500,000 Active 19 DOM
-
2026-06-21days on market $1,500,000 Active 18 DOM
-
2026-06-21days on market $1,500,000 Active 17 DOM
-
2026-06-18days on market $1,500,000 Active 15 DOM
-
2026-06-17days on market $1,500,000 Active 14 DOM
-
2026-06-16days on market $1,500,000 Active 13 DOM
-
2026-06-15days on market $1,500,000 Active 12 DOM
-
2026-06-13days on market $1,500,000 Active 10 DOM
-
2026-06-12days on market $1,500,000 Active 9 DOM
-
2026-06-09days on market $1,500,000 Active 6 DOM
-
2026-06-08days on market $1,500,000 Active 5 DOM
-
2026-06-08days on market $1,500,000 Active 4 DOM
-
2026-06-07days on market $1,500,000 Active 3 DOM
-
2026-06-04remarks 681-char remark
-
2026-06-04$1,500,000 Active 1 DOM
ⓘ Source: listings_history table (triggers on properties + properties_extension) + one-shot
backfill from property_details.listing_events for pre-trigger history.
Tax reassessment forecast OK · Resets to sale price
- Current annual tax
- $7,383 · $615/mo
- Projected year-2 tax
- $13,500 · $1,125/mo
- Expected delta
- +$6,117/yr (+$510/mo · 82.9%)
ⓘ Screening estimate from a state-policy table — verify with the county assessor before closing.
Climate risk First Street
- Flood 1/10 Low FEMA zone X (unshaded) · 0% chance over 30 yrs
- Wildfire 5/10 Major
- Heat 7/10 Severe 7 d/yr ≥114°F today · 20 d/yr by 30 yrs out
- Wind 2/10 Low 4% chance of damaging wind over 30 yrs
- Air quality 2/10 Low 2 unhealthy d/yr today · 2 by 30 yrs out
Nearby sold comps map
Loading sold comps map…
Walkable amenities ~0.75 mi
Loading nearby amenities…
Taxation est. · year 1
- Rental income
- $0
- − Mortgage interest
- −$84,023
- − Property taxes
- −$7,383
- − Insurance
- −$7,500
- − Repairs & maintenance
- −$0
- − Management
- −$0
- − Depreciation
- −$43,636
- Taxable loss
- −$142,543
- Est. tax savings @ 24.0%
- +$34,210
- After-tax cash flow
- $-75,067/yr
For passive investors: Depreciation is non-cash, so a rental often shows a tax loss while cash-flowing — sheltering income. Rental losses are passive: they offset passive income freely, and up to $25,000/yr can offset ordinary (W-2) income if you actively participate and your MAGI is under $100k (phasing out to $0 by $150k); unused losses carry forward. On sale, claimed depreciation is recaptured at up to 25%, and gains may owe capital-gains tax (a 1031 exchange can defer both). Figures are a year-1 estimate at your 24.0% rate — not tax advice; consult a CPA.
Schools (NCES district)
- District
- Poteau
- NCES district ID
- 4024870
- Math proficiency
- 30% ▼ -4.00%
- Reading proficiency
- 29% ▼ -4.00%
- Median HH income
- $42,165
- Composite
- 25.05/100
- National rank
- #7546
- State rank
- #68 of 270 in OK
Livability — Poteau
- Score
- 57/100
- State rank
- #485
- US rank
- #22172
Category grades
Schools grade is shown separately in the Schools card above.
Census & demographics
- Census place
- Poteau, OK
- Population (ZIP)
- 12,284
Population outlook (Le Flore County) Hauer SSP2
- Today (2025)
- 48,504 people
- By 2030
- 47,474 · -2.1%
- By 2040
- 44,914 · -7.4%
- By 2050
- 42,239 · -12.9%
- By 2075
- 35,071 · -27.7%
- By 2100
- 25,949 · -46.5%
Race, ethnicity, and origin ACS 2023
- Neighborhood character
- Predominantly White (70%)
- Race & ethnicity
- White 70% Hispanic / Latino 12% Native American 10% Two or more races 10% Black 1%
- Hispanic origin (detail)
- Mexican 11%
- Common ancestry
- Slovak 2% Iranian 2% Serbian 1%
- Foreign-born
- 7% · Canada
- Languages at home
- 90% English-only · Spanish 10%
Political lean MEDSL · Le Flore
- 2024 margin
- Solid R (+64.8) · D 17.0% · R 81.8% · Other 1.3%
- 2008→2024 swing
- -26.1pp toward R · 2008: -38.6pp · 2024: -64.8pp
- All cycles
- 2024: R+64.8 2020: R+63.4 2016: R+58.7 2012: R+41.1 2008: R+38.6
Not yet ingested
- Civics
- —
Market trends
- HPI YoY
- ▲ 4.22%
- Current HPI
- 252.3937
- Rent YoY
- —
- Metro
- —
- State GDP YoY
- ▲ 1.55%
- F500 in state
- 6
Industry mix (Fortune 500 HQ in OK)
| Industry | F500 HQs | Revenue |
|---|---|---|
| Energy | 3 | $48B |
|
||
Price history
+257.1% since first listed18 events — show timeline
- 2026-06-03 Listed $1,500,000 WRVBOR
- 2026-02-28 Rental Removed $725 RENTALBEAST
- 2026-02-22 Listed for Rent $725 RENTALBEAST
- 2025-10-08 Rental Removed $700 RENTALBEAST
- 2025-09-27 Price Changed $700 RENTALBEAST
- 2025-09-26 Listed for Rent $725 RENTALBEAST
- 2025-08-04 Rental Removed $700 RENTALBEAST
- 2025-07-27 Price Changed $700 RENTALBEAST
- 2025-07-14 Listed for Rent $725 RENTALBEAST
- 2025-04-25 Sold (Public Records) $3,475,000 Public Records
- 2025-04-25 Sold (MLS) $1,155,800 WRVBOR
- 2025-01-30 Pending — WRVBOR
- 2025-01-13 Sold (Public Records) $1,025,000 Public Records
- 2024-09-06 Listed $1,299,000 WRVBOR
- 2022-03-30 Sold (Public Records) $4,055,000 Public Records
- 2022-03-16 Price Changed $495 RENT.
- 2014-12-16 Sold (Public Records) $695,000 Public Records
- 2012-02-28 Sold (Public Records) $420,000 Public Records
Property tax history
+1.5%/yrLatest (2025): $7,383 · +4.8% YoY. Source: county tax records.
Cash-flow waterfall
monthlySold comps — $/sqft
last 12 mo · ≤1 miLoading sold comps…