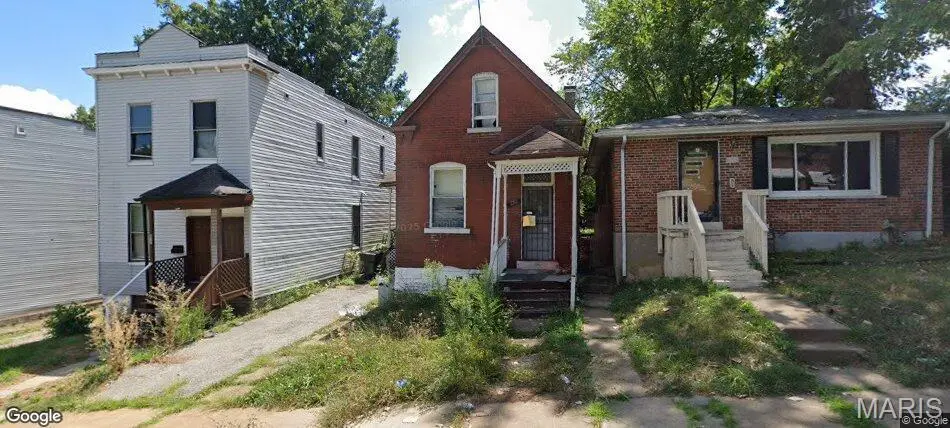
854 Canaan Ave · St. Louis, MO
Flood risk 1/10 · Minimal
- FEMA flood zone
- X (unshaded)
- Chance of flooding over 30 yrs
- 0.0%
- Est. flood insurance / yr
- $473 – $860
Fire risk 1/10 · Minimal
- Est. fire insurance / yr
- $1,054 – $1,958
Heat risk 5/10 · Moderate
- Hot days now (above 107°F)
- 7 days/yr
- Hot days in 30 yrs
- 21 days/yr
Wind risk 2/10 · Minimal
- Chance of severe wind over 30 yrs
- 1.0%
Air-quality risk 4/10 · Minor
- Unhealthy air days now
- 5 days/yr
- Unhealthy air days in 30 yrs
- 6 days/yr
Risk factors via First Street. Map © Google.
Why this score? — see what drove the B- grade
The composite is a weighted blend of 9 inputs, each scored 0–100. Each bar is that input's sub-score; the figure is the points it added to the 100-point composite (weight × sub-score).
- Cash flow +30.0/30.0
- 1% rule +10.0/10.0
- DSCR +10.0/10.0
- ARV discount +7.5/15.0
- Rent growth +2.5/5.0
- Livability +2.5/5.0
- Condition / age +2.5/5.0
- Schools +1.2/10.0
- Appreciation +0.0/10.0
$85,000
🖨 Deal sheet (PDF) 📄 Offer letter ✓ Due diligence
Listing remarks
Whether you're a first-time investor or looking to expand your portfolio, this income-producing property presents an excellent opportunity. The property at 1854 Canaan, Saint Louis, MO 63147, St Louis County, is a Single Family Home built in 1912, featuring 1 bath, 3911 square feet of lot size, and 2 stories. Priced to sell, this investment offers strong potential and long-term value. The property is being sold AS IS, making it an ideal option for investors seeking a competitively priced asset. Additionally, this home is one of several investment properties available from the same owner, creating a unique opportunity to purchase multiple properties as part of a larger portfolio. Contact us
Key facts
- 4,112 sq ft lot
- Built 1912
- Listed 3 days
Property features AI
Finance
- Other: Above grade finished area reported as 1,033 (source: Assessor); Living area reported as 1,033 (source: Assessor)
- Financial info: No second mortgage reported
Exterior
- Utilities: Public water; Public sewer; Electric service by Ameren; Electricity available; Natural gas available
- Home design: Single family residence; Two levels
- Construction: Brick construction
- Exterior features: Back yard
Interior
- Bedrooms: 8 bedrooms total; 2 bedrooms on the main level; 2 bedrooms on the upper level; 4 bedrooms on the lower level; 4 main and upper level bedrooms (combined count)
- Bathrooms: 1 full bathroom total; 1 full bathroom on the main level
- Heating & cooling: Forced air heating; Central air conditioning
- Interior features: Concrete basement
Neighborhood map
What this means for you Summary
Snapshot
- This is a 8-bed/1.0-bath single-family listed at $85k.
Deal economics
- At list price, monthly cash flow is $688 ($8k/yr) — positive.
- The deal already cash-flows at list — no discount required.
- Meets the 1% rule at list price ($2k rent vs $85k).
- Cap rate 16.0% vs local median 5.0% in St. Louis — top-decile yield for the area; either an underpriced asset or a hidden risk that comps aren't pricing in. Stress-test before assuming the spread holds.
Location & tenants
- Location reads: area grade B — affects rentability + tenant quality, not the cash-flow math above.
- St. Louis City (urban): math 10% / reading 18% proficiency, ranked #312 of 324 in MO (top 96%) — low school quality limits family demand, transient renter base, plan for 1-2y turnover; 80% free/reduced lunch — lower-income household profile, screen leases tightly.
- Zoned schools: Herzog Elem. (math 2% / reading 8%, grade F, #1,072 of 1,115 statewide, top 98%, 247 students, 99% FRL); Gateway Middle (math 0% / reading 8%, grade F, #389 of 391 statewide, top 100%, 506 students, 99% FRL); Vashon High (math 2% / reading 2%, grade F, #520 of 521 statewide, top 100%, 568 students, 100% FRL) — zoned schools average 99% FRL vs 80% district-wide (19 pts higher); higher-poverty schools than district average — tighter screening recommended.
- Market conditions: 57 active listings in the ZIP; lower-income renter base — watch delinquency; 294 units permitted in St. Louis city in 2024 (227 in 5+ unit buildings).
- This rent runs 44% of the median local income ($41k/yr) — at the standard rent-burdened threshold; future hikes will face affordability resistance.
Forward outlook
- Local home prices are declining (-3.0%/yr); year-one equity from $588 of loan paydown is wiped out by about $3k of value loss. Plan a longer hold.
- St. Louis County population projected to shrink 6% by 2050 — rents likely to lag national; underwrite the cash flow, not the appreciation.
- At projected returns (-3.0% appreciation + 3.0% rent growth), your $24k cash investment doubles in ~4 years — after that, you're playing with house money.
Negotiation context
- Only 4 days on market — expect competitive offers; lowballing is unlikely to land.
- 7 sale attempts since 2y ago with the ask held roughly flat each time — persistent listings suggest the price (not the market) is what's stuck; bring a comps-based counter.
- Current owner paid $50k; list at $85k implies a 70% gain — meaningful room to come down on a strong offer.
Risks & watch-outs
- Watch-outs: built in 1912 — expect roof / HVAC / electrical / plumbing capex.
- Climate carrying-cost: extreme-heat days projected 7→21/yr by 2055 (HVAC capex compounding) — expect insurance premiums to compound above CPI over the hold.
Questions for the listing agent
- Built in 1912 — when were the roof, HVAC, electrical panel, plumbing, and water heater last replaced?
- Is there a deadline driving the sale (1031 exchange, divorce, estate, relocation)? That informs how much negotiation room exists.
- What's the average days-on-market for RENTAL listings here right now (not sales)? A rising rental-DOM trend means longer vacancies and softer asking-rent achievability than the comps imply.
- What's the recent tenant-quality profile in this submarket — average credit score on applications, eviction rate, late-payment / NSF rate, and stable-employment percentage? A property-management company in the area should have these aggregated.
- How much new for-sale + rental construction is in the pipeline within 1–3 miles? Heavy new supply typically softens prices + rents 12–24 months out; constrained supply supports both.
Investment metrics
- 1% rule
- 1.77% ✓
- Cap rate
- 16.00%
- Cash-on-cash
- 34.67%
- DSCR
- 2.54
- GRM
- 4.7
CMA / ARV
No comps found within radius.
Projected returns pro-forma
-3.0% appreciation · 3.0% rent growth · sell at horizon
- IRR
- 30.1%
- Equity multiple
- 2.26×
- Total profit
- $29,992
- Equity at exit
- $12,674
- IRR
- 37.4%
- Equity multiple
- 4.46×
- Total profit
- $82,388
- Equity at exit
- $7,349
Cash invested: $23,800 (down + closing). Projections, not guarantees.
Landlord ↔ Tenant lean methodology
- Overall (STATE)
- 81 Strongly Landlord-Friendly
- State Missouri
- 81 Strongly Landlord-Friendly · R+10
- County
- — inherits STATE
- City
- — inherits STATE
ZIP-level market 63147
- Home prices YoY
- -31.4%
- Active inventory
- 57
- Price-to-rent
- 4.7×
Monthly cashflow live
- Estimated rent
- $1,506 medium interval (Pro) →
- Mortgage (P&I)
- −$446
- Tax from tax record
- −$21 /mo · $249/yr
- Insurance
- −$35
- HOA
- −$0
- Vacancy / Maint / Mgmt
- −$316
- Net cashflow
- $688
Break-even live
Sensitivity live
| Price | -10% $736 | -5% $712 | +0% $688 | +5% $664 | +10% $640 |
|---|---|---|---|---|---|
| Rent | -10% $569 | -5% $628 | +0% $688 | +5% $747 | +10% $807 |
| Rate | -1.0pp $730 | -0.5pp $709 | base $688 | +0.5pp $666 | +1.0pp $643 |
UW: 25.0% down · 7.5% · 30yr · 1.5% tax · 5.0% vac · 8.0% maint · 8.0% mgmt
Financing live
Cash to close
- Down payment
- $21,250
- Closing costs
- $2,550
- Reserves months
- —
- Total cash needed
- —
Loan-product check · same deal, 3 products live
Conventional
25% down · 7.5% · 30yr
- Down + closing
- —
- Monthly P&I
- —
- Monthly cashflow
- —
- DSCR
- —
- Eligible?
- —
Personal DTI + credit; lowest rate.
DSCR
20% down · 8.5% · 30yr
- Down + closing
- —
- Monthly P&I
- —
- Monthly cashflow
- —
- DSCR
- —
- Eligible?
- —
No personal income docs; deal must DSCR.
Hard money
10% down · 12.0% · 12mo
- Down + closing
- —
- Monthly P&I
- —
- Monthly cashflow
- —
- DSCR
- —
- Eligible?
- —
Short-term bridge; refi at stabilization.
Listing history 4 events
-
2026-06-21days on market $85,000 Active 4 DOM
-
2026-06-18status $85,000 Active 1 DOM
-
2026-06-18remarks 699-char remark
-
2026-06-18$85,000 Coming Soon 1 DOM
ⓘ Source: listings_history table (triggers on properties + properties_extension) + one-shot
backfill from property_details.listing_events for pre-trigger history.
Tax reassessment forecast MO · Resets to sale price
- Current annual tax
- $249 · $21/mo
- Projected year-2 tax
- $824 · $69/mo
- Expected delta
- +$575/yr (+$48/mo · 230.8%)
ⓘ Screening estimate from a state-policy table — verify with the county assessor before closing.
Climate risk First Street
- Flood 1/10 Low FEMA zone X (unshaded) · 0% chance over 30 yrs
- Wildfire 1/10 Low
- Heat 5/10 Major 7 d/yr ≥107°F today · 21 d/yr by 30 yrs out
- Wind 2/10 Low 100% chance of damaging wind over 30 yrs
- Air quality 4/10 Moderate 5 unhealthy d/yr today · 6 by 30 yrs out
Nearby sold comps map
Loading sold comps map…
Walkable amenities ~0.75 mi
Loading nearby amenities…
Taxation est. · year 1
- Rental income
- $18,069
- − Mortgage interest
- −$4,761
- − Property taxes
- −$249
- − Insurance
- −$425
- − Repairs & maintenance
- −$1,446
- − Management
- −$1,446
- − Depreciation
- −$2,473
- Taxable income
- $7,270
- Est. tax owed @ 24.0%
- −$1,745
- After-tax cash flow
- $6,507/yr
For passive investors: Depreciation is non-cash, so a rental often shows a tax loss while cash-flowing — sheltering income. Rental losses are passive: they offset passive income freely, and up to $25,000/yr can offset ordinary (W-2) income if you actively participate and your MAGI is under $100k (phasing out to $0 by $150k); unused losses carry forward. On sale, claimed depreciation is recaptured at up to 25%, and gains may owe capital-gains tax (a 1031 exchange can defer both). Figures are a year-1 estimate at your 24.0% rate — not tax advice; consult a CPA.
Schools (NCES district)
- District
- St. Louis City
- NCES district ID
- 2929280
- Math proficiency
- 10% ▼ -6.00%
- Reading proficiency
- 18% ▼ -3.00%
- Median HH income
- $35,685
- Composite
- 11.54/100
- National rank
- #9699
- State rank
- #312 of 324 in MO
Livability — St. Louis
No livability data for this city. (Only ~50 U.S. cities are tracked.)
Census & demographics
- Census place
- St. Louis, MO
- County
- Saint Louis City · 254,015 people
- City population
- 283,259
- Metro
- St. Louis, MO-IL
- Population (ZIP)
- 8,173
- Household income
- $41,182
- Rent vs Own
- Severe rent burden
- 418.0
Population outlook (St. Louis County) Hauer SSP2
- Today (2025)
- 315,737 people
- By 2030
- 313,865 · -0.6%
- By 2040
- 305,439 · -3.3%
- By 2050
- 296,529 · -6.1%
- By 2075
- 271,028 · -14.2%
- By 2100
- 255,359 · -19.1%
Race, ethnicity, and origin ACS 2023
- Neighborhood character
- Predominantly Black (92%)
- Race & ethnicity
- Black 92% White 5% Two or more races 2%
- Foreign-born
- 0%
- Languages at home
- 99% English-only · Spanish 1%
Political lean MEDSL · St. Louis
- 2024 margin
- Solid D (+64.7) · D 81.4% · R 16.7% · Other 2.0%
- 2008→2024 swing
- -3.5pp toward R · 2008: 68.2pp · 2024: 64.7pp
- All cycles
- 2024: D+64.7 2020: D+66.2 2016: D+63.7 2012: D+66.6 2008: D+68.2
Not yet ingested
- Civics
- —
Market trends
- HPI YoY
- ▼ -38.51%
- Current HPI
- 84.224
- Rent YoY
- —
- Metro
- St. Louis, MO-IL
- State GDP YoY
- ▲ 1.84%
- F500 in state
- 20
Industry mix (Fortune 500 HQ in MO)
| Industry | F500 HQs | Revenue |
|---|---|---|
| Healthcare | 1 | $163B |
|
||
| Insurance | 1 | $21B |
|
||
| Industrial Technology | 1 | $17B |
|
||
| Retail | 1 | $16B |
|
||
| Industrial Distribution | 1 | $10B |
|
||
| Utilities | 1 | $9B |
|
||
Price history
+325.0% since first listed21 events — show timeline
- 2026-06-18 Listed $85,000 MARIS as Distributed by MLS Grid
- 2026-06-18 Coming Soon $85,000 MARIS as Distributed by MLS Grid
- 2025-11-19 Price Changed $95,000 MARIS as Distributed by MLS Grid
- 2025-10-17 Listed $100,000 MARIS as Distributed by MLS Grid
- 2025-03-02 Relisted — MARIS as Distributed by MLS Grid
- 2025-02-01 Delisted — MARIS as Distributed by MLS Grid
- 2024-11-01 Relisted — MARIS as Distributed by MLS Grid
- 2024-11-01 Delisted — MARIS as Distributed by MLS Grid
- 2024-09-02 Relisted — MARIS as Distributed by MLS Grid
- 2024-09-01 Delisted — MARIS as Distributed by MLS Grid
- 2024-06-10 Relisted — MARIS as Distributed by MLS Grid
- 2024-06-08 Delisted — MARIS as Distributed by MLS Grid
- 2024-05-29 Price Changed $100,000 MARIS as Distributed by MLS Grid
- 2024-04-06 Listed $125,000 MARIS as Distributed by MLS Grid
- 2022-03-01 Sold (Public Records) $50,000 Public Records
- 2021-11-18 Sold (Public Records) $33,000 Public Records
- 2021-09-14 Sold (Public Records) $16,000 Public Records
- 2000-09-14 Sold (Public Records) — Public Records
- 1999-06-07 Sold (Public Records) $42,884 Public Records
- 1993-12-27 Sold (Public Records) — Public Records
- 1992-03-26 Sold (Public Records) $20,000 Public Records
Property tax history
-4.5%/yrLatest (2023): $249 · -0.5% YoY. Source: county tax records.
Cash-flow waterfall
monthlySold comps — $/sqft
last 12 mo · ≤1 miLoading sold comps…