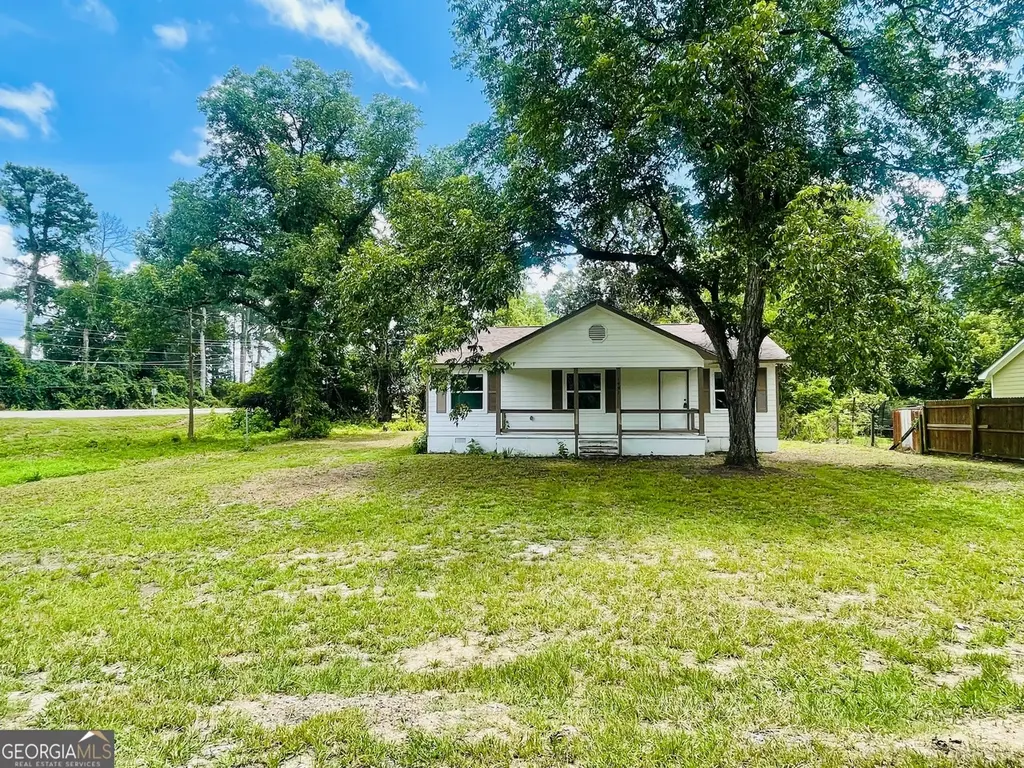
1995 Crooms Dr · Macon-Bibb County, GA
Flood risk 1/10 · Minimal
- FEMA flood zone
- X (unshaded)
- Chance of flooding over 30 yrs
- 0.0%
- Est. flood insurance / yr
- $507 – $1,088
Fire risk 2/10 · Minimal
- Est. fire insurance / yr
- $963 – $1,789
Heat risk 7/10 · Major
- Hot days now (above 108°F)
- 7 days/yr
- Hot days in 30 yrs
- 17 days/yr
Wind risk 6/10 · Moderate
- Chance of severe wind over 30 yrs
- 68.0%
Air-quality risk 4/10 · Minor
- Unhealthy air days now
- 5 days/yr
- Unhealthy air days in 30 yrs
- 5 days/yr
Risk factors via First Street. Map © Google.
Why this score? — see what drove the C grade
The composite is a weighted blend of 9 inputs, each scored 0–100. Each bar is that input's sub-score; the figure is the points it added to the 100-point composite (weight × sub-score).
- Cash flow +21.6/30.0
- ARV discount +7.5/15.0
- Appreciation +7.2/10.0
- DSCR +6.9/10.0
- Rent growth +5.0/5.0
- 1% rule +4.5/10.0
- Livability +2.5/5.0
- Condition / age +2.5/5.0
- Schools +1.2/10.0
$135,000
🖨 Deal sheet 📄 Offer letter ✓ Due diligence
Listing remarks
Fully remodeled 3BR/2BA ranch on a spacious corner lot! Features include new stainless steel appliances, updated kitchen and baths with stone showers, laminate flooring, and abundant natural light. New HVAC and water heater. Conveniently located near I-16 and downtown Macon. Move-in ready with seller concessions available!
Key facts
- Laminate flooring
- Remodeled ranch
- Spacious corner lot
Tags
Property features AI
Finance
- Other: Lot about 0.37 acres
- HOA & community: No HOA
Exterior
- Parking: Off-street parking
- Utilities: Public water; Public sewer; Electricity available on property
- Home design: Single-family residence; One level; House; Updated/remodeled
- Construction: Built in 1985; Vinyl siding; Slate roof; No basement
- Exterior features: Corner lot
Interior
- Kitchen: Microwave
- Bedrooms: 3 bedrooms on the main level
- Flooring: Vinyl flooring
- Bathrooms: 2 full bathrooms on the main level
- Heating & cooling: Central heating; Central air conditioning
- Interior features: Separate shower; Den
- Laundry & utility: Laundry in hall
Neighborhood map
What this means for you Summary
Snapshot
- This is a 3-bed/1.0-bath single-family listed at $135k.
Deal economics
- At list price, monthly cash flow is $204 ($2k/yr) — positive.
- The deal already cash-flows at list — no discount required.
- To meet the 1% rule (rent ≥ 1% of price), the offer needs to be $128k (4.8% below list).
- Recommended offer: $128k (4.8% below list) — sets the bar for 1% rule.
- Cap rate 8.1% vs local median 5.4% in Macon-Bibb County — top-decile yield for the area; either an underpriced asset or a hidden risk that comps aren't pricing in. Stress-test before assuming the spread holds.
Location & tenants
- Location reads: area grade C — affects rentability + tenant quality, not the cash-flow math above.
- Bibb County (urban): math 11% / reading 18% proficiency, ranked #161 of 174 in GA (top 92%) — low school quality limits family demand, transient renter base, plan for 1-2y turnover; 75% free/reduced lunch — lower-income household profile, screen leases tightly.
- Zoned schools: Bernd Elementary School (math 8% / reading 12%, grade F, #1,092 of 1,228 statewide, top 91%, 415 students, 100% FRL); Appling Middle School (math 7% / reading 14%, grade F, #429 of 470 statewide, top 91%, 648 students, 100% FRL); Northeast High School (math 2% / reading 5%, grade F, #413 of 424 statewide, top 99%, 742 students, 100% FRL) — zoned schools average 100% FRL vs 75% district-wide (25 pts higher); higher-poverty schools than district average — tighter screening recommended.
- Market conditions: Rents rising fast (+10.8%/yr); 122 active listings in the ZIP; lower-income renter base — watch delinquency; 154 units permitted in Bibb County in 2024 (0 in 5+ unit buildings).
- This rent runs 34% of the median local income ($45k/yr) — at the standard rent-burdened threshold; future hikes will face affordability resistance.
Forward outlook
- In year one you build about $7k of equity ($933 loan paydown + $6k appreciation (4.3% local appreciation)).
- Bibb County population projected at -12% by 2050 — secular population decline; favor cash flow + early exit over multi-decade hold.
- At projected returns (4.3% appreciation + 8.0% rent growth), your $38k cash investment doubles in ~4 years — after that, you're playing with house money.
- By year 6, paydown + projected appreciation supports a ~$36k cash-out refi (75% LTV) — recoverable capital for the next deal without selling this one.
Negotiation context
- Only 2 days on market — expect competitive offers; lowballing is unlikely to land.
- 5 sale attempts with the ask held roughly flat each time — persistent listings suggest the price (not the market) is what's stuck; bring a comps-based counter.
Risks & watch-outs
- Climate carrying-cost: major wind risk, 68% chance of damaging wind over 30y; extreme-heat days projected 7→17/yr by 2055 (HVAC capex compounding) — expect insurance premiums to compound above CPI over the hold.
Questions for the listing agent
- Is there a deadline driving the sale (1031 exchange, divorce, estate, relocation)? That informs how much negotiation room exists.
- What's the average days-on-market for RENTAL listings here right now (not sales)? A rising rental-DOM trend means longer vacancies and softer asking-rent achievability than the comps imply.
- What's the recent tenant-quality profile in this submarket — average credit score on applications, eviction rate, late-payment / NSF rate, and stable-employment percentage? A property-management company in the area should have these aggregated.
- How much new for-sale + rental construction is in the pipeline within 1–3 miles? Heavy new supply typically softens prices + rents 12–24 months out; constrained supply supports both.
Investment metrics
- 1% rule
- 0.95% ✗
- Cap rate
- 8.11%
- Cash-on-cash
- 6.48%
- DSCR
- 1.29
- GRM
- 8.8
CMA / ARV
- ARV (median comp)
- $80,324
- List price
- $135,000
- Delta
- 68.07%
- Verdict
- OVERPRICED
- Comps
- 7 within 1.0 mi
Projected returns pro-forma
4.31% appreciation · 8.0% rent growth · sell at horizon
- IRR
- 19.3%
- Equity multiple
- 2.21×
- Total profit
- $45,616
- Equity at exit
- $70,924
- IRR
- 21.7%
- Equity multiple
- 4.85×
- Total profit
- $145,543
- Equity at exit
- $118,024
Cash invested: $37,800 (down + closing). Projections, not guarantees.
Landlord ↔ Tenant lean methodology
- Overall (STATE)
- 90 Strongly Landlord-Friendly
- State Georgia
- 90 Strongly Landlord-Friendly · R+3
- County
- — inherits STATE
- City
- — inherits STATE
ZIP-level market 31217
- Home prices YoY
- 2.1%
- Rents YoY
- 10.8%
- Active inventory
- 122
- Price-to-rent
- 8.8×
Monthly cashflow live
- Estimated rent
- $1,285 medium interval (Pro) →
- Mortgage (P&I)
- −$708
- Tax from tax record
- −$46 /mo · $558/yr
- Insurance
- −$56
- HOA
- −$0
- Vacancy / Maint / Mgmt
- −$270
- Net cashflow
- $204
Break-even live
UW: 25.0% down · 7.5% · 30yr · 1.5% tax · 5.0% vac · 8.0% maint · 8.0% mgmt
Financing live
Cash to close
- Down payment
- $33,750
- Closing costs
- $4,050
- Reserves months
- —
- Total cash needed
- —
Loan-product check · same deal, 3 products live
Conventional
25% down · 7.5% · 30yr
- Down + closing
- —
- Monthly P&I
- —
- Monthly cashflow
- —
- DSCR
- —
- Eligible?
- —
Personal DTI + credit; lowest rate.
DSCR
20% down · 8.5% · 30yr
- Down + closing
- —
- Monthly P&I
- —
- Monthly cashflow
- —
- DSCR
- —
- Eligible?
- —
No personal income docs; deal must DSCR.
Hard money
10% down · 12.0% · 12mo
- Down + closing
- —
- Monthly P&I
- —
- Monthly cashflow
- —
- DSCR
- —
- Eligible?
- —
Short-term bridge; refi at stabilization.
Listing history 16 events
-
2026-05-04status Under Contract 324-char remark
-
2026-04-30$135,000 New 324-char remark
-
2026-03-17historical
-
2026-02-18status Price Change
-
2026-02-18price $135,000
-
2026-01-31historical
-
2025-12-06status Back On Market
-
2025-11-30historical
-
2025-10-29historical Active Under Contract
-
2025-10-08price $145,000
-
2025-10-06$155,000 New
-
2025-09-01historical
-
2025-08-01price $145,000
-
2025-07-03price $155,000
-
2025-07-01$145,000 New
-
1999-03-26soldstatus $57,000
ⓘ Source: listings_history table (triggers on properties + properties_extension) + one-shot
backfill from property_details.listing_events for pre-trigger history.
Tax reassessment forecast GA · Resets to sale price
- Current annual tax
- $558 · $46/mo
- Projected year-2 tax
- $1,242 · $104/mo
- Expected delta
- +$684/yr (+$57/mo · 122.7%)
ⓘ Screening estimate from a state-policy table — verify with the county assessor before closing.
Climate risk First Street
- Flood 1/10 Low FEMA zone X (unshaded) · 0% chance over 30 yrs
- Wildfire 2/10 Low
- Heat 7/10 Severe 7 d/yr ≥108°F today · 17 d/yr by 30 yrs out
- Wind 6/10 Major 68% chance of damaging wind over 30 yrs
- Air quality 4/10 Moderate 5 unhealthy d/yr today · 5 by 30 yrs out
Nearby sold comps map
Loading sold comps map…
Walkable amenities ~0.75 mi
Loading nearby amenities…
Taxation est. · year 1
- Rental income
- $15,417
- − Mortgage interest
- −$7,562
- − Property taxes
- −$558
- − Insurance
- −$675
- − Repairs & maintenance
- −$1,233
- − Management
- −$1,233
- − Depreciation
- −$3,927
- Taxable income
- $228
- Est. tax owed @ 24.0%
- −$55
- After-tax cash flow
- $2,396/yr
For passive investors: Depreciation is non-cash, so a rental often shows a tax loss while cash-flowing — sheltering income. Rental losses are passive: they offset passive income freely, and up to $25,000/yr can offset ordinary (W-2) income if you actively participate and your MAGI is under $100k (phasing out to $0 by $150k); unused losses carry forward. On sale, claimed depreciation is recaptured at up to 25%, and gains may owe capital-gains tax (a 1031 exchange can defer both). Figures are a year-1 estimate at your 24.0% rate — not tax advice; consult a CPA.
Schools (NCES district)
- District
- Bibb County
- NCES district ID
- 1300420
- Math proficiency
- 11% ▼ -14.00%
- Reading proficiency
- 18% ▼ -11.00%
- Median HH income
- $37,426
- Composite
- 12.13/100
- National rank
- #9654
- State rank
- #161 of 174 in GA
Livability — Macon-Bibb County
No livability data for this city. (Only ~50 U.S. cities are tracked.)
Census & demographics
- Census place
- Macon-Bibb County, GA
- County
- Bibb County · 164,332 people
- City population
- 143,186
- Metro
- Macon-Bibb County, GA
- Population (ZIP)
- 17,732
- Household income
- $44,809
- Rent vs Own
- Severe rent burden
- 391.0
Population outlook (Bibb County) Hauer SSP2
- Today (2025)
- 148,772 people
- By 2030
- 145,904 · -1.9%
- By 2040
- 139,404 · -6.3%
- By 2050
- 131,603 · -11.5%
- By 2075
- 111,050 · -25.4%
- By 2100
- 83,346 · -44.0%
Race, ethnicity, and origin ACS 2023
- Neighborhood character
- Majority Black (57%)
- Race & ethnicity
- Black 57% White 38% Two or more races 4% Hispanic / Latino 2%
- Common ancestry
- Slovak 1% Italian 1%
- Foreign-born
- 1% · Canada
- Languages at home
- 98% English-only · Spanish 1%
Political lean MEDSL · Bibb
- 2024 margin
- Strong D (+22.4) · D 61.0% · R 38.5%
- 2008→2024 swing
- +4.4pp toward D · 2008: 18.0pp · 2024: 22.4pp
- All cycles
- 2024: D+22.4 2020: D+23.8 2016: D+20.2 2012: D+20.0 2008: D+18.0
Not yet ingested
- Civics
- —
Market trends
- HPI YoY
- ▲ 4.31%
- Current HPI
- 209.9166
- Rent YoY
- ▲ 10.85%
- Metro
- Macon-Bibb County, GA
- State GDP YoY
- ▲ 2.66%
- F500 in state
- 28
Industry mix (Fortune 500 HQ in GA)
| Industry | F500 HQs | Revenue |
|---|---|---|
| Paper / Packaging | 2 | $29B |
|
||
| Retail | 1 | $160B |
|
||
| Transportation / Logistics | 1 | $91B |
|
||
| Airlines | 1 | $62B |
|
||
| Consumer Goods | 1 | $47B |
|
||
| Utilities | 1 | $25B |
|
||
Price history
+136.8% since first listed17 events — show timeline
- 2026-06-16 Sold (MLS) $135,000 GAMLS
- 2026-05-04 Pending — GAMLS
- 2026-04-30 Listed $135,000 GAMLS
- 2026-03-17 Listing Removed — GAMLS
- 2026-02-18 Relisted — GAMLS
- 2026-02-18 Price Changed $135,000 GAMLS
- 2026-01-31 Listing Removed — GAMLS
- 2025-12-06 Relisted — GAMLS
- 2025-11-30 Listing Removed — GAMLS
- 2025-10-29 Contingent — GAMLS
- 2025-10-08 Price Changed $145,000 GAMLS
- 2025-10-06 Listed $155,000 GAMLS
- 2025-09-01 Listing Removed — GAMLS
- 2025-08-01 Price Changed $145,000 GAMLS
- 2025-07-03 Price Changed $155,000 GAMLS
- 2025-07-01 Listed $145,000 GAMLS
- 1999-03-26 Sold (Public Records) $57,000 Public Records
Property tax history
+4.7%/yrLatest (2025): $558 · -16.8% YoY. Source: county tax records.
Cash-flow waterfall
monthlySold comps — $/sqft
last 12 mo · ≤1 miLoading sold comps…