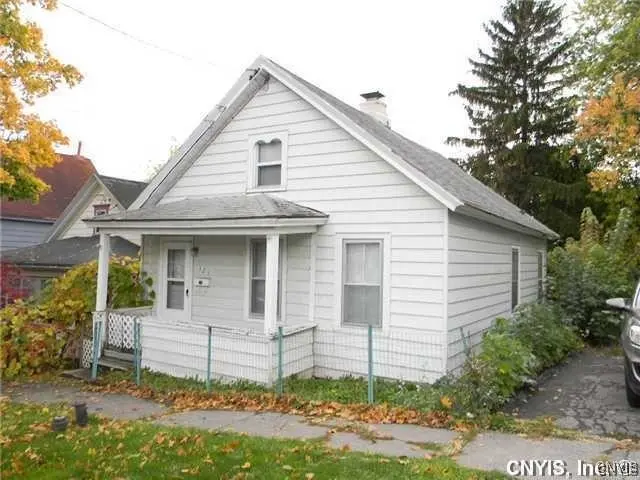
321 Greenway Ave · Syracuse, NY
Flood risk 1/10 · Minimal
- FEMA flood zone
- X (unshaded)
- Chance of flooding over 30 yrs
- 0.0%
- Est. flood insurance / yr
- $473 – $860
Fire risk 1/10 · Minimal
- Est. fire insurance / yr
- $691 – $1,283
Heat risk 3/10 · Minor
- Hot days now (above 94°F)
- 7 days/yr
- Hot days in 30 yrs
- 16 days/yr
Wind risk 1/10 · Minimal
- Chance of severe wind over 30 yrs
- 0.0%
Air-quality risk 2/10 · Minimal
- Unhealthy air days now
- 0 days/yr
- Unhealthy air days in 30 yrs
- 1 days/yr
Risk factors via First Street. Map © Google.
Why this score? — see what drove the B grade
The composite is a weighted blend of 9 inputs, each scored 0–100. Each bar is that input's sub-score; the figure is the points it added to the 100-point composite (weight × sub-score).
- Cash flow +30.0/30.0
- ARV discount +13.2/15.0
- DSCR +10.0/10.0
- 1% rule +9.2/10.0
- Rent growth +4.0/5.0
- Livability +3.9/5.0
- Condition / age +2.5/5.0
- Schools +1.8/10.0
- Appreciation +0.0/10.0
$115,000
🖨 Deal sheet 📄 Offer letter ✓ Due diligence
Listing remarks MLS
Turnkey Rental Opportunity. Soli single-family rental, offered with a long-term tenant already in place. The property currently rents for $1,325 per month, providing immediate cash flow from day one. Tenant is responsible for all utilities, keeping operating expenses simple and predictable for the owner. This makes the property an easy, low-maintenance addition to an existing portfolio or a great first investment for someone looking to get started with a stabilized rental. Whether you’re adding another door or starting with a straightforward, performing asset, this one checks the boxes: consistent rent, minimal management complexity, and no vacancy to fill.
Key facts
- 2,970 sq ft lot
- Built 1949
- Listed 150 days
Neighborhood map
What this means for you Summary
Snapshot
- This is a 2-bed/1.0-bath single-family listed at $115k.
Deal economics
- At list price, monthly cash flow is $576 ($7k/yr) — positive.
- The deal already cash-flows at list — no discount required.
- Meets the 1% rule at list price ($2k rent vs $115k).
- Recommended offer: $101k (12.0% below list) — sets the bar for market timing.
- Cap rate 12.3% vs local median 8.2% in Syracuse — top-decile yield for the area; either an underpriced asset or a hidden risk that comps aren't pricing in. Stress-test before assuming the spread holds.
Location & tenants
- Location reads 77/100 on livability (#187 in NY, #2,869 nationally) — a middle-class / working-renter tenant base. Strengths: amenities A+, commute A+, cost of living A+; Watch: schools D+, crime F, employment D-.
- Syracuse City School District (urban): math 18% / reading 26% proficiency, ranked #590 of 590 in NY (top 100%) — low school quality limits family demand, transient renter base, plan for 1-2y turnover; 74% free/reduced lunch — lower-income household profile, screen leases tightly.
- Market conditions: Rents rising fast (+5.8%/yr); 42 active listings in the ZIP; 25 comparable units currently listed for rent nearby; rentals at typical pace (median 21d on market — plan ~3-4 weeks tenant-placement turnaround); 44% of comp listings sitting > 30 days — soft ceiling on asking rent; 616 units permitted in Onondaga County in 2024 (256 in 5+ unit buildings).
- This rent runs 31% of the median local income ($63k/yr) — at the standard rent-burdened threshold; future hikes will face affordability resistance.
Forward outlook
- Local home prices are declining (-3.0%/yr); year-one equity from $795 of loan paydown is wiped out by about $3k of value loss. Plan a longer hold.
- Onondaga County population projected to shrink 9% by 2050 — rents likely to lag national; underwrite the cash flow, not the appreciation.
- At projected returns (-3.0% appreciation + 5.8% rent growth), your $32k cash investment doubles in ~5 years — after that, you're playing with house money.
Negotiation context
- It's been on market 150 days — a 12% lower offer ($101k) is reasonable based on typical stale-listing flexibility.
- 4 sale attempts since 14y ago with the ask held roughly flat each time — persistent listings suggest the price (not the market) is what's stuck; bring a comps-based counter.
- Current owner paid $20k; list at $115k implies a 475% gain — meaningful room to come down on a strong offer.
Risks & watch-outs
- Watch-outs: built in 1949 — expect roof / HVAC / electrical / plumbing capex.
Questions for the listing agent
- It's been on market 150 days. Have you received any prior offers? Is the seller open to a 12% concession, seller financing, or rate buy-down credit?
- Built in 1949 — when were the roof, HVAC, electrical panel, plumbing, and water heater last replaced?
- Why hasn't it sold? Are there any deal-killer items the seller is aware of (foundation, flood, title, zoning, code violations)?
- Is there a deadline driving the sale (1031 exchange, divorce, estate, relocation)? That informs how much negotiation room exists.
- Schools are D-rated, which usually means shorter tenancies and higher turnover. Who's the typical renter profile here, and what's been the actual vacancy rate?
- Crime grade is F in this area — have there been break-ins, vandalism, or insurance claims at this property in the last 3 years? What carrier currently insures it and at what premium?
- What's the average days-on-market for RENTAL listings here right now (not sales)? A rising rental-DOM trend means longer vacancies and softer asking-rent achievability than the comps imply.
- What's the recent tenant-quality profile in this submarket — average credit score on applications, eviction rate, late-payment / NSF rate, and stable-employment percentage? A property-management company in the area should have these aggregated.
- How much new for-sale + rental construction is in the pipeline within 1–3 miles? Heavy new supply typically softens prices + rents 12–24 months out; constrained supply supports both.
Investment metrics
- 1% rule
- 1.42% ✓
- Cap rate
- 12.30%
- Cash-on-cash
- 21.47%
- DSCR
- 1.96
- GRM
- 5.9
CMA / ARV
- ARV (median comp)
- $131,829
- List price
- $115,000
- Delta
- -12.77%
- Verdict
- UNDERPRICED
- Comps
- 20 within 1.0 mi
Show comp detail 12 sales within ~0.75 mi
| Address | Dist | Beds/Ba | Sqft | Sold | Price | $/sf | Match |
|---|---|---|---|---|---|---|---|
| 310 Robinson St | 0.22mi | 2/1.0 | 1,147 (-4%) | 8mo | $140,000 | $122 | 76 |
| 215 Vann St | 0.06mi | 3/1.0 (+1) | 1,104 (-8%) | 8mo | $165,000 | $149 | 72 |
| 318 Greenway Ave | 0.02mi | 3/1.5 (+1) | 1,052 (-12%) | 5mo | $155,000 | $147 | 67 |
| 409 Hixson Ave | 0.45mi | 3/1.5 (+1) | 1,232 (+3%) | 1mo | $155,000 | $126 | 67 |
| 118 Pattison St | 0.45mi | 3/1.0 (+1) | 1,223 (+2%) | 9mo | $135,000 | $110 | 64 |
| 718 Hixson Ave | 0.21mi | 2/1.0 | 1,020 (-15%) | 3mo | $135,000 | $132 | 63 |
| 302 Melrose Ave | 0.57mi | 3/1.0 (+1) | 1,184 (-1%) | 6mo | $169,000 | $143 | 62 |
| 923 Teall Ave | 0.30mi | 3/1.0 (+1) | 1,063 (-11%) | 9mo | $124,000 | $117 | 54 |
| 362 Hickok Ave | 0.50mi | 3/1.0 (+1) | 1,320 (+10%) | 3mo | $199,900 | $151 | 52 |
| 209 Melrose Ave | 0.58mi | 3/1.5 (+1) | 1,264 (+5%) | 8mo | $182,000 | $144 | 50 |
| 316 Bruce St | 0.71mi | 3/1.0 (+1) | 1,287 (+7%) | 4mo | $96,000 | $75 | 46 |
| 206 Sedgwick St | 0.53mi | 3/2.0 (+1) | 1,368 (+14%) | 1mo | $80,000 | $58 | 42 |
Match score weights: distance 35% · size 25% · config 20% · recency 20%. Top-matched comps best support the ARV.
Projected returns pro-forma
-3.0% appreciation · 5.85% rent growth · sell at horizon
- IRR
- 17.0%
- Equity multiple
- 1.71×
- Total profit
- $22,856
- Equity at exit
- $17,147
- IRR
- 27.4%
- Equity multiple
- 3.73×
- Total profit
- $88,035
- Equity at exit
- $9,943
Cash invested: $32,200 (down + closing). Projections, not guarantees.
Landlord ↔ Tenant lean methodology
- Overall (STATE)
- 15 Strongly Tenant-Friendly
- State New York
- 15 Strongly Tenant-Friendly · D+10
- County
- — inherits STATE
- City
- — inherits STATE
ZIP-level market 13206
- Home prices YoY
- -7.1%
- Rents YoY
- 5.8%
- Active inventory
- 42
- Price-to-rent
- 5.9×
Monthly cashflow live
- Estimated rent
- $1,635 high interval (Pro) →
- Mortgage (P&I)
- −$603
- Tax from tax record
- −$65 /mo · $778/yr
- Insurance
- −$48
- HOA
- −$0
- Vacancy / Maint / Mgmt
- −$343
- Net cashflow
- $576
Break-even live
UW: 25.0% down · 7.5% · 30yr · 1.5% tax · 5.0% vac · 8.0% maint · 8.0% mgmt
Financing live
Cash to close
- Down payment
- $28,750
- Closing costs
- $3,450
- Reserves months
- —
- Total cash needed
- —
Loan-product check · same deal, 3 products live
Conventional
25% down · 7.5% · 30yr
- Down + closing
- —
- Monthly P&I
- —
- Monthly cashflow
- —
- DSCR
- —
- Eligible?
- —
Personal DTI + credit; lowest rate.
DSCR
20% down · 8.5% · 30yr
- Down + closing
- —
- Monthly P&I
- —
- Monthly cashflow
- —
- DSCR
- —
- Eligible?
- —
No personal income docs; deal must DSCR.
Hard money
10% down · 12.0% · 12mo
- Down + closing
- —
- Monthly P&I
- —
- Monthly cashflow
- —
- DSCR
- —
- Eligible?
- —
Short-term bridge; refi at stabilization.
Rent comps 25 comps
| Address | Beds | Baths | Sqft | Rent | $/sqft | DOM | Units | Dist |
|---|---|---|---|---|---|---|---|---|
| 204 Mariposa St Unit pvt house Syracuse, NY | 3.0 | 1.0 | 1128 | $2,137 | $1.89 | 13d | 1 | 0.41mi |
| 1618 James St #3 Syracuse, NY | 2.0 | 1.0 | 1150 | $2,200 | $1.91 | 13d | 1 | 0.58mi |
| 1801 James St #2 Syracuse, NY | 3.0 | 1.0 | 1244 | $1,800 | $1.45 | 13d | 1 | 0.69mi |
| 213 Beattie St Syracuse, NY | 2.0 | 1.0 | 975 | $1,370 | $1.41 | 13d | 1 | 0.75mi |
| 118 Niven St Syracuse, NY | 3.0 | 1.0 | 1150 | $1,650 | $1.43 | 20d | 1 | 0.88mi |
| 300 University Ave Syracuse, NY | 2.0 | 1.0 | 1020 | $2,150 | $2.11 | 13d | 1 | 0.91mi |
| 525 Burnet Ave Unit First Floor Syracuse, NY | 3.0 | 1.0 | 900 | $1,650 | $1.83 | 43d | 1 | 0.93mi |
| 1105 E Genesee St Unit 2 Syracuse, NY | 1.0 | 1.0 | 729 | $1,300 | $1.78 | 43d | 1 | 0.93mi |
| 917 Madison St #5 Syracuse, NY | 2.0 | 1.0 | 1000 | $1,600 | $1.60 | 43d | 1 | 0.98mi |
| 117 Edtim Rd Syracuse, NY | 1.0–2.0 | 1.0 | 545 | $1,295 | $2.37 | 13d | 1 | 1.00mi |
| 212 Dorchester Ave Syracuse, NY | 1.0–2.0 | 1.0 | 640 | $1,420 | $2.22 | 13d | 15 | 1.01mi |
| 900 E Fayette St Syracuse, NY | 1.0–2.0 | 1.0 | 817 | $1,995 | $2.44 | 13d | 9 | 1.03mi |
| 502 University Ave Syracuse, NY | 1.0–2.0 | 1.0 | 950 | $1,450 | $1.53 | 13d | 2 | 1.07mi |
| 143 S Edwards Ave Syracuse, NY | 1.0 | 1.0 | 1000 | $1,200 | $1.20 | 20d | 1 | 1.07mi |
| 225 Marlborough Rd Syracuse, NY | 2.0 | 1.0 | 1040 | $1,800 | $1.73 | 13d | 1 | 1.09mi |
| 205 Beecher St Unit 3 Syracuse, NY | 2.0 | 1.0 | 815 | $1,100 | $1.35 | 43d | 1 | 1.11mi |
| 200 Catherine St Apt 5 Syracuse, NY | 2.0 | 1.0 | 850 | $1,550 | $1.82 | 43d | 1 | 1.14mi |
| 205A Hawley Ave Unit 211C Syracuse, NY | 3.0 | 2.5 | 1350 | $1,675 | $1.24 | 43d | 1 | 1.17mi |
| 205A Hawley Ave Unit 213C Syracuse, NY | 3.0 | 2.5 | 1350 | $1,650 | $1.22 | 43d | 1 | 1.17mi |
| 712 E Fayette St Syracuse, NY | 1.0 | 1.0 | 720 | $1,698 | $2.36 | 13d | 10 | 1.20mi |
| 746 E Laurel St Unit 2F Syracuse, NY | 2.0 | 1.0 | 800 | $1,100 | $1.38 | 43d | 1 | 1.24mi |
| 126 Woodruff Ave Syracuse, NY | 3.0 | 1.0 | 1200 | $1,675 | $1.40 | 43d | 1 | 1.27mi |
| 297 Norwood Ave Syracuse, NY | 3.0 | 1.0 | 1188 | $2,050 | $1.73 | 20d | 1 | 1.29mi |
| 60 Presidential Plz Syracuse, NY | 1.0–2.0 | 1.0–1.5 | 970 | $1,315 | $1.36 | 43d | 1 | 1.36mi |
| 620 Euclid Ave Apt 1 Syracuse, NY | 3.0 | 1.0 | 1248 | $1,700 | $1.36 | 43d | 1 | 1.37mi |
Listing history 23 events
-
2026-06-18days on market $115,000 Active 150 DOM
-
2026-06-17days on market $115,000 Active 149 DOM
-
2026-06-16days on market $115,000 Active 148 DOM
-
2026-06-15days on market $115,000 Active 147 DOM
-
2026-06-14days on market $115,000 Active 145 DOM
-
2026-06-13days on market $115,000 Active 144 DOM
-
2026-06-10days on market $115,000 Active 142 DOM
-
2026-06-09days on market $115,000 Active 141 DOM
-
2026-06-08days on market $115,000 Active 140 DOM
-
2026-06-07days on market $115,000 Active 139 DOM
-
2026-06-05days on market $115,000 Active 136 DOM
-
2026-06-02days on market $115,000 Active 134 DOM
-
2026-06-01days on market $115,000 Active 133 DOM
-
2026-05-31days on market $115,000 Active 132 DOM
-
2026-05-30days on market $115,000 Active 131 DOM
-
2026-01-19$115,000 Active 671-char remark
Show marketing remark (671 chars)
Turnkey Rental Opportunity. Soli single-family rental, offered with a long-term tenant already in place. The property currently rents for $1,325 per month, providing immediate cash flow from day one. Tenant is responsible for all utilities, keeping operating expenses simple and predictable for the owner. This makes the property an easy, low-maintenance addition to an existing portfolio or a great first investment for someone looking to get started with a stabilized rental. Whether you’re adding another door or starting with a straightforward, performing asset, this one checks the boxes: consistent rent, minimal management complexity, and no vacancy to fill.
-
2025-07-31historical
-
2025-03-16status Active
-
2025-02-22$110,000 Active
-
2012-12-21soldstatus $20,000
-
2012-12-04historical
-
2012-12-03soldstatus $20,000
-
2012-10-19$24,900
ⓘ Source: listings_history table (triggers on properties + properties_extension) + one-shot
backfill from property_details.listing_events for pre-trigger history.
Tax reassessment forecast NY · Partial reset (capped growth)
- Current annual tax
- $778 · $65/mo
- Projected year-2 tax
- $1,361 · $113/mo
- Expected delta
- +$583/yr (+$49/mo · 74.9%)
ⓘ Screening estimate from a state-policy table — verify with the county assessor before closing.
Climate risk First Street
- Flood 1/10 Low FEMA zone X (unshaded) · 0% chance over 30 yrs
- Wildfire 1/10 Low
- Heat 3/10 Moderate 7 d/yr ≥94°F today · 16 d/yr by 30 yrs out
- Wind 1/10 Low 0% chance of damaging wind over 30 yrs
- Air quality 2/10 Low 0 unhealthy d/yr today · 1 by 30 yrs out
Nearby sold comps map
Loading sold comps map…
Walkable amenities ~0.75 mi
Loading nearby amenities…
Taxation est. · year 1
- Rental income
- $19,624
- − Mortgage interest
- −$6,442
- − Property taxes
- −$778
- − Insurance
- −$575
- − Repairs & maintenance
- −$1,570
- − Management
- −$1,570
- − Depreciation
- −$3,345
- Taxable income
- $5,344
- Est. tax owed @ 24.0%
- −$1,283
- After-tax cash flow
- $5,631/yr
For passive investors: Depreciation is non-cash, so a rental often shows a tax loss while cash-flowing — sheltering income. Rental losses are passive: they offset passive income freely, and up to $25,000/yr can offset ordinary (W-2) income if you actively participate and your MAGI is under $100k (phasing out to $0 by $150k); unused losses carry forward. On sale, claimed depreciation is recaptured at up to 25%, and gains may owe capital-gains tax (a 1031 exchange can defer both). Figures are a year-1 estimate at your 24.0% rate — not tax advice; consult a CPA.
Schools (NCES district)
- District
- Syracuse City School District
- NCES district ID
- 3628590
- Math proficiency
- 18% ▼ -5.00%
- Reading proficiency
- 26% ▬ 0.00%
- Median HH income
- $32,097
- Composite
- 17.83/100
- National rank
- #9007
- State rank
- #590 of 590 in NY
Livability — Syracuse
- Score
- 77/100
- State rank
- #187
- US rank
- #2869
Category grades
Schools grade is shown separately in the Schools card above.
Census & demographics
- Census place
- Syracuse, NY
- County
- Onondaga County · 247,257 people
- City population
- 152,627
- Metro
- Syracuse, NY
- Population (ZIP)
- 16,245
- Household income
- $63,136
- Rent vs Own
- Severe rent burden
- 725.0
Population outlook (Onondaga County) Hauer SSP2
- Today (2025)
- 467,894 people
- By 2030
- 463,381 · -1.0%
- By 2040
- 447,697 · -4.3%
- By 2050
- 426,399 · -8.9%
- By 2075
- 373,661 · -20.1%
- By 2100
- 307,967 · -34.2%
Race, ethnicity, and origin ACS 2023
- Neighborhood character
- Predominantly White (67%)
- Race & ethnicity
- White 67% Black 13% Two or more races 9% Hispanic / Latino 8% Asian 5%
- Hispanic origin (detail)
- Puerto Rican 4%
- Common ancestry
- Romanian 6% Lithuanian 4% Slovak 2%
- Foreign-born
- 8% · Canada, Jamaica, China
- Languages at home
- 89% English-only · Spanish 3% Arabic 2% Other Indo-European 1%
Political lean MEDSL · Onondaga
- 2024 margin
- D (+17.3) · D 58.6% · R 41.4%
- 2008→2024 swing
- -3.0pp toward R · 2008: 20.3pp · 2024: 17.3pp
- All cycles
- 2024: D+17.3 2020: D+20.6 2016: D+12.8 2012: D+21.1 2008: D+20.3
Not yet ingested
- Civics
- —
Market trends
- HPI YoY
- ▼ -24.60%
- Current HPI
- 322.231
- Rent YoY
- ▲ 5.85%
- Metro
- Syracuse, NY
- State GDP YoY
- ▲ 2.60%
- F500 in state
- 92
Industry mix (Fortune 500 HQ in NY)
| Industry | F500 HQs | Revenue |
|---|---|---|
| Financial Services | 10 | $950B |
|
||
| Consumer Goods | 9 | $162B |
|
||
| Insurance | 4 | $225B |
|
||
| Telecommunications | 2 | $144B |
|
||
| Pharmaceuticals | 2 | $112B |
|
||
| Media / Entertainment | 2 | $69B |
|
||
Price history
+361.8% since first listed8 events — show timeline
- 2026-01-19 Listed $115,000 CNYIS
- 2025-07-31 Listing Removed — CNYIS
- 2025-03-16 Relisted — CNYIS
- 2025-02-22 Listed $110,000 CNYIS
- 2012-12-21 Sold (Public Records) $20,000 Public Records
- 2012-12-04 Listing Removed — CNYIS
- 2012-12-03 Sold (MLS) $20,000 CNYIS
- 2012-10-19 Listed $24,900 CNYIS
Property tax history
-0.1%/yrLatest (2025): $778 · +0.0% YoY. Source: county tax records.
Cash-flow waterfall
monthlySold comps — $/sqft
last 12 mo · ≤1 miLoading sold comps…