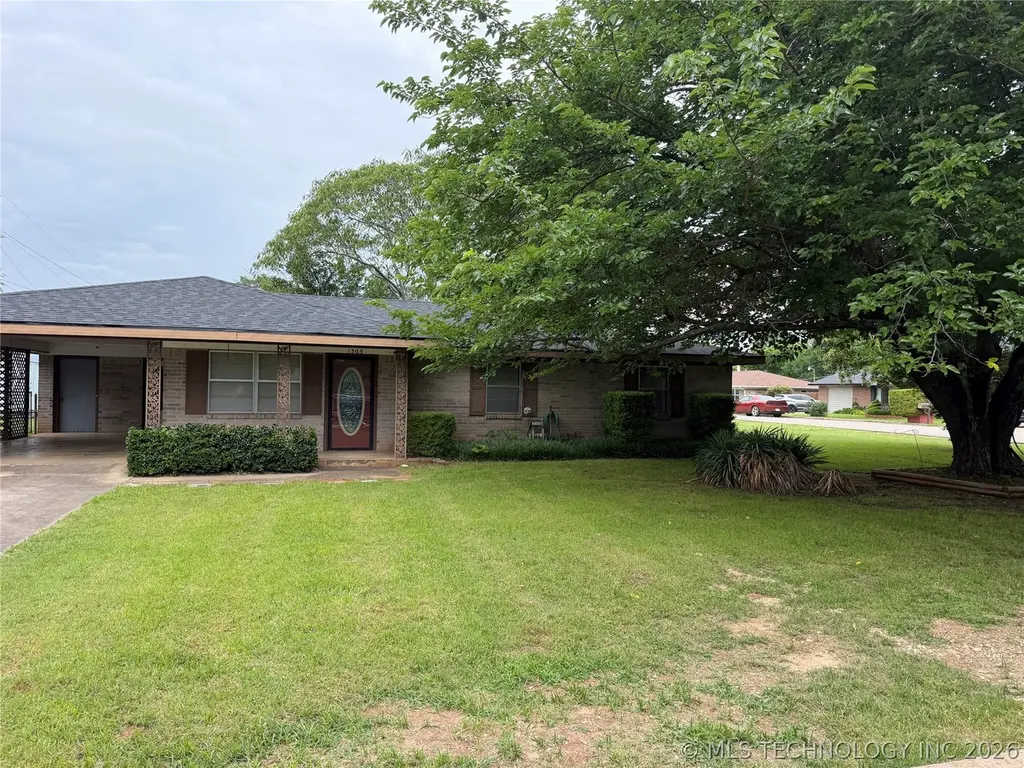
1303 Twin Lks · Madill, OK
Flood risk 1/10 · Minimal
- FEMA flood zone
- X
- Chance of flooding over 30 yrs
- 0.0%
- Est. flood insurance / yr
- $507 – $1,088
Fire risk 6/10 · Moderate
- Est. fire insurance / yr
- $2,463 – $4,575
Heat risk 6/10 · Moderate
- Hot days now (above 111°F)
- 7 days/yr
- Hot days in 30 yrs
- 20 days/yr
Wind risk 4/10 · Minor
- Chance of severe wind over 30 yrs
- 15.0%
Air-quality risk 3/10 · Minor
- Unhealthy air days now
- 2 days/yr
- Unhealthy air days in 30 yrs
- 3 days/yr
Risk factors via First Street. Map © Google.
Why this score? — see what drove the C- grade
The composite is a weighted blend of 9 inputs, each scored 0–100. Each bar is that input's sub-score; the figure is the points it added to the 100-point composite (weight × sub-score).
- Cash flow +18.8/30.0
- ARV discount +11.2/15.0
- DSCR +5.9/10.0
- 1% rule +3.8/10.0
- Appreciation +3.6/10.0
- Livability +3.2/5.0
- Rent growth +2.5/5.0
- Condition / age +2.5/5.0
- Schools +1.8/10.0
$169,900
🖨 Deal sheet (PDF) 📄 Offer letter ✓ Due diligence
Listing remarks
Charming home in a Highly Desirable Madill Neighborhood This 3-bed, 2-bath home has fantastic bones and tons of potential. With great curb appeal and a little updating, this property can easily become the beautiful home you’ve been envisioning. Located in a quiet, well-loved neighborhood, it’s the perfect opportunity for anyone looking to invest, renovate, or create their dream space. Whether you're a first-time buyer wanting to add personal touches or an investor seeking a solid project, this home is full of promise.
Key facts
- Madill neighborhood
- Curb appeal
- Quiet neighborhood
Tags
Property features AI
Exterior
- Parking: 2-car garage; Carport
- Security: No safety shelter
- Utilities: Electricity available; Public water; Public sewer
- Home design: Single-story; Faces east; Slab foundation
- Construction: Built with brick and wood frame; Asphalt/fiberglass roof
- Exterior features: Covered patio; Patio; Shed(s); Partial fencing; Corner lot
Interior
- Kitchen: Oven; Range
- Flooring: Carpet; Tile
- Bathrooms: 2 full bathrooms
- Heating & cooling: Central heating (electric); Central air conditioning
- Interior features: Laminate counters; Electric oven connection; Aluminum window frames; Other interior features
- Laundry & utility: Washer hookup; Electric water heater
Neighborhood map
What this means for you Summary
Snapshot
- This is a 3-bed/2.0-bath single-family listed at $170k.
Deal economics
- At list price, monthly cash flow is $169 ($2k/yr) — positive.
- The deal already cash-flows at list — no discount required.
- To meet the 1% rule (rent ≥ 1% of price), the offer needs to be $150k (11.7% below list).
- Recommended offer: $150k (11.7% below list) — sets the bar for 1% rule.
- Cap rate 7.5% vs local median 3.0% in Madill — top-decile yield for the area; either an underpriced asset or a hidden risk that comps aren't pricing in. Stress-test before assuming the spread holds.
Location & tenants
- Location reads 63/100 on livability (#232 in OK) — a middle-class / working-renter tenant base. Strengths: crime A+, cost of living A+, housing A; Watch: employment D, schools F, amenities F.
- Madill (town): math 20% / reading 22% proficiency, ranked #162 of 270 in OK (top 60%) — low school quality limits family demand, transient renter base, plan for 1-2y turnover; 61% free/reduced lunch — lower-income household profile, screen leases tightly.
- Market conditions: 105 active listings in the ZIP; 1 comparable units currently listed for rent nearby; 42 units permitted in Marshall County in 2024 (0 in 5+ unit buildings).
Forward outlook
- Local home prices are declining (-2.8%/yr); year-one equity from $1k of loan paydown is wiped out by about $5k of value loss. Plan a longer hold.
- Marshall County population projected at +22% by 2050 — long-run rental-demand tailwind backs the buy-and-hold thesis.
Negotiation context
- It's been on market 19 days — a 2% lower offer ($167k) is reasonable based on typical stale-listing flexibility.
- Current owner paid $64k; list at $170k implies a 163% gain — meaningful room to come down on a strong offer.
Risks & watch-outs
- Climate carrying-cost: major wildfire risk; extreme-heat days projected 7→20/yr by 2055 (HVAC capex compounding) — expect insurance premiums to compound above CPI over the hold.
Questions for the listing agent
- Built in 1978 — when were the roof, HVAC, electrical panel, plumbing, and water heater last replaced?
- Is there a deadline driving the sale (1031 exchange, divorce, estate, relocation)? That informs how much negotiation room exists.
- Schools are F-rated, which usually means shorter tenancies and higher turnover. Who's the typical renter profile here, and what's been the actual vacancy rate?
- What's the average days-on-market for RENTAL listings here right now (not sales)? A rising rental-DOM trend means longer vacancies and softer asking-rent achievability than the comps imply.
- What's the recent tenant-quality profile in this submarket — average credit score on applications, eviction rate, late-payment / NSF rate, and stable-employment percentage? A property-management company in the area should have these aggregated.
- How much new for-sale + rental construction is in the pipeline within 1–3 miles? Heavy new supply typically softens prices + rents 12–24 months out; constrained supply supports both.
Investment metrics
- 1% rule
- 0.88% ✗
- Cap rate
- 7.49%
- Cash-on-cash
- 4.28%
- DSCR
- 1.19
- GRM
- 9.4
CMA / ARV
- ARV (on-the-fly)
- $185,280
- Comps found
- 5
Show comp detail 5 sales within ~0.75 mi
| Address | Dist | Beds/Ba | Sqft | Sold | Price | $/sf | Match |
|---|---|---|---|---|---|---|---|
| 1112 W Lillie Blvd | 0.37mi | 3/2.0 | 1,630 (+6%) | 17mo | $146,000 | $90 | 59 |
| 710 W Lillie Blvd | 0.48mi | 3/2.0 | 1,608 (+4%) | 22mo | $70,000 | $44 | 53 |
| 107 Parkway | 0.57mi | 3/2.0 | 1,648 (+7%) | 12mo | $230,000 | $140 | 52 |
| 907 W Burney | 0.22mi | 3/2.0 | 1,342 (-13%) | 23mo | $178,000 | $133 | 49 |
| 106 Parkway Plz | 0.61mi | 3/2.0 | 1,629 (+6%) | 21mo | $195,000 | $120 | 45 |
Match score weights: distance 35% · size 25% · config 20% · recency 20%. Top-matched comps best support the ARV.
Projected returns pro-forma
-2.76% appreciation · 3.0% rent growth · sell at horizon
- IRR
- -8.5%
- Equity multiple
- 0.68×
- Total profit
- $-15,115
- Equity at exit
- $27,137
- IRR
- 0.5%
- Equity multiple
- 1.04×
- Total profit
- $1,888
- Equity at exit
- $17,809
Cash invested: $47,572 (down + closing). Projections, not guarantees.
Landlord ↔ Tenant lean methodology
- Overall (STATE)
- 83 Strongly Landlord-Friendly
- State Oklahoma
- 83 Strongly Landlord-Friendly · R+20
- County
- — inherits STATE
- City
- — inherits STATE
ZIP-level market 73446
- Home prices YoY
- -1.4%
- Active inventory
- 105
- Price-to-rent
- 9.4×
Monthly cashflow live
- Estimated rent
- $1,500 medium interval (Pro) →
- Mortgage (P&I)
- −$891
- Tax from tax record
- −$54 /mo · $645/yr
- Insurance
- −$71
- HOA
- −$0
- Vacancy / Maint / Mgmt
- −$315
- Net cashflow
- $169
Break-even live
Sensitivity live
| Price | -10% $266 | -5% $218 | +0% $169 | +5% $121 | +10% $73 |
|---|---|---|---|---|---|
| Rent | -10% $51 | -5% $110 | +0% $169 | +5% $229 | +10% $288 |
| Rate | -1.0pp $255 | -0.5pp $213 | base $169 | +0.5pp $125 | +1.0pp $81 |
UW: 25.0% down · 7.5% · 30yr · 1.5% tax · 5.0% vac · 8.0% maint · 8.0% mgmt
Financing live
Cash to close
- Down payment
- $42,475
- Closing costs
- $5,097
- Reserves months
- —
- Total cash needed
- —
Loan-product check · same deal, 3 products live
Conventional
25% down · 7.5% · 30yr
- Down + closing
- —
- Monthly P&I
- —
- Monthly cashflow
- —
- DSCR
- —
- Eligible?
- —
Personal DTI + credit; lowest rate.
DSCR
20% down · 8.5% · 30yr
- Down + closing
- —
- Monthly P&I
- —
- Monthly cashflow
- —
- DSCR
- —
- Eligible?
- —
No personal income docs; deal must DSCR.
Hard money
10% down · 12.0% · 12mo
- Down + closing
- —
- Monthly P&I
- —
- Monthly cashflow
- —
- DSCR
- —
- Eligible?
- —
Short-term bridge; refi at stabilization.
Rent comps 1 comps
| Address | Beds | Baths | Sqft | Rent | $/sqft | DOM | Units | Dist |
|---|---|---|---|---|---|---|---|---|
| 512 Sweet Pea Ln Madill, OK | 3.0 | 2.0 | 1308 | $1,500 | $1.15 | 22d | 1 | 1.08mi |
Listing history 2 events
-
2026-05-06$169,900 Active
-
1997-03-05soldstatus $64,500
ⓘ Source: listings_history table (triggers on properties + properties_extension) + one-shot
backfill from property_details.listing_events for pre-trigger history.
Tax reassessment forecast OK · Resets to sale price
- Current annual tax
- $645 · $54/mo
- Projected year-2 tax
- $1,529 · $127/mo
- Expected delta
- +$884/yr (+$74/mo · 137.1%)
ⓘ Screening estimate from a state-policy table — verify with the county assessor before closing.
Climate risk First Street
- Flood 1/10 Low FEMA zone X · 0% chance over 30 yrs
- Wildfire 6/10 Major
- Heat 6/10 Major 7 d/yr ≥111°F today · 20 d/yr by 30 yrs out
- Wind 4/10 Moderate 15% chance of damaging wind over 30 yrs
- Air quality 3/10 Moderate 2 unhealthy d/yr today · 3 by 30 yrs out
Nearby sold comps map
Loading sold comps map…
Walkable amenities ~0.75 mi
Loading nearby amenities…
Taxation est. · year 1
- Rental income
- $18,000
- − Mortgage interest
- −$9,517
- − Property taxes
- −$645
- − Insurance
- −$850
- − Repairs & maintenance
- −$1,440
- − Management
- −$1,440
- − Depreciation
- −$4,943
- Taxable loss
- −$834
- Est. tax savings @ 24.0%
- +$200
- After-tax cash flow
- $2,234/yr
For passive investors: Depreciation is non-cash, so a rental often shows a tax loss while cash-flowing — sheltering income. Rental losses are passive: they offset passive income freely, and up to $25,000/yr can offset ordinary (W-2) income if you actively participate and your MAGI is under $100k (phasing out to $0 by $150k); unused losses carry forward. On sale, claimed depreciation is recaptured at up to 25%, and gains may owe capital-gains tax (a 1031 exchange can defer both). Figures are a year-1 estimate at your 24.0% rate — not tax advice; consult a CPA.
Schools (NCES district)
- District
- Madill
- NCES district ID
- 4018700
- Math proficiency
- 20% ▼ -17.00%
- Reading proficiency
- 22% ▼ -13.00%
- Median HH income
- $40,372
- Composite
- 17.82/100
- National rank
- #9008
- State rank
- #162 of 270 in OK
Livability — Madill
- Score
- 63/100
- State rank
- #232
- US rank
- #15955
Category grades
Schools grade is shown separately in the Schools card above.
Census & demographics
- Census place
- Madill, OK
- City population
- 8,414
- Population (ZIP)
- 8,414
Population outlook (Marshall County) Hauer SSP2
- Today (2025)
- 17,405 people
- By 2030
- 18,038 · +3.6%
- By 2040
- 19,513 · +12.1%
- By 2050
- 21,283 · +22.3%
- By 2075
- 27,884 · +60.2%
- By 2100
- 35,435 · +103.6%
Race, ethnicity, and origin ACS 2023
- Neighborhood character
- Diverse neighborhood (Simpson 0.63)
- Race & ethnicity
- White 54% Hispanic / Latino 28% Two or more races 15% Native American 8%
- Hispanic origin (detail)
- Mexican 27%
- Common ancestry
- Iranian 1% Serbian 1% Lithuanian 1%
- Foreign-born
- 11% · Canada
- Languages at home
- 76% English-only · Spanish 22% German/W. Germanic 1%
Political lean MEDSL · Marshall
- 2024 margin
- Solid R (+63.4) · D 17.7% · R 81.2% · Other 1.1%
- 2008→2024 swing
- -24.6pp toward R · 2008: -38.8pp · 2024: -63.4pp
- All cycles
- 2024: R+63.4 2020: R+62.5 2016: R+56.6 2012: R+45.7 2008: R+38.8
Not yet ingested
- Civics
- —
Market trends
- HPI YoY
- ▼ -2.76%
- Current HPI
- 188.3049
- Rent YoY
- —
- Metro
- —
- State GDP YoY
- ▲ 1.55%
- F500 in state
- 6
Industry mix (Fortune 500 HQ in OK)
| Industry | F500 HQs | Revenue |
|---|---|---|
| Energy | 3 | $48B |
|
||
Price history
+163.4% since first listed2 events — show timeline
- 2026-05-06 Listed $169,900 MLS Technology, Inc.
- 1997-03-05 Sold (Public Records) $64,500 Public Records
Property tax history
+2.1%/yrLatest (2025): $645 · +1.9% YoY. Source: county tax records.
Cash-flow waterfall
monthlySold comps — $/sqft
last 12 mo · ≤1 miLoading sold comps…