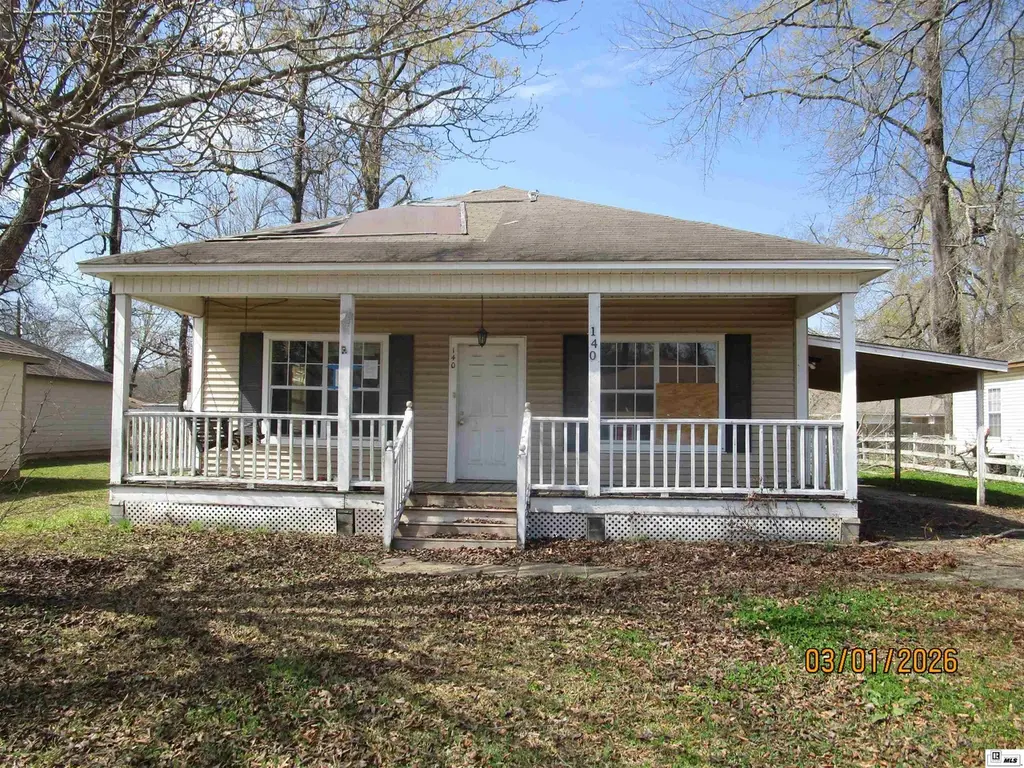
140 Brookwood Dr · Monroe, LA
Flood risk 1/10 · Minimal
- FEMA flood zone
- X (shaded)
- Chance of flooding over 30 yrs
- 0.0%
- Est. flood insurance / yr
- $507 – $1,088
Fire risk 3/10 · Minor
- Est. fire insurance / yr
- $1,269 – $2,357
Heat risk 7/10 · Major
- Hot days now (above 111°F)
- 7 days/yr
- Hot days in 30 yrs
- 20 days/yr
Wind risk 6/10 · Moderate
- Chance of severe wind over 30 yrs
- 69.0%
Air-quality risk 2/10 · Minimal
- Unhealthy air days now
- 1 days/yr
- Unhealthy air days in 30 yrs
- 1 days/yr
Risk factors via First Street. Map © Google.
Why this score? — see what drove the B- grade
The composite is a weighted blend of 9 inputs, each scored 0–100. Each bar is that input's sub-score; the figure is the points it added to the 100-point composite (weight × sub-score).
- Cash flow +30.0/30.0
- 1% rule +10.0/10.0
- DSCR +10.0/10.0
- ARV discount +7.5/15.0
- Livability +3.3/5.0
- Schools +3.2/10.0
- Rent growth +2.5/5.0
- Condition / age +2.5/5.0
- Appreciation +0.0/10.0
$76,400
🖨 Deal sheet 📄 Offer letter ✓ Due diligence
Listing remarks MLS
3 BR, 2BA home on a tree shaded lot, front porch, open floor plan,
Key facts
- Open floor plan
- Front porch
- Tree shaded lot
Tags
Neighborhood map
What this means for you Summary
Snapshot
- This is a 3-bed/2.0-bath single-family listed at $76k.
Deal economics
- At list price, monthly cash flow is $711 ($9k/yr) — positive.
- The deal already cash-flows at list — no discount required.
- Meets the 1% rule at list price ($2k rent vs $76k).
- Recommended offer: $70k (9.0% below list) — sets the bar for market timing.
- Cap rate 17.5% vs local median 5.7% in Monroe — top-decile yield for the area; either an underpriced asset or a hidden risk that comps aren't pricing in. Stress-test before assuming the spread holds.
Location & tenants
- Location reads 66/100 on livability (#128 in LA) — a middle-class / working-renter tenant base. Strengths: cost of living A+, health & safety A+; Watch: crime F, amenities F, commute F.
- Ouachita Parish (suburban): math 31% / reading 45% proficiency, ranked #26 of 98 in LA (top 26%) — families likely to look elsewhere, expect single-tenant / working-renter base with shorter leases.
- Market conditions: 437 active listings in the ZIP; 3 comparable units currently listed for rent nearby; rentals at typical pace (median 21d on market — plan ~3-4 weeks tenant-placement turnaround); 345 units permitted in Ouachita Parish in 2024 (0 in 5+ unit buildings).
- This rent runs 36% of the median local income ($52k/yr) — at the standard rent-burdened threshold; future hikes will face affordability resistance.
Forward outlook
- Local home prices are declining (-3.0%/yr); year-one equity from $528 of loan paydown is wiped out by about $2k of value loss. Plan a longer hold.
- At projected returns (-3.0% appreciation + 3.0% rent growth), your $21k cash investment doubles in ~3 years — after that, you're playing with house money.
Negotiation context
- It's been on market 108 days — a 9% lower offer ($70k) is reasonable based on typical stale-listing flexibility.
- 2 sale attempts since 12y ago; this cycle's ask has dropped $16k (17%) from the opening price — seller is motivated, your offer sets the floor, not the list.
Risks & watch-outs
- Climate carrying-cost: major wind risk, 69% chance of damaging wind over 30y; extreme-heat days projected 7→20/yr by 2055 (HVAC capex compounding) — expect insurance premiums to compound above CPI over the hold.
Questions for the listing agent
- It's been on market 108 days. Have you received any prior offers? Is the seller open to a 9% concession, seller financing, or rate buy-down credit?
- Why hasn't it sold? Are there any deal-killer items the seller is aware of (foundation, flood, title, zoning, code violations)?
- Is there a deadline driving the sale (1031 exchange, divorce, estate, relocation)? That informs how much negotiation room exists.
- Crime grade is F in this area — have there been break-ins, vandalism, or insurance claims at this property in the last 3 years? What carrier currently insures it and at what premium?
- What's the average days-on-market for RENTAL listings here right now (not sales)? A rising rental-DOM trend means longer vacancies and softer asking-rent achievability than the comps imply.
- What's the recent tenant-quality profile in this submarket — average credit score on applications, eviction rate, late-payment / NSF rate, and stable-employment percentage? A property-management company in the area should have these aggregated.
- How much new for-sale + rental construction is in the pipeline within 1–3 miles? Heavy new supply typically softens prices + rents 12–24 months out; constrained supply supports both.
Investment metrics
- 1% rule
- 2.07% ✓
- Cap rate
- 17.46%
- Cash-on-cash
- 39.88%
- DSCR
- 2.77
- GRM
- 4.0
CMA / ARV
- ARV (median comp)
- $155,745
- List price
- $76,400
- Delta
- -50.95%
- Verdict
- UNDERPRICED
- Comps
- 20 within 1.0 mi
Show comp detail 8 sales within ~0.75 mi
| Address | Dist | Beds/Ba | Sqft | Sold | Price | $/sf | Match |
|---|---|---|---|---|---|---|---|
| 215 Shady Ln | 0.28mi | 3/2.0 | 1,244 (-1%) | 6mo | $142,000 | $114 | 80 |
| 207 Shady Ln | 0.32mi | 3/2.0 | 1,316 (+4%) | 14mo | $158,000 | $120 | 66 |
| 536 Woodhaven Dr | 0.09mi | 3/1.0 | 1,120 (-11%) | 10mo | $120,900 | $108 | 65 |
| 206 Bastrop Dr | 0.48mi | 3/2.0 | 1,312 (+4%) | 12mo | $155,000 | $118 | 61 |
| 542 Woodhaven Dr | 0.10mi | 3/1.0 | 1,108 (-12%) | 13mo | $120,000 | $108 | 60 |
| 123 Shady Ln | 0.47mi | 3/1.5 | 1,193 (-5%) | 9mo | $152,000 | $127 | 60 |
| 423 Birchwood Dr | 0.39mi | 3/2.0 | 1,407 (+12%) | 12mo | $169,500 | $120 | 52 |
| 226 Monroe Dr | 0.63mi | 3/1.0 | 1,152 (-9%) | 4mo | $162,000 | $141 | 49 |
Match score weights: distance 35% · size 25% · config 20% · recency 20%. Top-matched comps best support the ARV.
Projected returns pro-forma
-3.0% appreciation · 3.0% rent growth · sell at horizon
- IRR
- 36.2%
- Equity multiple
- 2.54×
- Total profit
- $32,926
- Equity at exit
- $11,391
- IRR
- 42.9%
- Equity multiple
- 5.07×
- Total profit
- $87,092
- Equity at exit
- $6,606
Cash invested: $21,392 (down + closing). Projections, not guarantees.
Landlord ↔ Tenant lean methodology
- Overall (STATE)
- 90 Strongly Landlord-Friendly
- State Louisiana
- 90 Strongly Landlord-Friendly · R+12
- County
- — inherits STATE
- City
- — inherits STATE
ZIP-level market 71203
- Home prices YoY
- -32.4%
- Active inventory
- 437
- Price-to-rent
- 4.0×
Monthly cashflow live
- Estimated rent
- $1,579 medium interval (Pro) →
- Mortgage (P&I)
- −$401
- Tax from tax record
- −$104 /mo · $1,251/yr
- Insurance
- −$32
- HOA
- −$0
- Vacancy / Maint / Mgmt
- −$332
- Net cashflow
- $711
Break-even live
UW: 25.0% down · 7.5% · 30yr · 1.5% tax · 5.0% vac · 8.0% maint · 8.0% mgmt
Financing live
Cash to close
- Down payment
- $19,100
- Closing costs
- $2,292
- Reserves months
- —
- Total cash needed
- —
Loan-product check · same deal, 3 products live
Conventional
25% down · 7.5% · 30yr
- Down + closing
- —
- Monthly P&I
- —
- Monthly cashflow
- —
- DSCR
- —
- Eligible?
- —
Personal DTI + credit; lowest rate.
DSCR
20% down · 8.5% · 30yr
- Down + closing
- —
- Monthly P&I
- —
- Monthly cashflow
- —
- DSCR
- —
- Eligible?
- —
No personal income docs; deal must DSCR.
Hard money
10% down · 12.0% · 12mo
- Down + closing
- —
- Monthly P&I
- —
- Monthly cashflow
- —
- DSCR
- —
- Eligible?
- —
Short-term bridge; refi at stabilization.
Rent comps 3 comps
| Address | Beds | Baths | Sqft | Rent | $/sqft | DOM | Units | Dist |
|---|---|---|---|---|---|---|---|---|
| 3418 Medical Park Dr Unit 103 Monroe, LA | 2.0 | 2.0 | 900 | $2,000 | $2.22 | 20d | 1 | 0.72mi |
| 3200 Sterlington Rd Unit HC Monroe, LA | 2.0 | 2.0 | 1112 | $1,150 | $1.03 | 20d | 1 | 0.99mi |
| 323 Woodale Dr Monroe, LA | 1.0–2.0 | 1.0–2.5 | 962 | $1,120 | $1.16 | 43d | 8 | 1.29mi |
Listing history 24 events
-
2026-06-19days on market $76,400 Active 108 DOM
-
2026-06-18days on market $76,400 Active 107 DOM
-
2026-06-17days on market $76,400 Active 106 DOM
-
2026-06-16days on market $76,400 Active 105 DOM
-
2026-06-15days on market $76,400 Active 104 DOM
-
2026-06-14days on market $76,400 Active 102 DOM
-
2026-06-13days on market $76,400 Active 101 DOM
-
2026-06-10days on market $76,400 Active 99 DOM
-
2026-06-09days on market $76,400 Active 98 DOM
-
2026-06-08days on market $76,400 Active 97 DOM
-
2026-06-07remarks 69-char remark
-
2026-06-07days on market $76,400 Active 96 DOM
-
2026-06-03days on market $76,400 Active 92 DOM
-
2026-06-02days on market $76,400 Active 91 DOM
-
2026-06-01days on market $76,400 Active 90 DOM
-
2026-05-31days on market $76,400 Active 89 DOM
-
2026-05-30days on market $76,400 Active 88 DOM
-
2026-05-06price $76,400 66-char remark
Show marketing remark (66 chars)
3 BR, 2BA home on a tree shaded lot, front porch, open floor plan,
-
2026-04-02price $86,400 66-char remark
Show marketing remark (66 chars)
3 BR, 2BA home on a tree shaded lot, front porch, open floor plan,
-
2026-02-25$92,400 Active 66-char remark
Show marketing remark (66 chars)
3 BR, 2BA home on a tree shaded lot, front porch, open floor plan,
-
2014-05-12$87,500
-
2010-01-27soldstatus
-
2001-02-01soldstatus
-
2000-05-01soldstatus
ⓘ Source: listings_history table (triggers on properties + properties_extension) + one-shot
backfill from property_details.listing_events for pre-trigger history.
Tax reassessment forecast LA · Resets to sale price
- Current annual tax
- $1,251 · $104/mo
- Projected year-2 tax
- $1,251 · $104/mo
- Expected delta
- $0/yr ($0/mo · 0.0%)
ⓘ Screening estimate from a state-policy table — verify with the county assessor before closing.
Climate risk First Street
- Flood 1/10 Low FEMA zone X (shaded) · 0% chance over 30 yrs
- Wildfire 3/10 Moderate
- Heat 7/10 Severe 7 d/yr ≥111°F today · 20 d/yr by 30 yrs out
- Wind 6/10 Major 69% chance of damaging wind over 30 yrs
- Air quality 2/10 Low 1 unhealthy d/yr today · 1 by 30 yrs out
Nearby sold comps map
Loading sold comps map…
Walkable amenities ~0.75 mi
Loading nearby amenities…
Taxation est. · year 1
- Rental income
- $18,951
- − Mortgage interest
- −$4,280
- − Property taxes
- −$1,251
- − Insurance
- −$382
- − Repairs & maintenance
- −$1,516
- − Management
- −$1,516
- − Depreciation
- −$2,223
- Taxable income
- $7,784
- Est. tax owed @ 24.0%
- −$1,868
- After-tax cash flow
- $6,663/yr
For passive investors: Depreciation is non-cash, so a rental often shows a tax loss while cash-flowing — sheltering income. Rental losses are passive: they offset passive income freely, and up to $25,000/yr can offset ordinary (W-2) income if you actively participate and your MAGI is under $100k (phasing out to $0 by $150k); unused losses carry forward. On sale, claimed depreciation is recaptured at up to 25%, and gains may owe capital-gains tax (a 1031 exchange can defer both). Figures are a year-1 estimate at your 24.0% rate — not tax advice; consult a CPA.
Schools (NCES district)
- District
- Ouachita Parish
- NCES district ID
- 2201200
- Math proficiency
- 31% ▼ -38.00%
- Reading proficiency
- 45% ▼ -31.00%
- Median HH income
- $43,316
- Composite
- 32.14/100
- National rank
- #5791
- State rank
- #26 of 98 in LA
Livability — Monroe
- Score
- 66/100
- State rank
- #128
- US rank
- #11948
Category grades
Schools grade is shown separately in the Schools card above.
Census & demographics
- County
- Ouachita Parish · 118,340 people
- City population
- 60,136
- Metro
- Monroe, LA
- Population (ZIP)
- 38,354
- Household income
- $52,326
- Rent vs Own
- Severe rent burden
- 2085.0
Population outlook (Ouachita County) Hauer SSP2
- Today (2025)
- 163,370 people
- By 2030
- 165,520 · +1.3%
- By 2040
- 167,652 · +2.6%
- By 2050
- 166,699 · +2.0%
- By 2075
- 156,348 · -4.3%
- By 2100
- 134,102 · -17.9%
Race, ethnicity, and origin ACS 2023
- Neighborhood character
- Diverse neighborhood (Simpson 0.57)
- Race & ethnicity
- Black 48% White 45% Two or more races 4% Hispanic / Latino 3% Asian 1%
- Common ancestry
- Lithuanian 3% Slovak 1% Serbian 1%
- Foreign-born
- 3% · Canada
- Languages at home
- 96% English-only · Spanish 2% Other Indo-European 1%
Political lean MEDSL · Ouachita
- 2024 margin
- Strong R (+27.9) · D 35.5% · R 63.3% · Other 1.2%
- 2008→2024 swing
- -2.7pp toward R · 2008: -25.2pp · 2024: -27.9pp
- All cycles
- 2024: R+27.9 2020: R+23.6 2016: R+25.4 2012: R+20.9 2008: R+25.2
Not yet ingested
- Civics
- —
Market trends
- HPI YoY
- ▼ -99.01%
- Current HPI
- 206.1948
- Rent YoY
- —
- Metro
- Monroe, LA
- State GDP YoY
- ▲ 3.29%
- F500 in state
- 10
Industry mix (Fortune 500 HQ in LA)
| Industry | F500 HQs | Revenue |
|---|---|---|
| Telecommunications | 2 | $23B |
|
||
| Utilities | 1 | $12B |
|
||
| Wholesale / Distribution | 1 | $5B |
|
||
| Advertising | 1 | $2B |
|
||
Price history
-12.7% since first listed7 events — show timeline
- 2026-05-06 Price Changed $76,400 NELABOR
- 2026-04-02 Price Changed $86,400 NELABOR
- 2026-02-25 Listed $92,400 NELABOR
- 2014-05-12 Listed $87,500 NELABOR
- 2010-01-27 Sold (Public Records) — Public Records
- 2001-02-01 Sold (Public Records) — Public Records
- 2000-05-01 Sold (Public Records) — Public Records
Property tax history
+0.6%/yrLatest (2025): $1,251 · -0.3% YoY. Source: county tax records.
Cash-flow waterfall
monthlySold comps — $/sqft
last 12 mo · ≤1 miLoading sold comps…