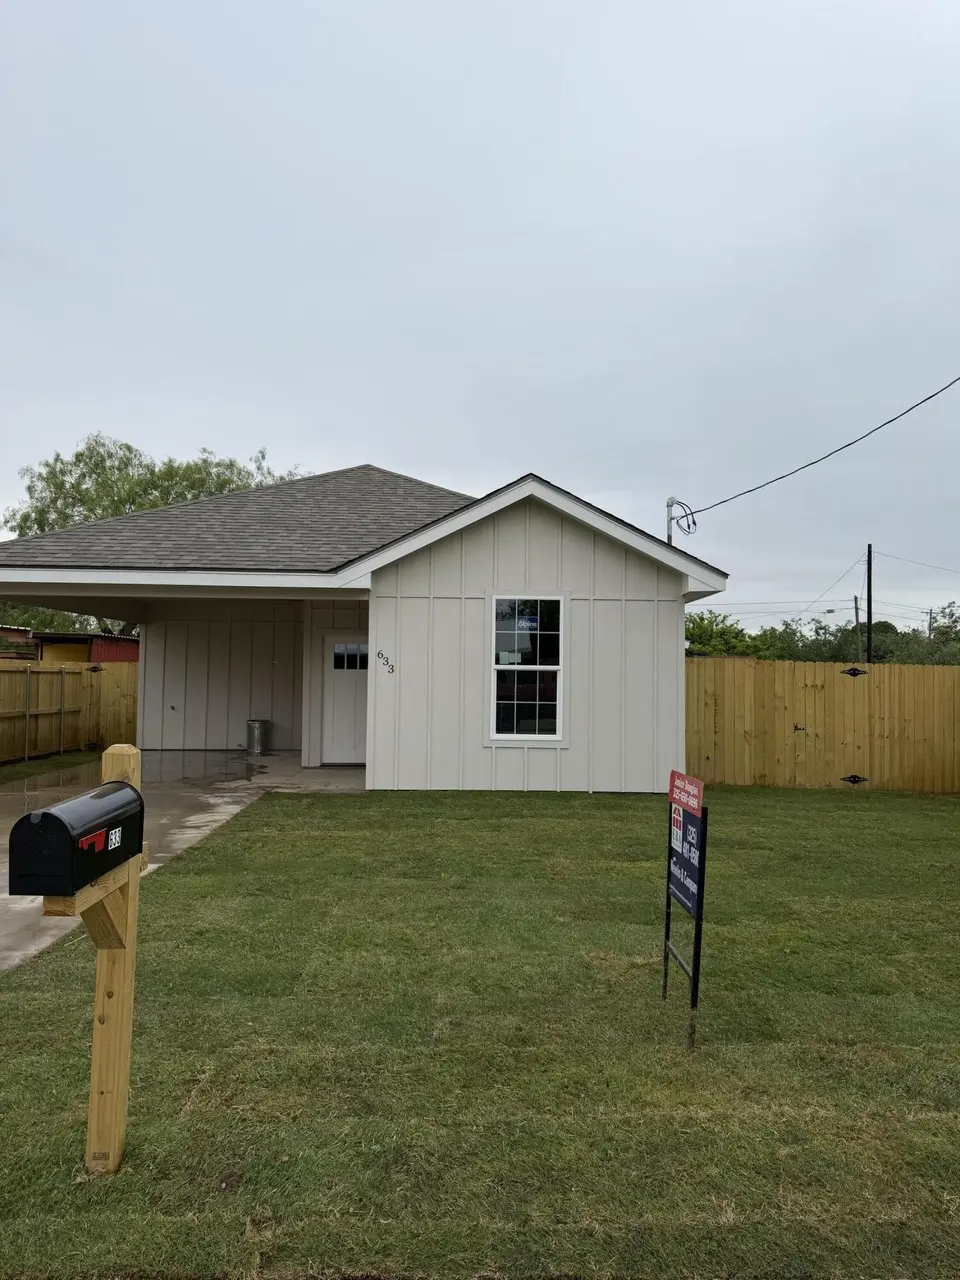
633 W Ave Z · San Angelo, TX
Flood risk 1/10 · Minimal
- FEMA flood zone
- X (unshaded)
- Chance of flooding over 30 yrs
- 0.0%
- Est. flood insurance / yr
- $507 – $1,088
Fire risk 6/10 · Moderate
- Est. fire insurance / yr
- $1,222 – $2,270
Heat risk 7/10 · Major
- Hot days now (above 104°F)
- 7 days/yr
- Hot days in 30 yrs
- 23 days/yr
Wind risk 4/10 · Minor
- Chance of severe wind over 30 yrs
- 14.0%
Air-quality risk 1/10 · Minimal
- Unhealthy air days now
- 0 days/yr
- Unhealthy air days in 30 yrs
- 0 days/yr
Risk factors via First Street. Map © Google.
Why this score? — see what drove the F grade
The composite is a weighted blend of 9 inputs, each scored 0–100. Each bar is that input's sub-score; the figure is the points it added to the 100-point composite (weight × sub-score).
- ARV discount +7.9/15.0
- Cash flow +7.2/30.0
- Rent growth +4.6/5.0
- Livability +3.7/5.0
- Schools +2.6/10.0
- Condition / age +2.5/5.0
- DSCR +1.4/10.0
- 1% rule +0.9/10.0
- Appreciation +0.0/10.0
$204,500
🖨 Deal sheet (PDF) 📄 Offer letter ✓ Due diligence
Listing remarks
Discover this stunning new construction family home in Ben Ficklin Edition by TaylorMade Custom homes - Signature Homes Collection. This 3-bedroom, 2-bath residence is thoughtfully designed with premium finishes throughout, featuring solid surface countertops, polished concrete floors, and stainless steel appliances. Complete with a convenient carport, this move-in ready home also includes a 1-2-10 builder warranty, offering peace of mind along with modern style and comfort. Renderings are for illustration purposes only, final finishes may vary.
Key facts
- New construction
- Carport
- Premium finishes
Tags
Property features AI
Finance
- Other: Residential property type
Exterior
- Parking: Carport (1 space)
- Security: Smoke detector(s)
- Utilities: Public water; Public sewer; Electricity connected; Water connected; Sewer connected
- Home design: Single family residence; One level; New construction
- Construction: Frame construction; Slab foundation; Composition roof; Built as new construction
- Exterior features: Front porch; Interior lot; City street frontage; Public maintained road; Dirt road surface
Interior
- Kitchen: Dishwasher; Electric range; Microwave
- Flooring: Brick; Concrete
- Bathrooms: 2 full bathrooms
- Heating & cooling: Central heating; Central air; Ceiling fan(s)
- Interior features: Smart thermostat; Ceiling fans; Window coverings; Smoke detector(s)
- Laundry & utility: Washer hookup; Electric dryer hookup; Electric water heater
Neighborhood map
What this means for you Summary
Snapshot
- This is a 3-bed/2.0-bath single-family listed at $204k.
Deal economics
- At list price, monthly cash flow is $-283 ($-3k/yr) — negative.
- To cash-flow at today's rent, offer at most $154k (24.5% below list).
- To meet the 1% rule (rent ≥ 1% of price), the offer needs to be $121k (41.1% below list).
- Recommended offer: $121k (41.1% below list) — sets the bar for 1% rule.
- Cap rate 4.6% vs local median 3.8% in San Angelo — meaningfully above typical; check what's discounted (condition, days-on-market, listing class) to confirm the premium yield is real.
Location & tenants
- Location reads 73/100 on livability (#199 in TX) — a middle-class / working-renter tenant base. Strengths: cost of living A+, housing A+, health & safety A+; Watch: employment C-, amenities F, commute F.
- San Angelo ISD (urban): math 27% / reading 33% proficiency, ranked #627 of 826 in TX (top 76%) — families likely to look elsewhere, expect single-tenant / working-renter base with shorter leases.
- Zoned schools: Lamar El (math 41% / reading 46%, grade F, #1,269 of 4,322 statewide, top 30%, 515 students, 43% FRL); Glenn Middle (math 25% / reading 29%, grade F, #1,177 of 1,662 statewide, top 72%, 1,258 students, 53% FRL); Central H S (math 22% / reading 43%, grade F, #1,029 of 1,632 statewide, top 64%, 3,065 students, 48% FRL) — zoned schools at 48% FRL track the district average.
- Market conditions: Rents rising fast (+8.5%/yr); 230 active listings in the ZIP; 233 units permitted in Tom Green County in 2024 (0 in 5+ unit buildings).
Forward outlook
- Local home prices are declining (-3.0%/yr); year-one equity from $1k of loan paydown is wiped out by about $6k of value loss. Plan a longer hold.
- Tom Green County population projected at +35% by 2050 — long-run rental-demand tailwind backs the buy-and-hold thesis.
Negotiation context
- Only 5 days on market — expect competitive offers; lowballing is unlikely to land.
- 4 sale attempts with the ask held roughly flat each time — persistent listings suggest the price (not the market) is what's stuck; bring a comps-based counter.
Risks & watch-outs
- Climate carrying-cost: major wildfire risk; extreme-heat days projected 7→23/yr by 2055 (HVAC capex compounding) — expect insurance premiums to compound above CPI over the hold.
Questions for the listing agent
- What do current leases actually rent for vs. the listed asking? Can we see a recent rent roll and the last 12 months of T-12 income?
- Is there a deadline driving the sale (1031 exchange, divorce, estate, relocation)? That informs how much negotiation room exists.
- Schools are F-rated, which usually means shorter tenancies and higher turnover. Who's the typical renter profile here, and what's been the actual vacancy rate?
- The area grade is low — what's the realistic commute time and amenity access for the typical tenant pool here? Any planned neighborhood developments (good or bad) we should know about?
- What's the average days-on-market for RENTAL listings here right now (not sales)? A rising rental-DOM trend means longer vacancies and softer asking-rent achievability than the comps imply.
- What's the recent tenant-quality profile in this submarket — average credit score on applications, eviction rate, late-payment / NSF rate, and stable-employment percentage? A property-management company in the area should have these aggregated.
- How much new for-sale + rental construction is in the pipeline within 1–3 miles? Heavy new supply typically softens prices + rents 12–24 months out; constrained supply supports both.
Investment metrics
- 1% rule
- 0.59% ✗
- Cap rate
- 4.63%
- Cash-on-cash
- -5.94%
- DSCR
- 0.74
- GRM
- 14.1
CMA / ARV
- ARV (median comp)
- $206,388
- List price
- $204,500
- Delta
- -0.91%
- Verdict
- FAIR
- Comps
- 20 within 1.0 mi
Projected returns pro-forma
-3.0% appreciation · 8.0% rent growth · sell at horizon
- IRR
- -22.0%
- Equity multiple
- 0.22×
- Total profit
- $-44,898
- Equity at exit
- $30,492
- IRR
- -7.9%
- Equity multiple
- 0.41×
- Total profit
- $-33,708
- Equity at exit
- $17,681
Cash invested: $57,260 (down + closing). Projections, not guarantees.
Landlord ↔ Tenant lean methodology
- Overall (STATE)
- 87 Strongly Landlord-Friendly
- State Texas
- 87 Strongly Landlord-Friendly · R+5
- County
- — inherits STATE
- City
- — inherits STATE
ZIP-level market 76903
- Rents YoY
- 8.5%
- Active inventory
- 230
- Price-to-rent
- 14.1×
Monthly cashflow live
- Estimated rent
- $1,205 medium interval (Pro) →
- Mortgage (P&I)
- −$1,072
- Tax from tax record
- −$78 /mo · $930/yr
- Insurance
- −$85
- HOA
- −$0
- Lot rent
- −$0
- Vacancy / Maint / Mgmt
- −$253
- Net cashflow
- $-283
Break-even live
Sensitivity live
| Price | -10% $-167 | -5% $-225 | +0% $-283 | +5% $-341 | +10% $-399 |
|---|---|---|---|---|---|
| Rent | -10% $-378 | -5% $-331 | +0% $-283 | +5% $-236 | +10% $-188 |
| Rate | -1.0pp $-180 | -0.5pp $-231 | base $-283 | +0.5pp $-336 | +1.0pp $-390 |
UW: 25.0% down · 7.5% · 30yr · 1.5% tax · 5.0% vac · 8.0% maint · 8.0% mgmt
Financing live
Cash to close
- Down payment
- $51,125
- Closing costs
- $6,135
- Reserves months
- —
- Total cash needed
- —
Loan-product check · same deal, 3 products live
Conventional
25% down · 7.5% · 30yr
- Down + closing
- —
- Monthly P&I
- —
- Monthly cashflow
- —
- DSCR
- —
- Eligible?
- —
Personal DTI + credit; lowest rate.
DSCR
20% down · 8.5% · 30yr
- Down + closing
- —
- Monthly P&I
- —
- Monthly cashflow
- —
- DSCR
- —
- Eligible?
- —
No personal income docs; deal must DSCR.
Hard money
10% down · 12.0% · 12mo
- Down + closing
- —
- Monthly P&I
- —
- Monthly cashflow
- —
- DSCR
- —
- Eligible?
- —
Short-term bridge; refi at stabilization.
Listing history 22 events
-
2026-06-23days on market $204,500 Active 5 DOM
-
2026-06-22days on market $204,500 Active 4 DOM
-
2026-06-19days on market $204,500 Active 2 DOM
-
2026-06-17days on market $204,500 Active 1 DOM
-
2026-06-17days on market $204,500 Active 69 DOM
-
2026-06-16days on market $204,500 Active 68 DOM
-
2026-06-15days on market $204,500 Active 67 DOM
-
2026-06-14days on market $204,500 Active 65 DOM
-
2026-06-13days on market $204,500 Active 64 DOM
-
2026-06-10days on market $204,500 Active 62 DOM
-
2026-06-09days on market $204,500 Active 61 DOM
-
2026-06-08days on market $204,500 Active 60 DOM
-
2026-06-07days on market $204,500 Active 59 DOM
-
2026-06-02days on market $204,500 Active 54 DOM
-
2026-06-01days on market $204,500 Active 53 DOM
-
2026-05-31days on market $204,500 Active 52 DOM
-
2026-05-30days on market $204,500 Active 51 DOM
-
2026-04-09$204,500 Active 551-char remark
-
2026-02-13$204,500 Active
-
2026-01-15$204,500 Active
-
2026-01-08$204,500 Active
-
2025-06-06soldstatus
ⓘ Source: listings_history table (triggers on properties + properties_extension) + one-shot
backfill from property_details.listing_events for pre-trigger history.
Tax reassessment forecast TX · Resets to sale price
- Current annual tax
- $930 · $78/mo
- Projected year-2 tax
- $3,742 · $312/mo
- Expected delta
- +$2,812/yr (+$234/mo · 302.2%)
ⓘ Screening estimate from a state-policy table — verify with the county assessor before closing.
Climate risk First Street
- Flood 1/10 Low FEMA zone X (unshaded) · 0% chance over 30 yrs
- Wildfire 6/10 Major
- Heat 7/10 Severe 7 d/yr ≥104°F today · 23 d/yr by 30 yrs out
- Wind 4/10 Moderate 14% chance of damaging wind over 30 yrs
- Air quality 1/10 Low 0 unhealthy d/yr today · 0 by 30 yrs out
Nearby sold comps map
Loading sold comps map…
Walkable amenities ~0.75 mi
Loading nearby amenities…
Taxation est. · year 1
- Rental income
- $14,460
- − Mortgage interest
- −$11,455
- − Property taxes
- −$930
- − Insurance
- −$1,022
- − Repairs & maintenance
- −$1,157
- − Management
- −$1,157
- − Depreciation
- −$5,949
- Taxable loss
- −$7,211
- Est. tax savings @ 24.0%
- +$1,731
- After-tax cash flow
- $-1,668/yr
For passive investors: Depreciation is non-cash, so a rental often shows a tax loss while cash-flowing — sheltering income. Rental losses are passive: they offset passive income freely, and up to $25,000/yr can offset ordinary (W-2) income if you actively participate and your MAGI is under $100k (phasing out to $0 by $150k); unused losses carry forward. On sale, claimed depreciation is recaptured at up to 25%, and gains may owe capital-gains tax (a 1031 exchange can defer both). Figures are a year-1 estimate at your 24.0% rate — not tax advice; consult a CPA.
Schools (NCES district)
- District
- San Angelo ISD
- NCES district ID
- 4838700
- Math proficiency
- 27% ▼ -9.00%
- Reading proficiency
- 33% ▼ -3.00%
- Median HH income
- $43,501
- Composite
- 25.56/100
- National rank
- #7427
- State rank
- #627 of 826 in TX
Livability — San Angelo
- Score
- 73/100
- State rank
- #199
- US rank
- #5030
Category grades
Schools grade is shown separately in the Schools card above.
Census & demographics
- Census place
- San Angelo, TX
- County
- Tom Green County · 113,188 people
- City population
- 81,357
- Metro
- San Angelo, TX
- Population (ZIP)
- 29,947
- Household income
- $49,498
- Rent vs Own
- Severe rent burden
- 1255.0
Population outlook (Tom Green County) Hauer SSP2
- Today (2025)
- 135,110 people
- By 2030
- 144,090 · +6.6%
- By 2040
- 162,561 · +20.3%
- By 2050
- 182,158 · +34.8%
- By 2075
- 232,274 · +71.9%
- By 2100
- 268,218 · +98.5%
Race, ethnicity, and origin ACS 2023
- Neighborhood character
- Diverse neighborhood (Simpson 0.56)
- Race & ethnicity
- Hispanic / Latino 56% White 36% Two or more races 26% Black 5%
- Hispanic origin (detail)
- Mexican 49% Puerto Rican 1%
- Common ancestry
- Italian 1% Serbian 1% Slovak 1%
- Foreign-born
- 10% · Canada
- Languages at home
- 66% English-only · Spanish 33%
Political lean MEDSL · Tom Green
- 2024 margin
- Solid R (+48.0) · D 25.5% · R 73.5% · Other 1.0%
- 2008→2024 swing
- -6.3pp toward R · 2008: -41.7pp · 2024: -48.0pp
- All cycles
- 2024: R+48.0 2020: R+44.4 2016: R+47.9 2012: R+47.9 2008: R+41.7
Not yet ingested
- Civics
- —
Market trends
- HPI YoY
- ▼ -164.90%
- Current HPI
- 217.0406
- Rent YoY
- ▲ 8.46%
- Metro
- San Angelo, TX
- State GDP YoY
- ▲ 3.95%
- F500 in state
- 110
Industry mix (Fortune 500 HQ in TX)
| Industry | F500 HQs | Revenue |
|---|---|---|
| Energy | 16 | $1,198B |
|
||
| Technology | 5 | $198B |
|
||
| Engineering / Construction | 4 | $72B |
|
||
| Energy Services | 3 | $60B |
|
||
| Utilities | 3 | $41B |
|
||
| Healthcare | 2 | $330B |
|
||
Price history
+0.0% since first listed5 events — show timeline
- 2026-06-17 Listed $204,500 SAAR TX
- 2026-02-13 Listed $204,500 SAAR TX
- 2026-01-15 Listed $204,500 SAAR TX
- 2026-01-08 Listed $204,500 SAAR TX
- 2025-06-06 Sold (Public Records) — Public Records
Property tax history
+10.9%/yrLatest (2025): $930 · +19.4% YoY. Source: county tax records.
Cash-flow waterfall
monthlySold comps — $/sqft
last 12 mo · ≤1 miLoading sold comps…