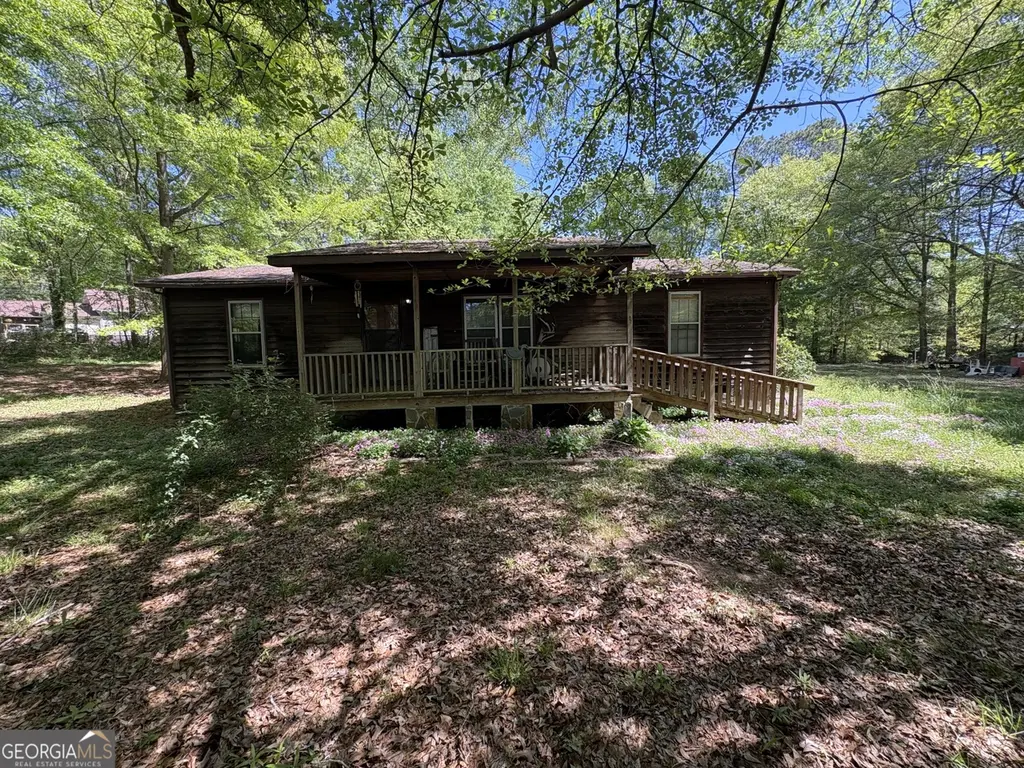
2387 Highway 16 W · Whitesburg, GA
Flood risk 1/10 · Minimal
- FEMA flood zone
- X (unshaded)
- Chance of flooding over 30 yrs
- 0.0%
- Est. flood insurance / yr
- $507 – $1,088
Fire risk 4/10 · Minor
- Est. fire insurance / yr
- $963 – $1,789
Heat risk 6/10 · Moderate
- Hot days now (above 104°F)
- 7 days/yr
- Hot days in 30 yrs
- 19 days/yr
Wind risk 6/10 · Moderate
- Chance of severe wind over 30 yrs
- 27.0%
Air-quality risk 3/10 · Minor
- Unhealthy air days now
- 3 days/yr
- Unhealthy air days in 30 yrs
- 3 days/yr
Risk factors via First Street. Map © Google.
Why this score? — see what drove the C+ grade
The composite is a weighted blend of 9 inputs, each scored 0–100. Each bar is that input's sub-score; the figure is the points it added to the 100-point composite (weight × sub-score).
- Cash flow +26.2/30.0
- ARV discount +9.7/15.0
- DSCR +8.9/10.0
- 1% rule +6.3/10.0
- Schools +3.6/10.0
- Rent growth +3.2/5.0
- Livability +2.7/5.0
- Condition / age +2.5/5.0
- Appreciation +0.0/10.0
$165,000
🖨 Deal sheet 📄 Offer letter ✓ Due diligence
Listing remarks
Investor special , fixer upper ranch home on over 2 acres. This large lot features 2 separate street entrances and a large outbuilding with electricity that also has covered space on both sides. This home has 3 bedrooms and 2 baths and offers a split bedroom layout.
Key facts
- 2.6 acre lot
- Garage
- Built 1986
Property features AI
Finance
- Other: Lot approximately 2.6 acres
- HOA & community: No HOA
Exterior
- Parking: Has garage; Detached parking shed with storage
- Utilities: Public water available; Septic tank sewer; Electricity available; Cable available; High speed internet available
- Home design: Single family residence; One story; House structure; Residential resale property
- Construction: Built in 1986; Wood siding construction; Composition roof; Crawl space foundation
- Exterior features: Level lot; Composition roof; Rough-sawn lumber and wood siding
Interior
- Kitchen: Refrigerator; Gas water heater
- Bedrooms: 3 bedrooms (all on the main level)
- Flooring: Carpet; Vinyl
- Bathrooms: 2 full bathrooms (main level)
- Heating & cooling: Central heating; Central air
- Interior features: Roommate plan; Crawl space basement; Separate dining room
- Laundry & utility: Washer; Dryer; Mud room laundry
Neighborhood map
What this means for you Summary
Snapshot
- This is a 3-bed/2.0-bath single-family listed at $165k.
Deal economics
- At list price, monthly cash flow is $421 ($5k/yr) — positive.
- The deal already cash-flows at list — no discount required.
- Meets the 1% rule at list price ($2k rent vs $165k).
- Recommended offer: $160k (3.0% below list) — sets the bar for market timing.
- Cap rate 9.4% vs local median 2.1% in Whitesburg — top-decile yield for the area; either an underpriced asset or a hidden risk that comps aren't pricing in. Stress-test before assuming the spread holds.
Location & tenants
- Location reads 54/100 on livability (#548 in GA) — a working-class tenant base; expect higher turnover. Strengths: cost of living A+, housing A+; Watch: crime D-, amenities F, commute F.
- Coweta County (rural): math 37% / reading 43% proficiency, ranked #36 of 174 in GA (top 21%) — families likely to look elsewhere, expect single-tenant / working-renter base with shorter leases.
- Zoned schools: Arnco-Sargent Elementary School (math 32% / reading 27%, grade F, #633 of 1,228 statewide, top 54%, 373 students, 64% FRL); Evans Middle School (math 26% / reading 40%, grade F, #213 of 470 statewide, top 47%, 770 students, 53% FRL); Newnan High School (math 42% / reading 26%, grade F, #93 of 424 statewide, top 23%, 2,335 students, 41% FRL) — zoned schools average 53% FRL vs 37% district-wide (16 pts higher); higher-poverty schools than district average — tighter screening recommended.
- Market conditions: Rents rising (+2.9%/yr); 529 active listings in the ZIP; solid renter incomes; 963 units permitted in Coweta County in 2024 (8 in 5+ unit buildings).
Forward outlook
- Local home prices are declining (-3.0%/yr); year-one equity from $1k of loan paydown is wiped out by about $5k of value loss. Plan a longer hold.
- Coweta County population projected at +31% by 2050 — long-run rental-demand tailwind backs the buy-and-hold thesis.
Negotiation context
- It's been on market 32 days — a 3% lower offer ($160k) is reasonable based on typical stale-listing flexibility.
- Current owner paid $125k; 32% above their basis — modest negotiation headroom, anchor on the comps not their cost.
Risks & watch-outs
- Climate carrying-cost: major wind risk, 27% chance of damaging wind over 30y; extreme-heat days projected 7→19/yr by 2055 (HVAC capex compounding) — expect insurance premiums to compound above CPI over the hold.
Questions for the listing agent
- It's been on market 32 days. Have you received any prior offers? Is the seller open to a 3% concession, seller financing, or rate buy-down credit?
- Is there a deadline driving the sale (1031 exchange, divorce, estate, relocation)? That informs how much negotiation room exists.
- Crime grade is D in this area — have there been break-ins, vandalism, or insurance claims at this property in the last 3 years? What carrier currently insures it and at what premium?
- What's the average days-on-market for RENTAL listings here right now (not sales)? A rising rental-DOM trend means longer vacancies and softer asking-rent achievability than the comps imply.
- What's the recent tenant-quality profile in this submarket — average credit score on applications, eviction rate, late-payment / NSF rate, and stable-employment percentage? A property-management company in the area should have these aggregated.
- How much new for-sale + rental construction is in the pipeline within 1–3 miles? Heavy new supply typically softens prices + rents 12–24 months out; constrained supply supports both.
Investment metrics
- 1% rule
- 1.13% ✓
- Cap rate
- 9.35%
- Cash-on-cash
- 10.93%
- DSCR
- 1.49
- GRM
- 7.4
CMA / ARV
- ARV (median comp)
- $173,416
- List price
- $165,000
- Delta
- -4.85%
- Verdict
- FAIR
- Comps
- 20 within 1.0 mi
Show comp detail 4 sales within ~0.75 mi
| Address | Dist | Beds/Ba | Sqft | Sold | Price | $/sf | Match |
|---|---|---|---|---|---|---|---|
| 2387 Highway 16 W | 0.00mi | 3/2.0 | 1,200 (0%) | 0mo | $125,000 | $104 | 100 |
| 302 Old Carrollton Rd | 0.21mi | 3/2.0 | 1,088 (-9%) | 14mo | $251,324 | $231 | 63 |
| 105 Old Carrollton Rd | 0.36mi | 3/1.0 | 1,104 (-8%) | 14mo | $235,000 | $213 | 54 |
| 60 Sargent New St | 0.71mi | 3/1.0 | 1,296 (+8%) | 5mo | $80,000 | $62 | 45 |
Match score weights: distance 35% · size 25% · config 20% · recency 20%. Top-matched comps best support the ARV.
Projected returns pro-forma
-3.0% appreciation · 2.87% rent growth · sell at horizon
- IRR
- -0.1%
- Equity multiple
- 1.00×
- Total profit
- $-215
- Equity at exit
- $24,602
- IRR
- 9.4%
- Equity multiple
- 1.72×
- Total profit
- $33,200
- Equity at exit
- $14,266
Cash invested: $46,200 (down + closing). Projections, not guarantees.
Landlord ↔ Tenant lean methodology
- Overall (STATE)
- 90 Strongly Landlord-Friendly
- State Georgia
- 90 Strongly Landlord-Friendly · R+3
- County
- — inherits STATE
- City
- — inherits STATE
ZIP-level market 30263
- Home prices YoY
- -34.5%
- Rents YoY
- 2.9%
- Active inventory
- 529
- Price-to-rent
- 7.4×
Monthly cashflow live
- Estimated rent
- $1,856 medium interval (Pro) →
- Mortgage (P&I)
- −$865
- Tax from tax record
- −$112 /mo · $1,342/yr
- Insurance
- −$69
- HOA
- −$0
- Vacancy / Maint / Mgmt
- −$390
- Net cashflow
- $421
Break-even live
UW: 25.0% down · 7.5% · 30yr · 1.5% tax · 5.0% vac · 8.0% maint · 8.0% mgmt
Financing live
Cash to close
- Down payment
- $41,250
- Closing costs
- $4,950
- Reserves months
- —
- Total cash needed
- —
Loan-product check · same deal, 3 products live
Conventional
25% down · 7.5% · 30yr
- Down + closing
- —
- Monthly P&I
- —
- Monthly cashflow
- —
- DSCR
- —
- Eligible?
- —
Personal DTI + credit; lowest rate.
DSCR
20% down · 8.5% · 30yr
- Down + closing
- —
- Monthly P&I
- —
- Monthly cashflow
- —
- DSCR
- —
- Eligible?
- —
No personal income docs; deal must DSCR.
Hard money
10% down · 12.0% · 12mo
- Down + closing
- —
- Monthly P&I
- —
- Monthly cashflow
- —
- DSCR
- —
- Eligible?
- —
Short-term bridge; refi at stabilization.
Listing history 8 events
-
2026-06-08statusdays on market $165,000 Under Contract 32 DOM
-
2026-06-07days on market $165,000 Active 31 DOM
-
2026-06-04days on market $165,000 Active 28 DOM
-
2026-06-03days on market $165,000 Active 27 DOM
-
2026-06-02days on market $165,000 Active 26 DOM
-
2026-06-01days on market $165,000 Active 25 DOM
-
2026-05-31days on market $165,000 Active 24 DOM
-
2026-05-06$165,000 New 379-char remark
ⓘ Source: listings_history table (triggers on properties + properties_extension) + one-shot
backfill from property_details.listing_events for pre-trigger history.
Tax reassessment forecast GA · Resets to sale price
- Current annual tax
- $1,342 · $112/mo
- Projected year-2 tax
- $1,518 · $126/mo
- Expected delta
- +$176/yr (+$15/mo · 13.1%)
ⓘ Screening estimate from a state-policy table — verify with the county assessor before closing.
Climate risk First Street
- Flood 1/10 Low FEMA zone X (unshaded) · 0% chance over 30 yrs
- Wildfire 4/10 Moderate
- Heat 6/10 Major 7 d/yr ≥104°F today · 19 d/yr by 30 yrs out
- Wind 6/10 Major 27% chance of damaging wind over 30 yrs
- Air quality 3/10 Moderate 3 unhealthy d/yr today · 3 by 30 yrs out
Nearby sold comps map
Loading sold comps map…
Walkable amenities ~0.75 mi
Loading nearby amenities…
Taxation est. · year 1
- Rental income
- $22,277
- − Mortgage interest
- −$9,243
- − Property taxes
- −$1,342
- − Insurance
- −$825
- − Repairs & maintenance
- −$1,782
- − Management
- −$1,782
- − Depreciation
- −$4,800
- Taxable income
- $2,503
- Est. tax owed @ 24.0%
- −$601
- After-tax cash flow
- $4,448/yr
For passive investors: Depreciation is non-cash, so a rental often shows a tax loss while cash-flowing — sheltering income. Rental losses are passive: they offset passive income freely, and up to $25,000/yr can offset ordinary (W-2) income if you actively participate and your MAGI is under $100k (phasing out to $0 by $150k); unused losses carry forward. On sale, claimed depreciation is recaptured at up to 25%, and gains may owe capital-gains tax (a 1031 exchange can defer both). Figures are a year-1 estimate at your 24.0% rate — not tax advice; consult a CPA.
Schools (NCES district)
- District
- Coweta County
- NCES district ID
- 1301500
- Math proficiency
- 37% ▼ -16.00%
- Reading proficiency
- 43% ▼ -11.00%
- Median HH income
- $62,978
- Composite
- 35.72/100
- National rank
- #4860
- State rank
- #36 of 174 in GA
Livability — Whitesburg
- Score
- 54/100
- State rank
- #548
- US rank
- #24134
Category grades
Schools grade is shown separately in the Schools card above.
Census & demographics
- County
- Coweta County · 148,589 people
- Metro
- Atlanta-Sandy Springs-Alpharetta, GA
- Population (ZIP)
- 61,695
- Household income
- $78,992
- Rent vs Own
- Severe rent burden
- 1320.0
Population outlook (Coweta County) Hauer SSP2
- Today (2025)
- 162,063 people
- By 2030
- 173,373 · +7.0%
- By 2040
- 194,658 · +20.1%
- By 2050
- 212,246 · +31.0%
- By 2075
- 246,544 · +52.1%
- By 2100
- 257,059 · +58.6%
Race, ethnicity, and origin ACS 2023
- Neighborhood character
- Diverse neighborhood (Simpson 0.57)
- Race & ethnicity
- White 60% Black 25% Hispanic / Latino 9% Two or more races 4% Asian 2%
- Hispanic origin (detail)
- Mexican 4% Puerto Rican 2%
- Common ancestry
- Slovak 2% Lithuanian 1% Serbian 1%
- Foreign-born
- 8% · Canada, China, Jamaica
- Languages at home
- 90% English-only · Spanish 7% Chinese 1% Other Indo-European 1%
Political lean MEDSL · Coweta
- 2024 margin
- Solid R (+33.9) · D 32.7% · R 66.6%
- 2008→2024 swing
- +7.3pp toward D · 2008: -41.2pp · 2024: -33.9pp
- All cycles
- 2024: R+33.9 2020: R+35.5 2016: R+42.3 2012: R+44.1 2008: R+41.2
Not yet ingested
- Civics
- —
Market trends
- HPI YoY
- ▼ -131.23%
- Current HPI
- 249.0207
- Rent YoY
- ▲ 2.87%
- Metro
- Atlanta-Sandy Springs-Alpharetta, GA
- State GDP YoY
- ▲ 2.66%
- F500 in state
- 28
Industry mix (Fortune 500 HQ in GA)
| Industry | F500 HQs | Revenue |
|---|---|---|
| Paper / Packaging | 2 | $29B |
|
||
| Retail | 1 | $160B |
|
||
| Transportation / Logistics | 1 | $91B |
|
||
| Airlines | 1 | $62B |
|
||
| Consumer Goods | 1 | $47B |
|
||
| Utilities | 1 | $25B |
|
||
Price history
-24.2% since first listed3 events — show timeline
- 2026-06-10 Sold (MLS) $125,000 GAMLS
- 2026-06-08 Pending — GAMLS
- 2026-05-06 Listed $165,000 GAMLS
Property tax history
+12.3%/yrLatest (2025): $1,342 · +278.7% YoY. Source: county tax records.
Cash-flow waterfall
monthlySold comps — $/sqft
last 12 mo · ≤1 miLoading sold comps…