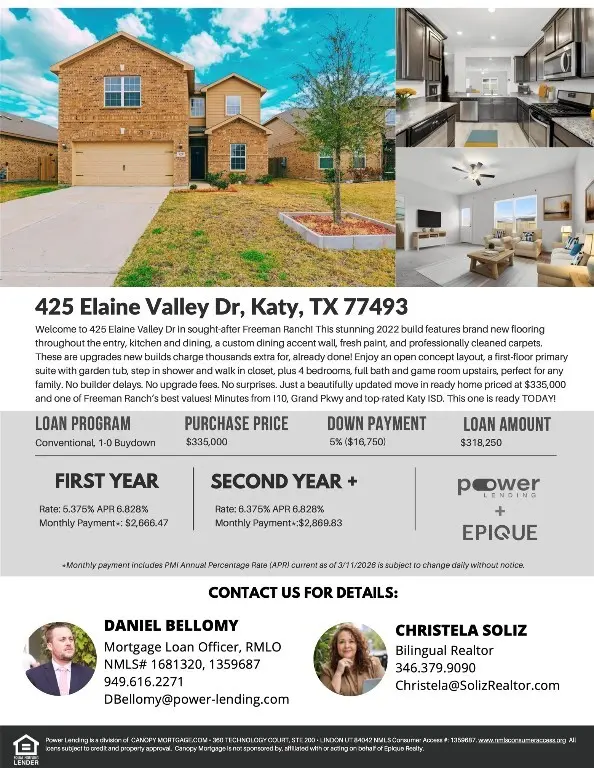
425 Elaine Valley Dr · Katy, TX
Flood risk 5/10 · Moderate
- FEMA flood zone
- X (unshaded)
- Chance of flooding over 30 yrs
- 0.67%
- Est. flood insurance / yr
- $507 – $1,088
Fire risk 4/10 · Minor
- Est. fire insurance / yr
- $1,222 – $2,270
Heat risk 8/10 · Major
- Hot days now (above 110°F)
- 7 days/yr
- Hot days in 30 yrs
- 22 days/yr
Wind risk 9/10 · Severe
- Chance of severe wind over 30 yrs
- 99.0%
Air-quality risk 2/10 · Minimal
- Unhealthy air days now
- 1 days/yr
- Unhealthy air days in 30 yrs
- 1 days/yr
Risk factors via First Street. Map © Google.
Why this score? — see what drove the D+ grade
The composite is a weighted blend of 9 inputs, each scored 0–100. Each bar is that input's sub-score; the figure is the points it added to the 100-point composite (weight × sub-score).
- Cash flow +14.4/30.0
- ARV discount +13.3/15.0
- 1% rule +5.6/10.0
- DSCR +4.4/10.0
- Condition / age +4.0/5.0
- Livability +3.8/5.0
- Rent growth +2.3/5.0
- Schools +2.0/10.0
- Appreciation +0.0/10.0
$300,000
🖨 Deal sheet 📄 Offer letter ✓ Due diligence
Listing remarks MLS
Welcome to 425 Elaine Valley the largest floor plan in Freeman Ranch! This stunning 5 bed, 2 bath, 2,586 sq ft move in ready home blends space, style, and thoughtful upgrades throughout. Fresh neutral paint sets a warm, welcoming tone from the moment you arrive. New luxury flooring flows through the front entry, kitchen, and dining room, while a custom built accent wall makes the dining space truly one of a kind. A whole home water softener adds everyday comfort and lasting value. Ask about our preferred lender's special buy-down program to lower your interest rate and reduce your monthly payment more home for less! Freeman Ranch offers easy access to top rated Katy ISD schools, shopping, and major freeways. Don't miss this rare opportunity to own the biggest floor plan in the neighborhood. Schedule your showing today!
Key facts
- Walk-in closet
- Water softener
- Open layout
Tags
Neighborhood map
What this means for you Summary
Snapshot
- This is a 5-bed/2.5-bath single-family listed at $300k. Condition is rated good.
Deal economics
- At list price, monthly cash flow is $59 ($709/yr) — positive.
- The deal already cash-flows at list — no discount required.
- Meets the 1% rule at list price ($3k rent vs $300k).
- Recommended offer: $264k (12.0% below list) — sets the bar for market timing.
- Cap rate 6.5% vs local median 3.0% in Katy — top-decile yield for the area; either an underpriced asset or a hidden risk that comps aren't pricing in. Stress-test before assuming the spread holds.
Location & tenants
- Location reads 76/100 on livability (#111 in TX, #3,613 nationally) — a middle-class / working-renter tenant base. Strengths: employment A+, cost of living A+, housing A+; Watch: crime C-, amenities D, commute F.
- Royal ISD (rural): math 23% / reading 23% proficiency, ranked #744 of 826 in TX (top 90%) — low school quality limits family demand, transient renter base, plan for 1-2y turnover; 77% free/reduced lunch — lower-income household profile, screen leases tightly.
- Market conditions: Rents soft (-0.8%/yr); 2696 active listings in the ZIP; 16 comparable units currently listed for rent nearby; rentals at typical pace (median 22d on market — plan ~3-4 weeks tenant-placement turnaround); high-income renter base; 483 units permitted in Waller County in 2024 (89 in 5+ unit buildings).
- This rent runs 32% of the median local income ($118k/yr) — at the standard rent-burdened threshold; future hikes will face affordability resistance.
Forward outlook
- Local home prices are declining (-3.0%/yr); year-one equity from $2k of loan paydown is wiped out by about $9k of value loss. Plan a longer hold.
- Waller County population projected at +62% by 2050 — long-run rental-demand tailwind backs the buy-and-hold thesis.
Negotiation context
- It's been on market 123 days — a 12% lower offer ($264k) is reasonable based on typical stale-listing flexibility.
- 18 sale attempts since 4y ago; this cycle's ask has dropped $35k (10%) from the opening price — seller is motivated, your offer sets the floor, not the list.
Risks & watch-outs
- Watch-outs: property tax is 2.9% of price.
- Climate carrying-cost: moderate flood risk; severe wind risk, 99% chance of damaging wind over 30y; extreme-heat days projected 7→22/yr by 2055 (HVAC capex compounding) — expect insurance premiums to compound above CPI over the hold.
Questions for the listing agent
- It's been on market 123 days. Have you received any prior offers? Is the seller open to a 12% concession, seller financing, or rate buy-down credit?
- Property tax is high relative to price — has the assessment been appealed recently, and will the sale trigger a re-assessment?
- What does the HOA fee cover, when was the last increase, and are there any pending special assessments or reserve-fund shortfalls?
- Why hasn't it sold? Are there any deal-killer items the seller is aware of (foundation, flood, title, zoning, code violations)?
- Is there a deadline driving the sale (1031 exchange, divorce, estate, relocation)? That informs how much negotiation room exists.
- Schools are B-rated — typically a magnet for longer-tenancy family renters. What's the average tenant stay here, and is there a school-zone premium baked into asking?
- The area grade is low — what's the realistic commute time and amenity access for the typical tenant pool here? Any planned neighborhood developments (good or bad) we should know about?
- What's the average days-on-market for RENTAL listings here right now (not sales)? A rising rental-DOM trend means longer vacancies and softer asking-rent achievability than the comps imply.
- What's the recent tenant-quality profile in this submarket — average credit score on applications, eviction rate, late-payment / NSF rate, and stable-employment percentage? A property-management company in the area should have these aggregated.
- How much new for-sale + rental construction is in the pipeline within 1–3 miles? Heavy new supply typically softens prices + rents 12–24 months out; constrained supply supports both.
Investment metrics
- 1% rule
- 1.06% ✓
- Cap rate
- 6.53%
- Cash-on-cash
- 0.84%
- DSCR
- 1.04
- GRM
- 7.9
CMA / ARV
- ARV (median comp)
- $344,581
- List price
- $300,000
- Delta
- -12.94%
- Verdict
- UNDERPRICED
- Comps
- 20 within 1.0 mi
Show comp detail 5 sales within ~0.75 mi
| Address | Dist | Beds/Ba | Sqft | Sold | Price | $/sf | Match |
|---|---|---|---|---|---|---|---|
| 405 Elaine Valley Dr | 0.05mi | 5/2.5 | 2,586 (0%) | 1mo | $280,000 | $108 | 97 |
| 5707 Blue Grama Dr | 0.04mi | 5/3.0 | 2,439 (-6%) | 21mo | $358,990 | $147 | 69 |
| 5734 Quest Valley Dr | 0.04mi | 5/3.0 | 2,439 (-6%) | 22mo | $359,990 | $148 | 68 |
| 217 Elm Patch Dr | 0.69mi | 5/2.5 | 2,663 (+3%) | 1mo | $300,000 | $113 | 62 |
| 1017 Misty Patch Dr | 0.70mi | 5/2.5 | 2,586 (0%) | 10mo | $270,000 | $104 | 59 |
Match score weights: distance 35% · size 25% · config 20% · recency 20%. Top-matched comps best support the ARV.
Projected returns pro-forma
-3.0% appreciation · 0.0% rent growth · sell at horizon
- IRR
- -18.9%
- Equity multiple
- 0.36×
- Total profit
- $-53,881
- Equity at exit
- $44,731
- IRR
- -21.0%
- Equity multiple
- 0.08×
- Total profit
- $-76,915
- Equity at exit
- $25,939
Cash invested: $84,000 (down + closing). Projections, not guarantees.
Landlord ↔ Tenant lean methodology
- Overall (STATE)
- 87 Strongly Landlord-Friendly
- State Texas
- 87 Strongly Landlord-Friendly · R+5
- County
- — inherits STATE
- City
- — inherits STATE
ZIP-level market 77493
- Rents YoY
- -0.8%
- Active inventory
- 2696
- Price-to-rent
- 7.9×
Monthly cashflow live
- Estimated rent
- $3,176 high interval (Pro) →
- Mortgage (P&I)
- −$1,573
- Tax from tax record
- −$719 /mo · $8,629/yr
- Insurance
- −$125
- HOA
- −$33
- Vacancy / Maint / Mgmt
- −$667
- Net cashflow
- $59
Break-even live
UW: 25.0% down · 7.5% · 30yr · 1.5% tax · 5.0% vac · 8.0% maint · 8.0% mgmt
Financing live
Cash to close
- Down payment
- $75,000
- Closing costs
- $9,000
- Reserves months
- —
- Total cash needed
- —
Loan-product check · same deal, 3 products live
Conventional
25% down · 7.5% · 30yr
- Down + closing
- —
- Monthly P&I
- —
- Monthly cashflow
- —
- DSCR
- —
- Eligible?
- —
Personal DTI + credit; lowest rate.
DSCR
20% down · 8.5% · 30yr
- Down + closing
- —
- Monthly P&I
- —
- Monthly cashflow
- —
- DSCR
- —
- Eligible?
- —
No personal income docs; deal must DSCR.
Hard money
10% down · 12.0% · 12mo
- Down + closing
- —
- Monthly P&I
- —
- Monthly cashflow
- —
- DSCR
- —
- Eligible?
- —
Short-term bridge; refi at stabilization.
Rent comps 16 comps
| Address | Beds | Baths | Sqft | Rent | $/sqft | DOM | Units | Dist |
|---|---|---|---|---|---|---|---|---|
| 3020 Wild Dunes Dr Katy, TX | 4.0 | 2.0 | 1776 | $2,355 | $1.33 | 12d | 1 | 0.98mi |
| 3112 Wild Dunes Dr Katy, TX | 4.0 | 2.0 | 1776 | $2,330 | $1.31 | 24d | 1 | 1.02mi |
| 3124 Wild Dunes Dr Katy, TX | 4.0 | 2.0 | 1776 | $2,330 | $1.31 | 24d | 1 | 1.04mi |
| 3041 Colusa Ridge Dr Katy, TX | 4.0 | 2.5 | 2263 | $2,500 | $1.10 | 12d | 1 | 1.05mi |
| 3136 Wild Dunes Dr Katy, TX | 4.0 | 2.0 | 1776 | $2,355 | $1.33 | 12d | 1 | 1.05mi |
| 3104 Nori Shores Dr Katy, TX | 5.0 | 2.5 | 1947 | $3,695 | $1.90 | 3d | 1 | 1.18mi |
| 3004 Fall Gold Ln Katy, TX | 5.0 | 3.0 | 2156 | $3,850 | $1.79 | 43d | 1 | 1.18mi |
| 3004 Fall Gold Ln Katy, TX | 5.0 | 3.0 | 2156 | $2,762 | $1.28 | 10d | 1 | 1.18mi |
| 3053 Fantasy Terrace Dr Katy, TX | 4.0 | 2.0 | 2085 | $2,440 | $1.17 | 15d | 1 | 1.24mi |
| 3076 Dylan Skyland Dr Katy, TX | 4.0 | 2.5 | 2240 | $3,395 | $1.52 | 24d | 1 | 1.28mi |
| 3072 Fantasy Terrace Dr Katy, TX | 4.0 | 2.0 | 2279 | $2,550 | $1.12 | 22d | 1 | 1.28mi |
| 3060 Nori Shores Dr Katy, TX | 6.0 | 2.5 | 2408 | $3,995 | $1.66 | 24d | 1 | 1.30mi |
| 3084 Fantasy Terrace Dr Katy, TX | 4.0 | 2.0 | 2085 | $2,325 | $1.12 | 12d | 1 | 1.31mi |
| 3025 Nori Shores Dr Katy, TX | 6.0 | 2.5 | 2480 | $3,798 | $1.53 | 4d | 1 | 1.32mi |
| 3020 Nori Shores Dr Katy, TX | 5.0 | 2.5 | 2408 | $3,995 | $1.66 | 24d | 1 | 1.34mi |
| 3013 Pearl Coastline Ln Katy, TX | 6.0 | 2.5 | 2480 | $3,995 | $1.61 | 24d | 1 | 1.36mi |
HOA detail
- Monthly dues
- $33 · $396/yr
- Likely covers
- water
Listing history 50 events
-
2026-06-18days on market $300,000 Active 123 DOM
-
2026-06-17days on market $300,000 Active 122 DOM
-
2026-06-16days on market $300,000 Active 121 DOM
-
2026-06-15days on market $300,000 Active 120 DOM
-
2026-06-13days on market $300,000 Active 118 DOM
-
2026-06-10days on market $300,000 Active 114 DOM
-
2026-06-08days on market $300,000 Active 113 DOM
-
2026-06-07days on market $300,000 Active 112 DOM
-
2026-06-04days on market $300,000 Active 109 DOM
-
2026-06-03days on market $300,000 Active 108 DOM
-
2026-06-02days on market $300,000 Active 107 DOM
-
2026-06-01days on market $300,000 Active 106 DOM
-
2026-05-31days on market $300,000 Active 105 DOM
-
2026-02-15$335,000 Active 830-char remark
Show marketing remark (830 chars)
Welcome to 425 Elaine Valley the largest floor plan in Freeman Ranch! This stunning 5 bed, 2 bath, 2,586 sq ft move in ready home blends space, style, and thoughtful upgrades throughout. Fresh neutral paint sets a warm, welcoming tone from the moment you arrive. New luxury flooring flows through the front entry, kitchen, and dining room, while a custom built accent wall makes the dining space truly one of a kind. A whole home water softener adds everyday comfort and lasting value. Ask about our preferred lender's special buy-down program to lower your interest rate and reduce your monthly payment more home for less! Freeman Ranch offers easy access to top rated Katy ISD schools, shopping, and major freeways. Don't miss this rare opportunity to own the biggest floor plan in the neighborhood. Schedule your showing today!
-
2025-12-17historical $2,600
-
2025-12-06historical
-
2025-11-29$2,600
-
2025-11-29historical $2,600
-
2025-11-10$2,600
-
2025-11-09historical $2,600
-
2025-10-27historical $2,600
-
2025-10-25$2,600
-
2025-10-25$2,800
-
2025-10-24historical $2,700
-
2025-10-24$342,000 Active
-
2025-10-24historical
-
2025-08-28price $2,700
-
2025-08-22price $349,000
-
2025-08-22price $350,000
-
2025-08-12$2,800
-
2025-08-10$355,000 Active
-
2025-08-04historical $2,600
-
2025-08-03historical
-
2025-07-21$2,600
-
2025-07-20$359,990 Active
-
2025-04-13historical $2,600
-
2025-04-03price $2,600
-
2025-03-25price $2,700
-
2025-03-10$2,750
-
2025-03-09historical $2,750
-
2025-02-01$2,750
-
2025-01-28historical $2,750
-
2025-01-21$2,750
-
2024-01-29historical $2,650
-
2024-01-17$2,650
-
2022-12-05soldstatus Sold
-
2022-11-18status Pending
-
2022-10-27$339,900 Active
-
2022-09-30historical
-
2022-09-16price $339,900
ⓘ Source: listings_history table (triggers on properties + properties_extension) + one-shot
backfill from property_details.listing_events for pre-trigger history.
Tax reassessment forecast TX · Resets to sale price
- Current annual tax
- $8,629 · $719/mo
- Projected year-2 tax
- $8,629 · $719/mo
- Expected delta
- $0/yr ($0/mo · 0.0%)
ⓘ Screening estimate from a state-policy table — verify with the county assessor before closing.
Climate risk First Street
- Flood 5/10 Major FEMA zone X (unshaded) · 67% chance over 30 yrs
- Wildfire 4/10 Moderate
- Heat 8/10 Severe 7 d/yr ≥110°F today · 22 d/yr by 30 yrs out
- Wind 9/10 Extreme 99% chance of damaging wind over 30 yrs
- Air quality 2/10 Low 1 unhealthy d/yr today · 1 by 30 yrs out
Nearby sold comps map
Loading sold comps map…
Walkable amenities ~0.75 mi
Loading nearby amenities…
Taxation est. · year 1
- Rental income
- $38,117
- − Mortgage interest
- −$16,805
- − Property taxes
- −$8,629
- − Insurance
- −$1,500
- − Repairs & maintenance
- −$3,049
- − Management
- −$3,049
- − HOA
- −$396
- − Depreciation
- −$8,727
- Taxable loss
- −$4,039
- Est. tax savings @ 24.0%
- +$969
- After-tax cash flow
- $1,678/yr
For passive investors: Depreciation is non-cash, so a rental often shows a tax loss while cash-flowing — sheltering income. Rental losses are passive: they offset passive income freely, and up to $25,000/yr can offset ordinary (W-2) income if you actively participate and your MAGI is under $100k (phasing out to $0 by $150k); unused losses carry forward. On sale, claimed depreciation is recaptured at up to 25%, and gains may owe capital-gains tax (a 1031 exchange can defer both). Figures are a year-1 estimate at your 24.0% rate — not tax advice; consult a CPA.
Condition & rehab AI · 12 photos
This move-in ready home in Freeman Ranch is in good condition with modern updates and a well-maintained exterior. It offers a great opportunity for a potential buyer or investor looking for a turnkey property.
Value-add opportunities
- Both landscaping — enhances curb appeal and adds value
- Both painting — fresh paint can make a home more appealing
- Both landscaping — improves curb appeal and adds value
Renovation cost estimate screening
Value-add ROI direction
- Both landscaping — enhances curb appeal and adds value ↑
- Both painting — fresh paint can make a home more appealing ↑
- Both landscaping — improves curb appeal and adds value ↑
ⓘ Cost ranges are severity-bucket heuristics (US national rule-of-thumb). Get contractor quotes + a written scope before underwriting a rehab budget.
Schools (NCES district)
- District
- Royal ISD
- NCES district ID
- 4838190
- Math proficiency
- 23% ▼ -11.00%
- Reading proficiency
- 23% ▼ -6.00%
- Median HH income
- $41,059
- Composite
- 19.55/100
- National rank
- #8760
- State rank
- #744 of 826 in TX
Livability — Katy
- Score
- 76/100
- State rank
- #111
- US rank
- #3613
Category grades
Schools grade is shown separately in the Schools card above.
Census & demographics
- County
- Harris County · 4,702,590 people
- City population
- 413,575
- Metro
- Houston-The Woodlands-Sugar Land, TX
- Population (ZIP)
- 71,484
- Household income
- $118,464
- Rent vs Own
- Severe rent burden
- 913.0
Population outlook (Waller County) Hauer SSP2
- Today (2025)
- 60,772 people
- By 2030
- 67,616 · +11.3%
- By 2040
- 82,283 · +35.4%
- By 2050
- 98,276 · +61.7%
- By 2075
- 142,860 · +135.1%
- By 2100
- 175,596 · +188.9%
Race, ethnicity, and origin ACS 2023
- Neighborhood character
- Highly diverse neighborhood (Simpson 0.73)
- Race & ethnicity
- White 36% Hispanic / Latino 33% Two or more races 16% Black 15% Asian 12%
- Hispanic origin (detail)
- Mexican 20%
- Common ancestry
- Lithuanian 2% Slovak 1% Italian 1%
- Foreign-born
- 21% · Canada, Vietnam, Jamaica
- Languages at home
- 64% English-only · Spanish 22% Vietnamese 5% French/Haitian/Cajun 4%
Political lean MEDSL · Waller
- 2024 margin
- Strong R (+25.0) · D 37.0% · R 62.0% · Other 1.0%
- 2008→2024 swing
- -17.9pp toward R · 2008: -7.2pp · 2024: -25.0pp
- All cycles
- 2024: R+25.0 2020: R+26.7 2016: R+28.6 2012: R+17.6 2008: R+7.2
Not yet ingested
- Civics
- —
Market trends
- HPI YoY
- ▼ -140.65%
- Current HPI
- 233.1683
- Rent YoY
- ▼ -0.80%
- Metro
- Houston-The Woodlands-Sugar Land, TX
- State GDP YoY
- ▲ 3.95%
- F500 in state
- 110
Industry mix (Fortune 500 HQ in TX)
| Industry | F500 HQs | Revenue |
|---|---|---|
| Energy | 16 | $1,198B |
|
||
| Technology | 5 | $198B |
|
||
| Engineering / Construction | 4 | $72B |
|
||
| Energy Services | 3 | $60B |
|
||
| Utilities | 3 | $41B |
|
||
| Healthcare | 2 | $330B |
|
||
Price history
-8.2% since first listed46 events — show timeline
- 2026-02-15 Listed $335,000 HARMLS
- 2025-12-17 Rental Removed $2,600 RENTSPREE
- 2025-12-06 Listing Removed — HARMLS
- 2025-11-29 Listed for Rent $2,600 RENTSPREE
- 2025-11-29 Rental Removed $2,600 TURBOTENANT
- 2025-11-10 Listed for Rent $2,600 TURBOTENANT
- 2025-11-09 Rental Removed $2,600 HARMLS
- 2025-10-27 Rental Removed $2,600 RENTSPREE
- 2025-10-25 Listed for Rent $2,600 HARMLS
- 2025-10-25 Listed for Rent $2,800 RENTSPREE
- 2025-10-24 Rental Removed $2,700 HARMLS
- 2025-10-24 Listing Removed — HARMLS
- 2025-10-24 Listed $342,000 HARMLS
- 2025-08-28 Price Changed $2,700 HARMLS
- 2025-08-22 Price Changed $349,000 HARMLS
- 2025-08-22 Price Changed $350,000 HARMLS
- 2025-08-12 Listed for Rent $2,800 HARMLS
- 2025-08-10 Listed $355,000 HARMLS
- 2025-08-04 Rental Removed $2,600 HARMLS
- 2025-08-03 Listing Removed — HARMLS
- 2025-07-21 Listed for Rent $2,600 HARMLS
- 2025-07-20 Listed $359,990 HARMLS
- 2025-04-13 Rental Removed $2,600 HARMLS
- 2025-04-03 Price Changed $2,600 HARMLS
- 2025-03-25 Price Changed $2,700 HARMLS
- 2025-03-10 Listed for Rent $2,750 HARMLS
- 2025-03-09 Rental Removed $2,750 HARMLS
- 2025-02-01 Listed for Rent $2,750 HARMLS
- 2025-01-28 Rental Removed $2,750 HARMLS
- 2025-01-21 Listed for Rent $2,750 HARMLS
- 2024-01-29 Rental Removed $2,650 HARMLS
- 2024-01-17 Listed for Rent $2,650 HARMLS
- 2022-12-05 Sold (MLS) — HARMLS
- 2022-11-18 Pending — HARMLS
- 2022-10-27 Listed $339,900 HARMLS
- 2022-09-30 Listing Removed — HARMLS
- 2022-09-16 Price Changed $339,900 HARMLS
- 2022-08-06 Price Changed $352,900 HARMLS
- 2022-08-03 Price Changed $374,900 HARMLS
- 2022-07-08 Listed $379,900 HARMLS
- 2022-06-30 Listing Removed — HARMLS
- 2022-06-01 Price Changed $379,900 HARMLS
- 2022-05-11 Price Changed $374,900 HARMLS
- 2022-05-11 Relisted — HARMLS
- 2022-03-15 Listing Removed — HARMLS
- 2022-02-24 Listed $364,900 HARMLS
Property tax history
+153.7%/yrLatest (2025): $8,629 · +1.5% YoY. Source: county tax records.
Cash-flow waterfall
monthlySold comps — $/sqft
last 12 mo · ≤1 miLoading sold comps…