742 Nancy Ln · Lancaster, PA
Flood risk No data
- FEMA flood zone
- —
- Chance of flooding over 30 yrs
- —
- Est. flood insurance / yr
- —
Fire risk No data
- Est. fire insurance / yr
- —
Heat risk No data
- Hot days now (above threshold)
- —
- Hot days in 30 yrs
- —
Wind risk No data
- Chance of severe wind over 30 yrs
- —
Air-quality risk No data
- Unhealthy air days now
- —
- Unhealthy air days in 30 yrs
- —
Risk factors via First Street. Map © Google.
Why this score? — see what drove the B grade
The composite is a weighted blend of 9 inputs, each scored 0–100. Each bar is that input's sub-score; the figure is the points it added to the 100-point composite (weight × sub-score).
- Cash flow +30.0/30.0
- 1% rule +10.0/10.0
- DSCR +10.0/10.0
- ARV discount +7.5/15.0
- Schools +4.4/10.0
- Livability +4.2/5.0
- Rent growth +3.5/5.0
- Condition / age +2.5/5.0
- Appreciation +0.0/10.0
$110,000
🖨 Deal sheet 📄 Offer letter ✓ Due diligence
Listing remarks
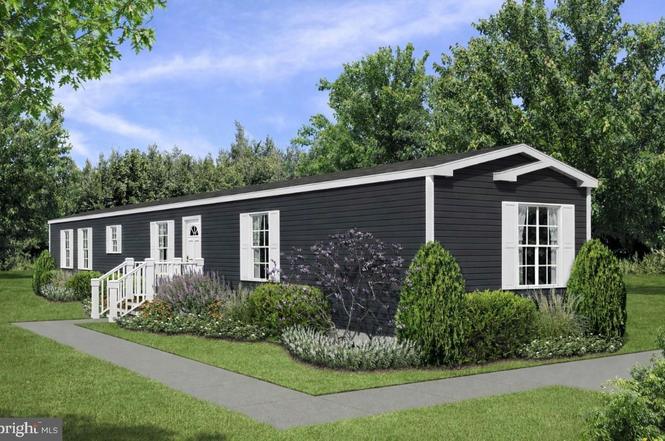
Exciting opportunity to own a brand-new single-wide manufactured home! Partner with Superior Homes to create a home that fits your lifestyle and budget. Choose from thoughtfully designed 2-bedroom or 3-bedroom configurations, offering open-concept living spaces, modern kitchens, and comfortable primary suites. Buyers will enjoy the ability to select custom exterior and interior color packages, along with available floor plan modifications to personalize the layout to their needs. Home installation is scheduled for Spring 2026, giving you time to plan, customize, and prepare for your brand-new home. Whether you're looking to downsize, purchase your first home, or invest in affordable new con
Key facts
- Community pool
- Built 2026
- Listed 33 days
Neighborhood map
What this means for you Summary
Snapshot
- This is a 2-bed/2.0-bath manufactured listed at $110k.
Deal economics
- At list price, monthly cash flow is $783 ($9k/yr) — positive.
- The deal already cash-flows at list — no discount required.
- Meets the 1% rule at list price ($2k rent vs $110k).
- Recommended offer: $107k (3.0% below list) — sets the bar for market timing.
- Cap rate 14.8% vs local median 4.2% in Lancaster — top-decile yield for the area; either an underpriced asset or a hidden risk that comps aren't pricing in. Stress-test before assuming the spread holds.
Location & tenants
- Location reads 85/100 on livability (#71 in PA, #498 nationally) — a professional / high-income tenant draw. Strengths: amenities A+, commute A+, cost of living A+; Watch: crime C-, employment C-.
- Conestoga Valley SD (suburban): math 43% / reading 59% proficiency, ranked #156 of 539 in PA (top 29%) — acceptable for families but not a draw, mixed tenant base, ~2y average lease.
- Market conditions: Rents rising (+4.0%/yr); 321 active listings in the ZIP; 3 comparable units currently listed for rent nearby; rentals lingering (median 44d on market — plan ~5-8 weeks vacancy on turnover, expect pricing pressure); 67% of comp listings sitting > 30 days — soft ceiling on asking rent; solid renter incomes; 1,093 units permitted in Lancaster County in 2024 (201 in 5+ unit buildings).
Forward outlook
- Local home prices are declining (-3.0%/yr); year-one equity from $761 of loan paydown is wiped out by about $3k of value loss. Plan a longer hold.
- Lancaster County population projected at +5% by 2050 — modest demand growth; plan on rents tracking national, not racing it.
- At projected returns (-3.0% appreciation + 4.0% rent growth), your $31k cash investment doubles in ~4 years — after that, you're playing with house money.
Negotiation context
- It's been on market 33 days — a 3% lower offer ($107k) is reasonable based on typical stale-listing flexibility.
Questions for the listing agent
- It's been on market 33 days. Have you received any prior offers? Is the seller open to a 3% concession, seller financing, or rate buy-down credit?
- Is there a deadline driving the sale (1031 exchange, divorce, estate, relocation)? That informs how much negotiation room exists.
- What's the average days-on-market for RENTAL listings here right now (not sales)? A rising rental-DOM trend means longer vacancies and softer asking-rent achievability than the comps imply.
- What's the recent tenant-quality profile in this submarket — average credit score on applications, eviction rate, late-payment / NSF rate, and stable-employment percentage? A property-management company in the area should have these aggregated.
- How much new for-sale + rental construction is in the pipeline within 1–3 miles? Heavy new supply typically softens prices + rents 12–24 months out; constrained supply supports both.
Investment metrics
- 1% rule
- 1.64% ✓
- Cap rate
- 14.83%
- Cash-on-cash
- 30.49%
- DSCR
- 2.36
- GRM
- 5.1
CMA / ARV
No comps found within radius.
Projected returns pro-forma
-3.0% appreciation · 3.99% rent growth · sell at horizon
- IRR
- 26.2%
- Equity multiple
- 2.10×
- Total profit
- $33,790
- Equity at exit
- $16,401
- IRR
- 34.4%
- Equity multiple
- 4.28×
- Total profit
- $101,040
- Equity at exit
- $9,511
Cash invested: $30,800 (down + closing). Projections, not guarantees.
Landlord ↔ Tenant lean methodology
- Overall (STATE)
- 62 Landlord-Friendly
- State Pennsylvania
- 62 Landlord-Friendly · EVEN
- County
- — inherits STATE
- City
- — inherits STATE
ZIP-level market 17601
- Rents YoY
- 4.0%
- Active inventory
- 321
- Price-to-rent
- 5.1×
Monthly cashflow live
- Estimated rent
- $1,808 medium interval (Pro) →
- Mortgage (P&I)
- −$577
- Tax from tax record
- −$23 /mo · $275/yr
- Insurance
- −$46
- HOA
- −$0
- Vacancy / Maint / Mgmt
- −$380
- Net cashflow
- $783
Break-even live
UW: 25.0% down · 7.5% · 30yr · 1.5% tax · 5.0% vac · 8.0% maint · 8.0% mgmt
Financing live
Cash to close
- Down payment
- $27,500
- Closing costs
- $3,300
- Reserves months
- —
- Total cash needed
- —
Loan-product check · same deal, 3 products live
Conventional
25% down · 7.5% · 30yr
- Down + closing
- —
- Monthly P&I
- —
- Monthly cashflow
- —
- DSCR
- —
- Eligible?
- —
Personal DTI + credit; lowest rate.
DSCR
20% down · 8.5% · 30yr
- Down + closing
- —
- Monthly P&I
- —
- Monthly cashflow
- —
- DSCR
- —
- Eligible?
- —
No personal income docs; deal must DSCR.
Hard money
10% down · 12.0% · 12mo
- Down + closing
- —
- Monthly P&I
- —
- Monthly cashflow
- —
- DSCR
- —
- Eligible?
- —
Short-term bridge; refi at stabilization.
Rent comps 3 comps
| Address | Beds | Baths | Sqft | Rent | $/sqft | DOM | Units | Dist |
|---|---|---|---|---|---|---|---|---|
| 131 Highview Dr Lancaster, PA | 2.0 | 1.5 | 1120 | $1,795 | $1.60 | 43d | 1 | 1.31mi |
| 2165 Old Philadelphia Pike Lancaster, PA | 2.0 | 1.5 | 1120 | $1,795 | $1.60 | 43d | 1 | 1.37mi |
| 2165 Old Philadelphia Pike Unit 30 Lancaster, PA | 2.0 | 1.5 | 1120 | $1,795 | $1.60 | 13d | 1 | 1.39mi |
Listing history 3 events
-
2026-03-24status Pending
-
2026-03-24price $110,000
-
2026-02-19$104,900 Active
ⓘ Source: listings_history table (triggers on properties + properties_extension) + one-shot
backfill from property_details.listing_events for pre-trigger history.
Tax reassessment forecast PA · Partial reset (capped growth)
- Current annual tax
- $275 · $23/mo
- Projected year-2 tax
- $1,007 · $84/mo
- Expected delta
- +$731/yr (+$61/mo · 266.0%)
ⓘ Screening estimate from a state-policy table — verify with the county assessor before closing.
Nearby sold comps map
Loading sold comps map…
Walkable amenities ~0.75 mi
Loading nearby amenities…
Taxation est. · year 1
- Rental income
- $21,693
- − Mortgage interest
- −$6,162
- − Property taxes
- −$275
- − Insurance
- −$550
- − Repairs & maintenance
- −$1,735
- − Management
- −$1,735
- − Depreciation
- −$3,200
- Taxable income
- $8,036
- Est. tax owed @ 24.0%
- −$1,929
- After-tax cash flow
- $7,462/yr
For passive investors: Depreciation is non-cash, so a rental often shows a tax loss while cash-flowing — sheltering income. Rental losses are passive: they offset passive income freely, and up to $25,000/yr can offset ordinary (W-2) income if you actively participate and your MAGI is under $100k (phasing out to $0 by $150k); unused losses carry forward. On sale, claimed depreciation is recaptured at up to 25%, and gains may owe capital-gains tax (a 1031 exchange can defer both). Figures are a year-1 estimate at your 24.0% rate — not tax advice; consult a CPA.
Schools (NCES district)
- District
- Conestoga Valley SD
- NCES district ID
- 4206480
- Math proficiency
- 43% ▼ -8.00%
- Reading proficiency
- 59% ▼ -11.00%
- Median HH income
- $56,234
- Composite
- 44.15/100
- National rank
- #2861
- State rank
- #156 of 539 in PA
Livability — Lancaster
- Score
- 85/100
- State rank
- #71
- US rank
- #498
Category grades
Schools grade is shown separately in the Schools card above.
Census & demographics
- County
- Lancaster County · 390,309 people
- City population
- 176,170
- Metro
- Lancaster, PA
- Population (ZIP)
- 56,382
- Household income
- $102,435
- Rent vs Own
- Severe rent burden
- 1296.0
Population outlook (Lancaster County) Hauer SSP2
- Today (2025)
- 561,011 people
- By 2030
- 570,969 · +1.8%
- By 2040
- 585,929 · +4.4%
- By 2050
- 591,056 · +5.4%
- By 2075
- 594,747 · +6.0%
- By 2100
- 558,850 · -0.4%
Race, ethnicity, and origin ACS 2023
- Neighborhood character
- Predominantly White (78%)
- Race & ethnicity
- White 78% Hispanic / Latino 10% Two or more races 7% Asian 6% Black 4%
- Hispanic origin (detail)
- Puerto Rican 5%
- Common ancestry
- Romanian 5% Slovak 2% Lithuanian 2%
- Foreign-born
- 9% · Canada, Vietnam, China
- Languages at home
- 86% English-only · Spanish 5% Other Indo-European 2% French/Haitian/Cajun 1%
Political lean MEDSL · Lancaster
- 2024 margin
- R (+15.9) · D 41.5% · R 57.5%
- 2008→2024 swing
- -4.1pp toward R · 2008: -11.8pp · 2024: -15.9pp
- All cycles
- 2024: R+15.9 2020: R+15.8 2016: R+19.7 2012: R+19.2 2008: R+11.8
Not yet ingested
- Civics
- —
Market trends
- HPI YoY
- ▼ -383.04%
- Current HPI
- 257.0336
- Rent YoY
- ▲ 3.99%
- Metro
- Lancaster, PA
- State GDP YoY
- ▲ 1.68%
- F500 in state
- 34
Industry mix (Fortune 500 HQ in PA)
| Industry | F500 HQs | Revenue |
|---|---|---|
| Healthcare | 2 | $309B |
|
||
| Insurance | 2 | $27B |
|
||
| Telecommunications / Media | 1 | $124B |
|
||
| Industrial Distribution | 1 | $22B |
|
||
| Financial Services | 1 | $20B |
|
||
| Chemicals / Materials | 1 | $18B |
|
||
Price history
+4.9% since first listed3 events — show timeline
- 2026-03-24 Pending — BRIGHT MLS
- 2026-03-24 Price Changed $110,000 BRIGHT MLS
- 2026-02-19 Listed $104,900 BRIGHT MLS
Property tax history
-3.4%/yrLatest (2026): $275 · +4.5% YoY. Source: county tax records.
Cash-flow waterfall
monthlySold comps — $/sqft
last 12 mo · ≤1 miLoading sold comps…