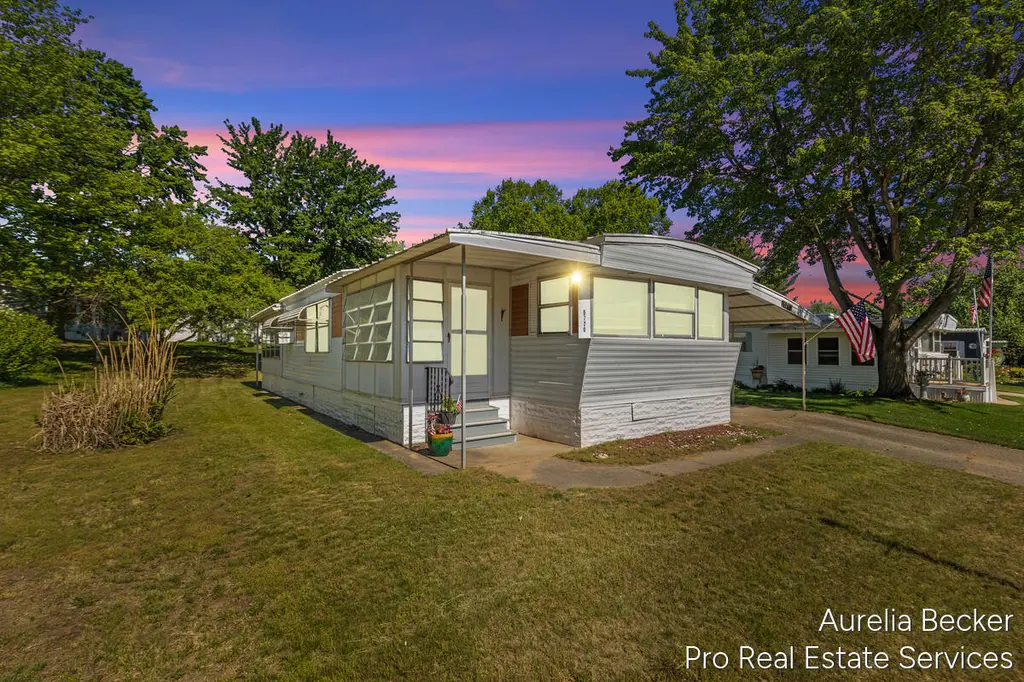
5720 Manistee Dr NE · Plainfield, MI
Flood risk No data
- FEMA flood zone
- —
- Chance of flooding over 30 yrs
- —
- Est. flood insurance / yr
- —
Fire risk No data
- Est. fire insurance / yr
- —
Heat risk No data
- Hot days now (above threshold)
- —
- Hot days in 30 yrs
- —
Wind risk No data
- Chance of severe wind over 30 yrs
- —
Air-quality risk No data
- Unhealthy air days now
- —
- Unhealthy air days in 30 yrs
- —
Risk factors via First Street. Map © Google.
Why this score? — see what drove the D+ grade
The composite is a weighted blend of 9 inputs, each scored 0–100. Each bar is that input's sub-score; the figure is the points it added to the 100-point composite (weight × sub-score).
- Cash flow +15.0/30.0
- ARV discount +7.5/15.0
- Schools +5.5/10.0
- 1% rule +5.0/10.0
- DSCR +5.0/10.0
- Rent growth +2.5/5.0
- Livability +2.5/5.0
- Condition / age +2.5/5.0
- Appreciation +0.0/10.0
$39,999
🖨 Deal sheet 📄 Offer letter ✓ Due diligence
Listing remarks MLS
Welcome home to Leisure Village in Belmont! A lovely community offering affordable housing and peaceful living. This 2 bedroom, 2 bathroom home offers large open living room with fireplace. Extra space in living room could double as office area, great space for desk or additional seating. Open kitchen with spacious wrap around snack bar with room for 8 bar stools! Plenty of of cabinets and counter space. Dining area with built in china cabinet and storage. Main bedroom with built in dresser and corner desk. Remodeled bathroom with large tiled shower and double sink vanity. Handy laundry room. Second bedroom with built in corner desk and its own private bath. There is a front enclosed porch, perfect for your sitting bench as well as an enclosed rear porch ideal for additional seating or storage. Large attached covered parking and shed! Enjoy the community garden! See attachments for upcoming community events. A lovely place to live. Community is 55+ Call Aurelia for exceptions. HURRY!Affordable living at its finest! Friendly neighbors and overall a very well kept park. Leisure Village offers breakfast group, shuffleboard on Monday evenings, ice cream socials, bingo, pizza parties, annual carport sales and so much more! All information is subject to buyer verification
Key facts
- Large tiled shower
- Remodeled bathroom
- Fireplace
Tags
Property features AI
Finance
- Other: Monthly association fee
- HOA & community: Homeowners association with monthly dues; Clubhouse; Meeting room; Playground; Pets allowed; Association fee includes trash
Exterior
- Parking: Carport (no attached garage)
- Utilities: Public water; Public sewer; Natural gas
- Home design: Ranch-style home; Single-story
- Construction: Built in 1980; Aluminum siding
- Exterior features: Paved road access; Shed(s) on property
Interior
- Kitchen: Range; Microwave; Refrigerator
- Bedrooms: Primary bedroom; Second bedroom
- Bathrooms: 2 full bathrooms
- Heating & cooling: Forced air heating; Window air conditioning units
- Interior features: Fireplace; Window treatments; 7 total rooms; Front enclosed porch; Rear enclosed porch; Crawl space basement
- Laundry & utility: Washer; Dryer; Natural gas water heater
Neighborhood map
What this means for you Summary
Snapshot
- This is a 2-bed/2.0-bath other listed at $40k.
Deal economics
- At list price, monthly cash flow is $577 ($7k/yr) — positive.
- The deal already cash-flows at list — no discount required.
- Meets the 1% rule at list price ($2k rent vs $40k).
Location & tenants
- Location reads: area grade D — affects rentability + tenant quality, not the cash-flow math above.
- Rockford Public Schools (suburban): math 59% / reading 64% proficiency, ranked #28 of 540 in MI (top 5%) — acceptable for families but not a draw, mixed tenant base, ~2y average lease; only 12% free/reduced lunch — higher-income household profile.
- Market conditions: 65 active listings in the ZIP; 1 comparable units currently listed for rent nearby; 2,253 units permitted in Kent County in 2024 (969 in 5+ unit buildings).
Forward outlook
- Local home prices are declining (-3.0%/yr); year-one equity from $276 of loan paydown is wiped out by about $1k of value loss. Plan a longer hold.
- Kent County population projected at +22% by 2050 — long-run rental-demand tailwind backs the buy-and-hold thesis.
- At projected returns (-3.0% appreciation + 3.0% rent growth), your $11k cash investment doubles in ~2 years — after that, you're playing with house money.
Negotiation context
- Only 14 days on market — expect competitive offers; lowballing is unlikely to land.
- 3 sale attempts with the ask held roughly flat each time — persistent listings suggest the price (not the market) is what's stuck; bring a comps-based counter.
Risks & watch-outs
- Watch-outs: HOA is 37% of rent.
Questions for the listing agent
- What does the HOA fee cover, when was the last increase, and are there any pending special assessments or reserve-fund shortfalls?
- Is there a deadline driving the sale (1031 exchange, divorce, estate, relocation)? That informs how much negotiation room exists.
- The area grade is low — what's the realistic commute time and amenity access for the typical tenant pool here? Any planned neighborhood developments (good or bad) we should know about?
- What's the average days-on-market for RENTAL listings here right now (not sales)? A rising rental-DOM trend means longer vacancies and softer asking-rent achievability than the comps imply.
- What's the recent tenant-quality profile in this submarket — average credit score on applications, eviction rate, late-payment / NSF rate, and stable-employment percentage? A property-management company in the area should have these aggregated.
- How much new for-sale + rental construction is in the pipeline within 1–3 miles? Heavy new supply typically softens prices + rents 12–24 months out; constrained supply supports both.
Investment metrics
- 1% rule
- 4.88% ✓
- Cap rate
- 23.59%
- Cash-on-cash
- 61.79%
- DSCR
- 3.75
- GRM
- 1.7
CMA / ARV
No comps found within radius.
Projected returns pro-forma
-3.0% appreciation · 3.0% rent growth · sell at horizon
- IRR
- 61.1%
- Equity multiple
- 3.74×
- Total profit
- $30,700
- Equity at exit
- $5,964
- IRR
- 65.9%
- Equity multiple
- 7.77×
- Total profit
- $75,864
- Equity at exit
- $3,458
Cash invested: $11,200 (down + closing). Projections, not guarantees.
Landlord ↔ Tenant lean methodology
- Overall (STATE)
- 62 Landlord-Friendly
- State Michigan
- 62 Landlord-Friendly · EVEN
- County
- — inherits STATE
- City
- — inherits STATE
ZIP-level market 49306
- Active inventory
- 65
- Price-to-rent
- 1.7×
Monthly cashflow live
- Estimated rent
- $1,950 medium interval (Pro) →
- Mortgage (P&I)
- −$210
- Tax from tax record
- −$11 /mo · $137/yr
- Insurance
- −$17
- HOA
- −$726
- Vacancy / Maint / Mgmt
- −$410
- Net cashflow
- $577
Break-even live
UW: 25.0% down · 7.5% · 30yr · 1.5% tax · 5.0% vac · 8.0% maint · 8.0% mgmt
Financing live
Cash to close
- Down payment
- $10,000
- Closing costs
- $1,200
- Reserves months
- —
- Total cash needed
- —
Loan-product check · same deal, 3 products live
Conventional
25% down · 7.5% · 30yr
- Down + closing
- —
- Monthly P&I
- —
- Monthly cashflow
- —
- DSCR
- —
- Eligible?
- —
Personal DTI + credit; lowest rate.
DSCR
20% down · 8.5% · 30yr
- Down + closing
- —
- Monthly P&I
- —
- Monthly cashflow
- —
- DSCR
- —
- Eligible?
- —
No personal income docs; deal must DSCR.
Hard money
10% down · 12.0% · 12mo
- Down + closing
- —
- Monthly P&I
- —
- Monthly cashflow
- —
- DSCR
- —
- Eligible?
- —
Short-term bridge; refi at stabilization.
Rent comps 1 comps
| Address | Beds | Baths | Sqft | Rent | $/sqft | DOM | Units | Dist |
|---|---|---|---|---|---|---|---|---|
| 6770 Pleasantview St NE Rockford, MI | 3.0 | 2.0 | 1800 | $1,950 | $1.08 | 21d | 1 | 1.37mi |
HOA detail
- Monthly dues
- $726 · $8,712/yr
Listing history 12 events
-
2026-06-18days on market $39,999 Active 14 DOM
-
2026-06-17days on market $39,999 Active 13 DOM
-
2026-06-16days on market $39,999 Active 12 DOM
-
2026-06-15days on market $39,999 Active 11 DOM
-
2026-06-14days on market $39,999 Active 9 DOM
-
2026-06-13days on market $39,999 Active 8 DOM
-
2026-06-10days on market $39,999 Active 6 DOM
-
2026-06-09days on market $39,999 Active 5 DOM
-
2026-06-08days on market $39,999 Active 4 DOM
-
2026-06-07days on market $39,999 Active 3 DOM
-
2026-06-05remarks 699-char remark
-
2026-06-05$39,999 Active 1 DOM
ⓘ Source: listings_history table (triggers on properties + properties_extension) + one-shot
backfill from property_details.listing_events for pre-trigger history.
Tax reassessment forecast MI · Partial reset (capped growth)
- Current annual tax
- $137 · $11/mo
- Projected year-2 tax
- $376 · $31/mo
- Expected delta
- +$240/yr (+$20/mo · 175.4%)
ⓘ Screening estimate from a state-policy table — verify with the county assessor before closing.
Nearby sold comps map
Loading sold comps map…
Walkable amenities ~0.75 mi
Loading nearby amenities…
Taxation est. · year 1
- Rental income
- $23,400
- − Mortgage interest
- −$2,241
- − Property taxes
- −$137
- − Insurance
- −$200
- − Repairs & maintenance
- −$1,872
- − Management
- −$1,872
- − HOA
- −$8,712
- − Depreciation
- −$1,164
- Taxable income
- $7,203
- Est. tax owed @ 24.0%
- −$1,729
- After-tax cash flow
- $5,191/yr
For passive investors: Depreciation is non-cash, so a rental often shows a tax loss while cash-flowing — sheltering income. Rental losses are passive: they offset passive income freely, and up to $25,000/yr can offset ordinary (W-2) income if you actively participate and your MAGI is under $100k (phasing out to $0 by $150k); unused losses carry forward. On sale, claimed depreciation is recaptured at up to 25%, and gains may owe capital-gains tax (a 1031 exchange can defer both). Figures are a year-1 estimate at your 24.0% rate — not tax advice; consult a CPA.
Schools (NCES district)
- District
- Rockford Public Schools
- NCES district ID
- 2630030
- Math proficiency
- 59% ▼ -5.00%
- Reading proficiency
- 64% ▼ -2.00%
- Median HH income
- $79,800
- Composite
- 55.16/100
- National rank
- #1276
- State rank
- #28 of 540 in MI
Livability — Plainfield
No livability data for this city. (Only ~50 U.S. cities are tracked.)
Census & demographics
- Population (ZIP)
- 10,806
Population outlook (Kent County) Hauer SSP2
- Today (2025)
- 712,484 people
- By 2030
- 748,618 · +5.1%
- By 2040
- 814,777 · +14.4%
- By 2050
- 868,556 · +21.9%
- By 2075
- 966,487 · +35.7%
- By 2100
- 967,975 · +35.9%
Race, ethnicity, and origin ACS 2023
- Neighborhood character
- Predominantly White (87%)
- Race & ethnicity
- White 87% Hispanic / Latino 8% Two or more races 6% Black 1%
- Hispanic origin (detail)
- Mexican 4% Cuban 2%
- Common ancestry
- Iranian 12% Romanian 12% Lithuanian 5%
- Foreign-born
- 3% · Canada, Jamaica
- Languages at home
- 96% English-only · Spanish 3%
Political lean MEDSL · Kent
- 2024 margin
- Lean D (+5.4) · D 51.8% · R 46.5% · Other 1.7%
- 2008→2024 swing
- +4.8pp toward D · 2008: 0.5pp · 2024: 5.4pp
- All cycles
- 2024: D+5.4 2020: D+6.1 2016: R+3.1 2012: R+7.9 2008: D+0.5
Not yet ingested
- Civics
- —
Market trends
- HPI YoY
- ▼ -146.39%
- Current HPI
- 246.3054
- Rent YoY
- —
- Metro
- —
- State GDP YoY
- ▲ 1.37%
- F500 in state
- 28
Industry mix (Fortune 500 HQ in MI)
| Industry | F500 HQs | Revenue |
|---|---|---|
| Automotive Parts | 3 | $48B |
|
||
| Automotive | 2 | $372B |
|
||
| Chemicals | 1 | $45B |
|
||
| Automotive Retail | 1 | $29B |
|
||
| Healthcare / Medical Devices | 1 | $23B |
|
||
| Automotive Technology | 1 | $20B |
|
||
Price history
+0.0% since first listed3 events — show timeline
- 2026-06-04 Listed $39,999 MiRealSource-MiMLS
- 2026-06-04 Listed $39,999 REALCOMP
- 2026-06-04 Listed $39,999 SW Michigan MLS
Property tax history
+3.1%/yrLatest (2025): $137 · +58.9% YoY. Source: county tax records.
Cash-flow waterfall
monthlySold comps — $/sqft
last 12 mo · ≤1 miLoading sold comps…