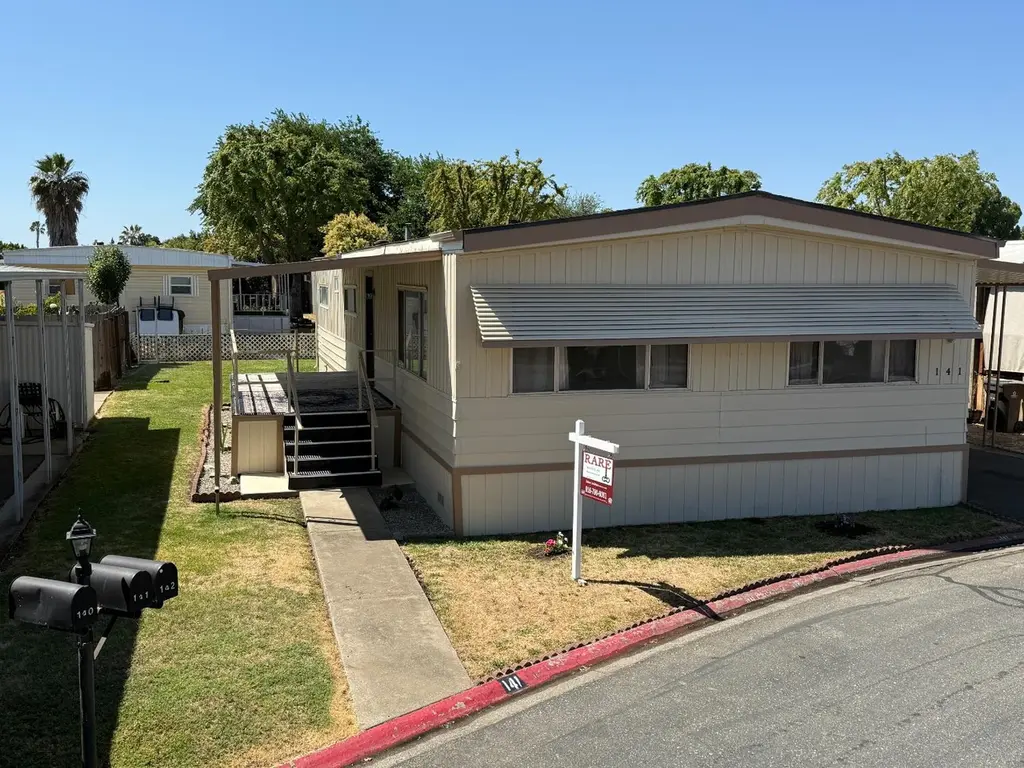
5100 N Highway 99 #141 · Morada, CA
Flood risk 1/10 · Minimal
- FEMA flood zone
- X
- Chance of flooding over 30 yrs
- 0.0%
- Est. flood insurance / yr
- $507 – $1,088
Fire risk 6/10 · Moderate
- Est. fire insurance / yr
- $659 – $1,223
Heat risk 7/10 · Major
- Hot days now (above 102°F)
- 7 days/yr
- Hot days in 30 yrs
- 15 days/yr
Wind risk 1/10 · Minimal
- Chance of severe wind over 30 yrs
- —
Air-quality risk 10/10 · Severe
- Unhealthy air days now
- 27 days/yr
- Unhealthy air days in 30 yrs
- 29 days/yr
Risk factors via First Street. Map © Google.
Why this score? — see what drove the B- grade
The composite is a weighted blend of 9 inputs, each scored 0–100. Each bar is that input's sub-score; the figure is the points it added to the 100-point composite (weight × sub-score).
- Cash flow +30.0/30.0
- 1% rule +10.0/10.0
- DSCR +10.0/10.0
- ARV discount +6.6/15.0
- Condition / age +3.8/5.0
- Livability +3.0/5.0
- Schools +2.7/10.0
- Rent growth +2.5/5.0
- Appreciation +0.0/10.0
$127,000
🖨 Deal sheet 📄 Offer letter ✓ Due diligence
Listing remarks
BACK ON THE MARKET! Welcome to your dream home! This beautifully updated property features fresh paint inside and out, new flooring throughout, and a brand-new roof, ensuring peace of mind for years to come. Enjoy the comfort of a newer heating and air system, and appreciate the stylish updated handrails that add a modern touch. With all these improvements, this home is truly move-in ready. Don't miss the opportunity to make it yours!
Key facts
- New composition roof
- Updated handrails
- Fresh exterior paint
Tags
Neighborhood map
What this means for you Summary
Snapshot
- This is a 3-bed/2.0-bath manufactured listed at $127k. Condition is rated good.
Deal economics
- At list price, monthly cash flow is $2k ($22k/yr) — positive.
- The deal already cash-flows at list — no discount required.
- Meets the 1% rule at list price ($3k rent vs $127k).
- Recommended offer: $112k (12.0% below list) — sets the bar for market timing.
- Cap rate 23.6% vs local median 2.7% in Morada — top-decile yield for the area; either an underpriced asset or a hidden risk that comps aren't pricing in. Stress-test before assuming the spread holds.
Location & tenants
- Location reads 60/100 on livability (#596 in CA) — a middle-class / working-renter tenant base. Strengths: crime A+, employment A+, housing A+; Watch: amenities F, commute F, cost of living F.
- Lodi Unified (urban): math 24% / reading 36% proficiency, ranked #325 of 517 in CA (top 63%) — families likely to look elsewhere, expect single-tenant / working-renter base with shorter leases.
- Market conditions: 160 active listings in the ZIP; 7 comparable units currently listed for rent nearby; rentals at typical pace (median 15d on market — plan ~3-4 weeks tenant-placement turnaround); high-income renter base; 3,779 units permitted in San Joaquin County in 2024 (0 in 5+ unit buildings).
- This rent runs 37% of the median local income ($112k/yr) — at the standard rent-burdened threshold; future hikes will face affordability resistance.
Forward outlook
- Local home prices are declining (-3.0%/yr); year-one equity from $878 of loan paydown is wiped out by about $4k of value loss. Plan a longer hold.
- San Joaquin County population projected at +17% by 2050 — long-run rental-demand tailwind backs the buy-and-hold thesis.
- At projected returns (-3.0% appreciation + 3.0% rent growth), your $36k cash investment doubles in ~2 years — after that, you're playing with house money.
Negotiation context
- It's been on market 292 days — a 12% lower offer ($112k) is reasonable based on typical stale-listing flexibility.
Risks & watch-outs
- Climate carrying-cost: major wildfire risk; extreme-heat days projected 7→15/yr by 2055 (HVAC capex compounding) — expect insurance premiums to compound above CPI over the hold.
Questions for the listing agent
- It's been on market 292 days. Have you received any prior offers? Is the seller open to a 12% concession, seller financing, or rate buy-down credit?
- Built in 1974 — when were the roof, HVAC, electrical panel, plumbing, and water heater last replaced?
- Why hasn't it sold? Are there any deal-killer items the seller is aware of (foundation, flood, title, zoning, code violations)?
- Is there a deadline driving the sale (1031 exchange, divorce, estate, relocation)? That informs how much negotiation room exists.
- What's the average days-on-market for RENTAL listings here right now (not sales)? A rising rental-DOM trend means longer vacancies and softer asking-rent achievability than the comps imply.
- What's the recent tenant-quality profile in this submarket — average credit score on applications, eviction rate, late-payment / NSF rate, and stable-employment percentage? A property-management company in the area should have these aggregated.
- How much new for-sale + rental construction is in the pipeline within 1–3 miles? Heavy new supply typically softens prices + rents 12–24 months out; constrained supply supports both.
Investment metrics
- 1% rule
- 2.71% ✓
- Cap rate
- 23.65%
- Cash-on-cash
- 61.98%
- DSCR
- 3.76
- GRM
- 3.1
CMA / ARV
- ARV (median comp)
- $124,629
- List price
- $127,000
- Delta
- 1.90%
- Verdict
- FAIR
- Comps
- 11 within 1.0 mi
Show comp detail 12 sales within ~0.75 mi
| Address | Dist | Beds/Ba | Sqft | Sold | Price | $/sf | Match |
|---|---|---|---|---|---|---|---|
| 5100 N Hwy 99 #159 | 0.00mi | 3/2.0 | 1,440 (0%) | 2mo | $100,000 | $69 | 99 |
| 4900 N Hwy 99 #65 | 0.00mi | 3/2.0 | 1,440 (0%) | 8mo | $94,000 | $65 | 93 |
| 5100 N Highway 99 #194 | 0.00mi | 3/2.0 | 1,344 (-7%) | 3mo | $129,900 | $97 | 86 |
| 5100 N Highway 99 #172 | 0.00mi | 3/2.0 | 1,440 (0%) | 18mo | $50,000 | $35 | 85 |
| 4900 N Highway 99 #106 | 0.01mi | 4/2.0 (+1) | 1,400 (-3%) | 7mo | $145,000 | $104 | 84 |
| 4900 N Highway 99 #185 | 0.00mi | 2/2.0 (-1) | 1,440 (0%) | 16mo | $55,000 | $38 | 82 |
| 5100 N Highway 99 #8 | 0.01mi | 3/2.0 | 1,560 (+8%) | 8mo | $130,000 | $83 | 80 |
| 5100 N Hwy 99 #182 | 0.00mi | 3/2.0 | 1,560 (+8%) | 10mo | $164,000 | $105 | 78 |
| 5100 N Highway 99 #103 | 0.00mi | 3/2.0 | 1,584 (+10%) | 17mo | $125,000 | $79 | 69 |
| 5100 N Highway 99 #202 | 0.00mi | 3/2.0 | 1,625 (+13%) | 12mo | $160,000 | $98 | 68 |
| 4900 N Highway 99 #197 | 0.00mi | 2/3.0 (-1) | 1,536 (+7%) | 14mo | $145,000 | $94 | 68 |
| 9454 N Highway 99 #20 | 0.06mi | 2/2.0 (-1) | 1,296 (-10%) | 13mo | $80,000 | $62 | 65 |
Match score weights: distance 35% · size 25% · config 20% · recency 20%. Top-matched comps best support the ARV.
Projected returns pro-forma
-3.0% appreciation · 3.0% rent growth · sell at horizon
- IRR
- 60.9%
- Equity multiple
- 3.71×
- Total profit
- $96,448
- Equity at exit
- $18,936
- IRR
- 65.5%
- Equity multiple
- 7.60×
- Total profit
- $234,820
- Equity at exit
- $10,981
Cash invested: $35,560 (down + closing). Projections, not guarantees.
Landlord ↔ Tenant lean methodology
- Overall (STATE)
- 18 Strongly Tenant-Friendly
- State California
- 18 Strongly Tenant-Friendly · D+13
- County
- — inherits STATE
- City
- — inherits STATE
ZIP-level market 95212
- Active inventory
- 160
- Price-to-rent
- 3.1×
Monthly cashflow live
- Estimated rent
- $3,436 high interval (Pro) →
- Mortgage (P&I)
- −$666
- Tax est. 1.5%
- −$159 /mo · $1,905/yr
- Insurance
- −$53
- HOA
- −$0
- Vacancy / Maint / Mgmt
- −$722
- Net cashflow
- $1,837
Break-even live
UW: 25.0% down · 7.5% · 30yr · 1.5% tax · 5.0% vac · 8.0% maint · 8.0% mgmt
Financing live
Cash to close
- Down payment
- $31,750
- Closing costs
- $3,810
- Reserves months
- —
- Total cash needed
- —
Loan-product check · same deal, 3 products live
Conventional
25% down · 7.5% · 30yr
- Down + closing
- —
- Monthly P&I
- —
- Monthly cashflow
- —
- DSCR
- —
- Eligible?
- —
Personal DTI + credit; lowest rate.
DSCR
20% down · 8.5% · 30yr
- Down + closing
- —
- Monthly P&I
- —
- Monthly cashflow
- —
- DSCR
- —
- Eligible?
- —
No personal income docs; deal must DSCR.
Hard money
10% down · 12.0% · 12mo
- Down + closing
- —
- Monthly P&I
- —
- Monthly cashflow
- —
- DSCR
- —
- Eligible?
- —
Short-term bridge; refi at stabilization.
Rent comps 7 comps
| Address | Beds | Baths | Sqft | Rent | $/sqft | DOM | Units | Dist |
|---|---|---|---|---|---|---|---|---|
| 3461 Sina Ct Stockton, CA | 3.0 | 2.0 | 1335 | $3,000 | $2.25 | 43d | 1 | 0.80mi |
| 4006 Angelina Ln Stockton, CA | 3.0 | 2.5 | 1775 | $2,750 | $1.55 | 2d | 1 | 0.86mi |
| 10424 Skynyrd Way Stockton, CA | 3.0 | 2.0 | 1509 | $4,500 | $2.98 | 23d | 1 | 0.93mi |
| 10400 Skynyrd Way Stockton, CA | 3.0 | 2.0 | 1342 | $4,500 | $3.35 | 14d | 1 | 0.94mi |
| 4142 E Morada Ln Stockton, CA | 2.0 | 2.0 | 1063 | $2,314 | $2.18 | 21d | 1 | 1.34mi |
| 4030 E Morada Ln Stockton, CA | 2.0 | 1.0–2.0 | 811 | $2,340 | $2.88 | 2d | 26 | 1.39mi |
| 9326 Lembert Dome Cir Stockton, CA | 3.0 | 2.0 | 1490 | $2,645 | $1.78 | 2d | 1 | 1.43mi |
Listing history 11 events
-
2026-06-15statusdays on market $127,000 Pending 292 DOM
-
2026-06-14days on market $127,000 Active 291 DOM
-
2026-06-10days on market $127,000 Active 288 DOM
-
2026-06-09days on market $127,000 Active 287 DOM
-
2026-06-08days on market $127,000 Active 286 DOM
-
2026-06-07days on market $127,000 Active 285 DOM
-
2026-06-05days on market $127,000 Active 282 DOM
-
2026-06-03days on market $127,000 Active 281 DOM
-
2026-06-03days on market $127,000 Active 280 DOM
-
2026-06-01days on market $127,000 Active 279 DOM
-
2026-05-31days on market $127,000 Active 278 DOM
ⓘ Source: listings_history table (triggers on properties + properties_extension) + one-shot
backfill from property_details.listing_events for pre-trigger history.
Climate risk First Street
- Flood 1/10 Low FEMA zone X · 0% chance over 30 yrs
- Wildfire 6/10 Major
- Heat 7/10 Severe 7 d/yr ≥102°F today · 15 d/yr by 30 yrs out
- Wind 1/10 Low
- Air quality 10/10 Extreme 27 unhealthy d/yr today · 29 by 30 yrs out
Nearby sold comps map
Loading sold comps map…
Walkable amenities ~0.75 mi
Loading nearby amenities…
Taxation est. · year 1
- Rental income
- $41,230
- − Mortgage interest
- −$7,114
- − Property taxes
- −$1,905
- − Insurance
- −$635
- − Repairs & maintenance
- −$3,298
- − Management
- −$3,298
- − Depreciation
- −$3,695
- Taxable income
- $21,284
- Est. tax owed @ 24.0%
- −$5,108
- After-tax cash flow
- $16,931/yr
For passive investors: Depreciation is non-cash, so a rental often shows a tax loss while cash-flowing — sheltering income. Rental losses are passive: they offset passive income freely, and up to $25,000/yr can offset ordinary (W-2) income if you actively participate and your MAGI is under $100k (phasing out to $0 by $150k); unused losses carry forward. On sale, claimed depreciation is recaptured at up to 25%, and gains may owe capital-gains tax (a 1031 exchange can defer both). Figures are a year-1 estimate at your 24.0% rate — not tax advice; consult a CPA.
Condition & rehab AI · 12 photos
This move-in ready manufactured home features fresh paint, new flooring, and a new roof, making it a great investment opportunity.
Repairs flagged
- Minor kitchen cabinets — dated and could be replaced
- Minor bathroom fixtures — dated and could be replaced
Value-add opportunities
- Resale update kitchen cabinets — modernizes kitchen and adds value
- Resale update bathroom fixtures — modernizes bathrooms and adds value
- Both paint exterior — enhances curb appeal and adds value
- Both replace handrails — modernizes home and adds value
Renovation cost estimate screening
| Repair item | Severity | Est. cost |
|---|---|---|
| kitchen cabinets · dated and could be replaced | Minor | $500–3,000 |
| bathroom fixtures · dated and could be replaced | Minor | $500–3,000 |
| Total estimated repair cost · 2 items | $1,000–6,000 |
Value-add ROI direction
- Resale update kitchen cabinets — modernizes kitchen and adds value ↑
- Resale update bathroom fixtures — modernizes bathrooms and adds value ↑
- Both paint exterior — enhances curb appeal and adds value ↑
- Both replace handrails — modernizes home and adds value ↑
ⓘ Cost ranges are severity-bucket heuristics (US national rule-of-thumb). Get contractor quotes + a written scope before underwriting a rehab budget.
Schools (NCES district)
- District
- Lodi Unified
- NCES district ID
- 0622230
- Math proficiency
- 24% ▼ -8.00%
- Reading proficiency
- 36% ▼ -8.00%
- Median HH income
- $57,165
- Composite
- 26.84/100
- National rank
- #7108
- State rank
- #325 of 517 in CA
Livability — Morada
- Score
- 60/100
- State rank
- #596
- US rank
- #19273
Category grades
Schools grade is shown separately in the Schools card above.
Census & demographics
- Census place
- Morada, CA
- County
- San Joaquin County · 729,570 people
- Metro
- Stockton, CA
- Population (ZIP)
- 28,437
- Household income
- $111,720
- Rent vs Own
- Severe rent burden
- 414.0
Population outlook (San Joaquin County) Hauer SSP2
- Today (2025)
- 796,965 people
- By 2030
- 828,849 · +4.0%
- By 2040
- 885,611 · +11.1%
- By 2050
- 929,798 · +16.7%
- By 2075
- 994,578 · +24.8%
- By 2100
- 971,291 · +21.9%
Race, ethnicity, and origin ACS 2023
- Neighborhood character
- Highly diverse neighborhood (Simpson 0.70)
- Race & ethnicity
- Asian 43% Hispanic / Latino 24% White 22% Two or more races 12% Black 6% Native American 2%
- Hispanic origin (detail)
- Mexican 21%
- Common ancestry
- Italian 2% Slovak 2% Romanian 1%
- Foreign-born
- 31% · Canada, Vietnam, China
- Languages at home
- 49% English-only · Spanish 18% Other Asian/Pacific 10% Tagalog/Filipino 9%
Political lean MEDSL · San Joaquin
- 2024 margin
- Toss-up / Even · D 48.0% · R 48.9% · Other 3.0%
- 2008→2024 swing
- -11.6pp toward R · 2008: 10.7pp · 2024: -0.9pp
- All cycles
- 2024: R+0.9 2020: D+13.9 2016: D+12.9 2012: D+8.9 2008: D+10.7
Not yet ingested
- Civics
- —
Market trends
- HPI YoY
- ▼ -188.93%
- Current HPI
- 265.3844
- Rent YoY
- —
- Metro
- Stockton, CA
- State GDP YoY
- ▲ 3.21%
- F500 in state
- 116
Industry mix (Fortune 500 HQ in CA)
| Industry | F500 HQs | Revenue |
|---|---|---|
| Technology | 27 | $1,492B |
|
||
| Financial Services | 3 | $174B |
|
||
| Retail | 3 | $44B |
|
||
| Insurance | 3 | $26B |
|
||
| Media / Entertainment | 2 | $115B |
|
||
| Pharmaceuticals / Biotech | 2 | $62B |
|
||
Cash-flow waterfall
monthlySold comps — $/sqft
last 12 mo · ≤1 miLoading sold comps…