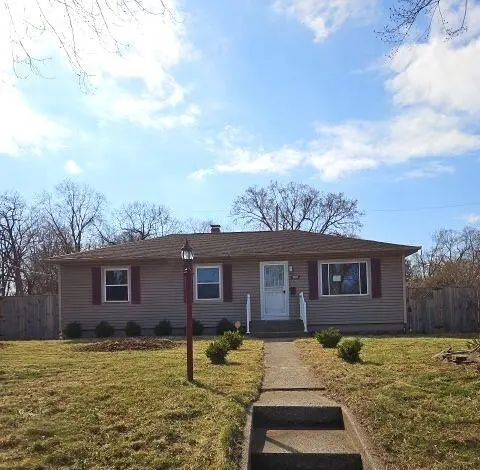
300 S Grand Blvd · Gary, IN
Flood risk 1/10 · Minimal
- FEMA flood zone
- X (unshaded)
- Chance of flooding over 30 yrs
- 0.0%
- Est. flood insurance / yr
- $473 – $860
Fire risk 7/10 · Major
- Est. fire insurance / yr
- $717 – $1,331
Heat risk 3/10 · Minor
- Hot days now (above 102°F)
- 7 days/yr
- Hot days in 30 yrs
- 15 days/yr
Wind risk 2/10 · Minimal
- Chance of severe wind over 30 yrs
- 1.0%
Air-quality risk 4/10 · Minor
- Unhealthy air days now
- 6 days/yr
- Unhealthy air days in 30 yrs
- 7 days/yr
Risk factors via First Street. Map © Google.
Why this score? — see what drove the C grade
The composite is a weighted blend of 9 inputs, each scored 0–100. Each bar is that input's sub-score; the figure is the points it added to the 100-point composite (weight × sub-score).
- Cash flow +19.4/30.0
- ARV discount +15.0/15.0
- DSCR +6.1/10.0
- 1% rule +6.0/10.0
- Livability +3.7/5.0
- Rent growth +2.5/5.0
- Condition / age +2.5/5.0
- Schools +0.5/10.0
- Appreciation +0.0/10.0
$174,900
🖨 Deal sheet 📄 Offer letter ✓ Due diligence
Listing remarks MLS
Enjoy coastal living in Miller Beach! Home offering 3 bedrooms on main floor plus 2 additional bedrooms in the basement (total 5 rooms). Bright open layout with quality finishes, spacious living areas, and a well-appointed kitchen with stainless steel appliances. Large private backyard with covered patio, perfect for relaxing or entertaining. Conveniently located just minutes from the beach, Indiana Dunes, dining, and shopping. Schedule your showing today!
Key facts
- Private backyard
- Covered patio
- Conveniently located
Tags
Neighborhood map
What this means for you Summary
Snapshot
- This is a 3-bed/1.0-bath single-family listed at $175k.
Deal economics
- At list price, monthly cash flow is $195 ($2k/yr) — positive.
- The deal already cash-flows at list — no discount required.
- Meets the 1% rule at list price ($2k rent vs $175k).
- Recommended offer: $170k (3.0% below list) — sets the bar for market timing.
Location & tenants
- Location reads 73/100 on livability (#105 in IN) — a middle-class / working-renter tenant base. Strengths: commute A+, cost of living A+, housing A+; Watch: schools F, crime F, employment F.
- Gary Community School Corporation (urban): math 3% / reading 11% proficiency, ranked #299 of 301 in IN (top 99%) — low school quality limits family demand, transient renter base, plan for 1-2y turnover; 80% free/reduced lunch — lower-income household profile, screen leases tightly.
- Market conditions: 88 active listings in the ZIP; 5 comparable units currently listed for rent nearby; rentals at typical pace (median 17d on market — plan ~3-4 weeks tenant-placement turnaround); 40% of comp listings sitting > 30 days — soft ceiling on asking rent; 1,642 units permitted in Lake County in 2024 (14 in 5+ unit buildings).
- At $1,919/mo this rent would consume 50% of the median local household income ($46k/yr) (locally 656% of renters already pay >50% of income on rent) — very limited rent-growth headroom before tenants either downsize or default.
Forward outlook
- Local home prices are declining (-3.0%/yr); year-one equity from $1k of loan paydown is wiped out by about $5k of value loss. Plan a longer hold.
- Lake County population projected to shrink 7% by 2050 — rents likely to lag national; underwrite the cash flow, not the appreciation.
Negotiation context
- It's been on market 42 days — a 3% lower offer ($170k) is reasonable based on typical stale-listing flexibility.
- 4 sale attempts since 4y ago; this cycle's ask has dropped $10k (5%) from the opening price — seller is motivated, your offer sets the floor, not the list.
Risks & watch-outs
- Watch-outs: built in 1951 — expect roof / HVAC / electrical / plumbing capex.
- Climate carrying-cost: major wildfire risk — expect insurance premiums to compound above CPI over the hold.
Questions for the listing agent
- It's been on market 42 days. Have you received any prior offers? Is the seller open to a 3% concession, seller financing, or rate buy-down credit?
- Built in 1951 — when were the roof, HVAC, electrical panel, plumbing, and water heater last replaced?
- Is there a deadline driving the sale (1031 exchange, divorce, estate, relocation)? That informs how much negotiation room exists.
- Schools are F-rated, which usually means shorter tenancies and higher turnover. Who's the typical renter profile here, and what's been the actual vacancy rate?
- Crime grade is F in this area — have there been break-ins, vandalism, or insurance claims at this property in the last 3 years? What carrier currently insures it and at what premium?
- What's the average days-on-market for RENTAL listings here right now (not sales)? A rising rental-DOM trend means longer vacancies and softer asking-rent achievability than the comps imply.
- What's the recent tenant-quality profile in this submarket — average credit score on applications, eviction rate, late-payment / NSF rate, and stable-employment percentage? A property-management company in the area should have these aggregated.
- How much new for-sale + rental construction is in the pipeline within 1–3 miles? Heavy new supply typically softens prices + rents 12–24 months out; constrained supply supports both.
Investment metrics
- 1% rule
- 1.10% ✓
- Cap rate
- 7.63%
- Cash-on-cash
- 4.78%
- DSCR
- 1.21
- GRM
- 7.6
CMA / ARV
- ARV (median comp)
- $248,825
- List price
- $174,900
- Delta
- -29.71%
- Verdict
- UNDERPRICED
- Comps
- 20 within 1.0 mi
Show comp detail 12 sales within ~0.75 mi
| Address | Dist | Beds/Ba | Sqft | Sold | Price | $/sf | Match |
|---|---|---|---|---|---|---|---|
| 308 S Howard St | 0.16mi | 3/2.0 | 2,161 (+2%) | 1mo | $220,000 | $102 | 84 |
| 6516 E 3rd Pl | 0.12mi | 3/1.5 | 1,950 (-8%) | 3mo | $112,500 | $58 | 77 |
| 7030 E 1st Ave | 0.52mi | 3/2.0 | 2,126 (+1%) | 2mo | $238,000 | $112 | 69 |
| 357 S Huntington St | 0.09mi | 4/2.0 (+1) | 1,997 (-5%) | 11mo | $244,900 | $123 | 68 |
| 6741 Ash Pl | 0.33mi | 4/2.0 (+1) | 2,256 (+7%) | 2mo | $270,000 | $120 | 62 |
| 6610 E 3rd Ave | 0.18mi | 2/2.0 (-1) | 1,868 (-12%) | 4mo | $185,000 | $99 | 60 |
| 386 S Huntington St | 0.13mi | 2/1.5 (-1) | 1,848 (-12%) | 9mo | $140,000 | $76 | 59 |
| 6837 Ash Pl | 0.41mi | 3/2.0 | 1,868 (-12%) | 0mo | $225,000 | $120 | 57 |
| 6801 Forest Ave | 0.75mi | 3/1.5 | 2,188 (+4%) | 0mo | $240,000 | $110 | 57 |
| 7033 E 1st Ave | 0.50mi | 3/2.0 | 1,935 (-8%) | 4mo | $277,500 | $143 | 56 |
| 6957 Ash Ave | 0.49mi | 3/1.5 | 2,330 (+10%) | 5mo | $229,000 | $98 | 54 |
| 7019 Ash Pl | 0.54mi | 3/1.5 | 1,943 (-8%) | 10mo | $265,000 | $136 | 51 |
Match score weights: distance 35% · size 25% · config 20% · recency 20%. Top-matched comps best support the ARV.
Projected returns pro-forma
-3.0% appreciation · 3.0% rent growth · sell at horizon
- IRR
- -8.8%
- Equity multiple
- 0.68×
- Total profit
- $-15,811
- Equity at exit
- $26,078
- IRR
- 0.8%
- Equity multiple
- 1.05×
- Total profit
- $2,638
- Equity at exit
- $15,122
Cash invested: $48,972 (down + closing). Projections, not guarantees.
Landlord ↔ Tenant lean methodology
- Overall (STATE)
- 90 Strongly Landlord-Friendly
- State Indiana
- 90 Strongly Landlord-Friendly · R+11
- County
- — inherits STATE
- City
- — inherits STATE
ZIP-level market 46403
- Home prices YoY
- -27.3%
- Active inventory
- 88
- Price-to-rent
- 7.6×
Monthly cashflow live
- Estimated rent
- $1,919 high interval (Pro) →
- Mortgage (P&I)
- −$917
- Tax from tax record
- −$331 /mo · $3,968/yr
- Insurance
- −$73
- HOA
- −$0
- Vacancy / Maint / Mgmt
- −$403
- Net cashflow
- $195
Break-even live
UW: 25.0% down · 7.5% · 30yr · 1.5% tax · 5.0% vac · 8.0% maint · 8.0% mgmt
Financing live
Cash to close
- Down payment
- $43,725
- Closing costs
- $5,247
- Reserves months
- —
- Total cash needed
- —
Loan-product check · same deal, 3 products live
Conventional
25% down · 7.5% · 30yr
- Down + closing
- —
- Monthly P&I
- —
- Monthly cashflow
- —
- DSCR
- —
- Eligible?
- —
Personal DTI + credit; lowest rate.
DSCR
20% down · 8.5% · 30yr
- Down + closing
- —
- Monthly P&I
- —
- Monthly cashflow
- —
- DSCR
- —
- Eligible?
- —
No personal income docs; deal must DSCR.
Hard money
10% down · 12.0% · 12mo
- Down + closing
- —
- Monthly P&I
- —
- Monthly cashflow
- —
- DSCR
- —
- Eligible?
- —
Short-term bridge; refi at stabilization.
Rent comps 5 comps
| Address | Beds | Baths | Sqft | Rent | $/sqft | DOM | Units | Dist |
|---|---|---|---|---|---|---|---|---|
| 7009 E 1st Ave Gary, IN | 3.0 | 1.5 | 1680 | $2,575 | $1.53 | 17d | 1 | 0.45mi |
| 7206 Indian Boundary Gary, IN | 4.0 | 3.0 | 2860 | $2,500 | $0.87 | 43d | 1 | 1.06mi |
| 4408 E 7th Ave Gary, IN | 3.0 | 1.0 | 1920 | $1,200 | $0.62 | 1d | 1 | 1.28mi |
| 1226 Cass St Gary, IN | 4.0 | 2.0 | 1832 | $1,650 | $0.90 | 43d | 1 | 1.33mi |
| 8350 Lakewood Ave Gary, IN | 3.0 | 2.0 | 2400 | $1,650 | $0.69 | 1d | 1 | 1.41mi |
Listing history 9 events
-
2026-05-11price $174,900 460-char remark
Show marketing remark (460 chars)
Enjoy coastal living in Miller Beach! Home offering 3 bedrooms on main floor plus 2 additional bedrooms in the basement (total 5 rooms). Bright open layout with quality finishes, spacious living areas, and a well-appointed kitchen with stainless steel appliances. Large private backyard with covered patio, perfect for relaxing or entertaining. Conveniently located just minutes from the beach, Indiana Dunes, dining, and shopping. Schedule your showing today!
-
2026-04-10$184,900 Active 460-char remark
Show marketing remark (460 chars)
Enjoy coastal living in Miller Beach! Home offering 3 bedrooms on main floor plus 2 additional bedrooms in the basement (total 5 rooms). Bright open layout with quality finishes, spacious living areas, and a well-appointed kitchen with stainless steel appliances. Large private backyard with covered patio, perfect for relaxing or entertaining. Conveniently located just minutes from the beach, Indiana Dunes, dining, and shopping. Schedule your showing today!
-
2025-06-13historical
-
2025-03-20historical
-
2025-03-19$299,900 Active
-
2025-03-07Active
-
2022-05-10soldstatus $166,250 Closed
-
2022-04-10historical Active Under Contract
-
2022-04-04$165,000 Active
ⓘ Source: listings_history table (triggers on properties + properties_extension) + one-shot
backfill from property_details.listing_events for pre-trigger history.
Tax reassessment forecast IN · Partial reset (capped growth)
- Current annual tax
- $3,968 · $331/mo
- Projected year-2 tax
- $3,968 · $331/mo
- Expected delta
- $0/yr ($0/mo · 0.0%)
ⓘ Screening estimate from a state-policy table — verify with the county assessor before closing.
Climate risk First Street
- Flood 1/10 Low FEMA zone X (unshaded) · 0% chance over 30 yrs
- Wildfire 7/10 Severe
- Heat 3/10 Moderate 7 d/yr ≥102°F today · 15 d/yr by 30 yrs out
- Wind 2/10 Low 100% chance of damaging wind over 30 yrs
- Air quality 4/10 Moderate 6 unhealthy d/yr today · 7 by 30 yrs out
Nearby sold comps map
Loading sold comps map…
Walkable amenities ~0.75 mi
Loading nearby amenities…
Taxation est. · year 1
- Rental income
- $23,027
- − Mortgage interest
- −$9,797
- − Property taxes
- −$3,968
- − Insurance
- −$874
- − Repairs & maintenance
- −$1,842
- − Management
- −$1,842
- − Depreciation
- −$5,088
- Taxable loss
- −$385
- Est. tax savings @ 24.0%
- +$92
- After-tax cash flow
- $2,435/yr
For passive investors: Depreciation is non-cash, so a rental often shows a tax loss while cash-flowing — sheltering income. Rental losses are passive: they offset passive income freely, and up to $25,000/yr can offset ordinary (W-2) income if you actively participate and your MAGI is under $100k (phasing out to $0 by $150k); unused losses carry forward. On sale, claimed depreciation is recaptured at up to 25%, and gains may owe capital-gains tax (a 1031 exchange can defer both). Figures are a year-1 estimate at your 24.0% rate — not tax advice; consult a CPA.
Schools (NCES district)
- District
- Gary Community School Corporation
- NCES district ID
- 1803870
- Math proficiency
- 3% ▼ -10.00%
- Reading proficiency
- 11% ▼ -6.00%
- Median HH income
- $27,739
- Composite
- 4.98/100
- National rank
- #10039
- State rank
- #299 of 301 in IN
Livability — Gary
- Score
- 73/100
- State rank
- #105
- US rank
- #5592
Category grades
Schools grade is shown separately in the Schools card above.
Census & demographics
- Census place
- Gary, IN
- County
- Lake County · 422,878 people
- City population
- 63,701
- Metro
- Chicago-Naperville-Elgin, IL-IN-WI
- Population (ZIP)
- 10,929
- Household income
- $45,991
- Rent vs Own
- Severe rent burden
- 656.0
Population outlook (Lake County) Hauer SSP2
- Today (2025)
- 484,026 people
- By 2030
- 478,091 · -1.2%
- By 2040
- 462,974 · -4.3%
- By 2050
- 449,894 · -7.1%
- By 2075
- 436,169 · -9.9%
- By 2100
- 426,607 · -11.9%
Race, ethnicity, and origin ACS 2023
- Neighborhood character
- Predominantly Black (71%)
- Race & ethnicity
- Black 71% White 18% Hispanic / Latino 9% Two or more races 4%
- Hispanic origin (detail)
- Mexican 5% Puerto Rican 4%
- Common ancestry
- Romanian 2% Hispanic 1% Iranian 1%
- Foreign-born
- 3% · Canada
- Languages at home
- 96% English-only · Spanish 2%
Political lean MEDSL · Lake
- 2024 margin
- Lean D (+5.6) · D 52.1% · R 46.5% · Other 1.5%
- 2008→2024 swing
- -28.6pp toward R · 2008: 34.3pp · 2024: 5.6pp
- All cycles
- 2024: D+5.6 2020: D+15.1 2016: D+20.6 2012: D+31.0 2008: D+34.3
Not yet ingested
- Civics
- —
Market trends
- HPI YoY
- ▼ -110.41%
- Current HPI
- 294.0935
- Rent YoY
- —
- Metro
- Chicago-Naperville-Elgin, IL-IN-WI
- State GDP YoY
- ▲ 2.90%
- F500 in state
- 18
Industry mix (Fortune 500 HQ in IN)
| Industry | F500 HQs | Revenue |
|---|---|---|
| Industrial Machinery | 2 | $37B |
|
||
| Healthcare | 1 | $177B |
|
||
| Pharmaceuticals | 1 | $45B |
|
||
| Metals / Steel | 1 | $18B |
|
||
| Agriculture | 1 | $17B |
|
||
| Packaging | 1 | $12B |
|
||
Price history
+6.0% since first listed9 events — show timeline
- 2026-05-11 Price Changed $174,900 NIRA MLS as Distributed by MLS Grid
- 2026-04-10 Listed $184,900 NIRA MLS as Distributed by MLS Grid
- 2025-06-13 Listing Removed — NIRA MLS as Distributed by MLS Grid
- 2025-03-20 Listing Removed — MRED as Distributed by MLS Grid
- 2025-03-19 Listed $299,900 NIRA MLS as Distributed by MLS Grid
- 2025-03-07 Listed — MRED as Distributed by MLS Grid
- 2022-05-10 Sold (MLS) $166,250 NIRA MLS as Distributed by MLS Grid
- 2022-04-10 Contingent — NIRA MLS as Distributed by MLS Grid
- 2022-04-04 Listed $165,000 NIRA MLS as Distributed by MLS Grid
Property tax history
+13.1%/yrLatest (2024): $3,968 · +4.9% YoY. Source: county tax records.
Cash-flow waterfall
monthlySold comps — $/sqft
last 12 mo · ≤1 miLoading sold comps…