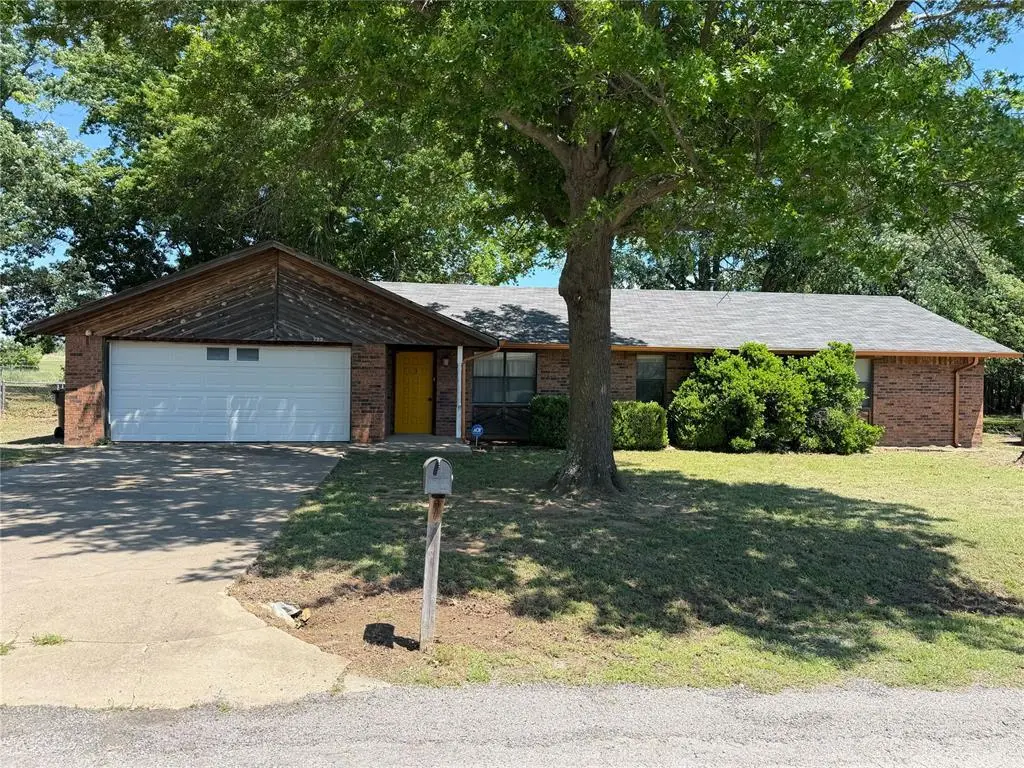
722 Arrowhead St · Elmore City, OK
Flood risk 1/10 · Minimal
- FEMA flood zone
- X (unshaded)
- Chance of flooding over 30 yrs
- 0.0%
- Est. flood insurance / yr
- $507 – $1,088
Fire risk 6/10 · Moderate
- Est. fire insurance / yr
- $2,463 – $4,575
Heat risk 6/10 · Moderate
- Hot days now (above 110°F)
- 7 days/yr
- Hot days in 30 yrs
- 19 days/yr
Wind risk 4/10 · Minor
- Chance of severe wind over 30 yrs
- 10.0%
Air-quality risk 2/10 · Minimal
- Unhealthy air days now
- 1 days/yr
- Unhealthy air days in 30 yrs
- 2 days/yr
Risk factors via First Street. Map © Google.
Why this score? — see what drove the D grade
The composite is a weighted blend of 9 inputs, each scored 0–100. Each bar is that input's sub-score; the figure is the points it added to the 100-point composite (weight × sub-score).
- Cash flow +12.4/30.0
- ARV discount +10.1/15.0
- Appreciation +5.0/10.0
- DSCR +3.7/10.0
- Livability +2.9/5.0
- 1% rule +2.8/10.0
- Rent growth +2.5/5.0
- Condition / age +2.5/5.0
- Schools +1.4/10.0
$151,700
🖨 Deal sheet 📄 Offer letter ✓ Due diligence
Listing remarks MLS
Don’t let this hard to come by 3 bedroom- 2 bath - 2 car garage cozy home in Elmore City pass you buy! Wonderful street and located easy on and off the Highway - and it backs up to the ball park! Large lot with trees and nice back patio! This house is the perfect buy and is in such a great price range! You won’t want to miss out!
Key facts
- 0.32 acre lot
- 2 garage spots
- Built 1979
Property features AI
Finance
- Other: Property in Helvey Addition
- Financial info: Loan qualification allowed; Not assumable
- HOA & community: No mandatory association dues
Exterior
- Parking: 2-car garage
- Home design: Single family residence; One story; Residential property; Existing property
- Construction: Brick construction; Composition roof; Slab foundation; Built status: existing
- Exterior features: Outbuildings; Interior lot
Interior
- Bedrooms: 3 bedrooms
- Bathrooms: 2 full bathrooms
- Interior features: One living area; No fireplace; No study listed
Neighborhood map
What this means for you Summary
Snapshot
- This is a 3-bed/2.0-bath single-family listed at $152k.
Deal economics
- At list price, monthly cash flow is $-25 ($-305/yr) — negative.
- To cash-flow at today's rent, offer at most $147k (3.0% below list).
- To meet the 1% rule (rent ≥ 1% of price), the offer needs to be $119k (21.6% below list).
- Recommended offer: $119k (21.6% below list) — sets the bar for 1% rule.
Location & tenants
- Location reads 58/100 on livability (#434 in OK) — a working-class tenant base; expect higher turnover. Strengths: cost of living A+, housing A; Watch: employment D, crime F, amenities F.
- Elmore City-Pernell (rural): math 12% / reading 20% proficiency, ranked #210 of 270 in OK (top 78%) — low school quality limits family demand, transient renter base, plan for 1-2y turnover.
- Zoned schools: Elmore City-Pernell Es (math 17% / reading 22%, grade F, #479 of 845 statewide, top 63%, 224 students, 0% FRL) — zoned schools average 0% FRL vs 49% district-wide (49 pts lower); this property's tenant base skews higher-income than the district average.
- Market conditions: 49 active listings in the ZIP; 1 units permitted in Garvin County in 2024 (0 in 5+ unit buildings).
Forward outlook
- In year one you build about $6k of equity ($1k loan paydown + $5k appreciation (3.0% local appreciation)).
- Garvin County population projected at +8% by 2050 — modest demand growth; plan on rents tracking national, not racing it.
- At projected returns (3.0% appreciation + 3.0% rent growth), your $42k cash investment doubles in ~7 years — after that, you're playing with house money.
- By year 7, paydown + projected appreciation supports a ~$35k cash-out refi (75% LTV) — recoverable capital for the next deal without selling this one.
Negotiation context
- Only 1 days on market — expect competitive offers; lowballing is unlikely to land.
- 2 sale attempts since 2y ago with the ask held roughly flat each time — persistent listings suggest the price (not the market) is what's stuck; bring a comps-based counter.
Risks & watch-outs
- Climate carrying-cost: major wildfire risk; extreme-heat days projected 7→19/yr by 2055 (HVAC capex compounding) — expect insurance premiums to compound above CPI over the hold.
Questions for the listing agent
- What do current leases actually rent for vs. the listed asking? Can we see a recent rent roll and the last 12 months of T-12 income?
- Built in 1979 — when were the roof, HVAC, electrical panel, plumbing, and water heater last replaced?
- Is there a deadline driving the sale (1031 exchange, divorce, estate, relocation)? That informs how much negotiation room exists.
- Schools are F-rated, which usually means shorter tenancies and higher turnover. Who's the typical renter profile here, and what's been the actual vacancy rate?
- Crime grade is F in this area — have there been break-ins, vandalism, or insurance claims at this property in the last 3 years? What carrier currently insures it and at what premium?
- The area grade is low — what's the realistic commute time and amenity access for the typical tenant pool here? Any planned neighborhood developments (good or bad) we should know about?
- What's the average days-on-market for RENTAL listings here right now (not sales)? A rising rental-DOM trend means longer vacancies and softer asking-rent achievability than the comps imply.
- What's the recent tenant-quality profile in this submarket — average credit score on applications, eviction rate, late-payment / NSF rate, and stable-employment percentage? A property-management company in the area should have these aggregated.
- How much new for-sale + rental construction is in the pipeline within 1–3 miles? Heavy new supply typically softens prices + rents 12–24 months out; constrained supply supports both.
Investment metrics
- 1% rule
- 0.78% ✗
- Cap rate
- 6.09%
- Cash-on-cash
- -0.72%
- DSCR
- 0.97
- GRM
- 10.6
CMA / ARV
- ARV (on-the-fly)
- $161,109
- Comps found
- 3
Show comp detail 3 sales within ~0.75 mi
| Address | Dist | Beds/Ba | Sqft | Sold | Price | $/sf | Match |
|---|---|---|---|---|---|---|---|
| 604 N Main St | 0.27mi | 3/2.0 | 1,488 (+8%) | 1mo | $125,000 | $84 | 73 |
| 407 N Missouri St | 0.46mi | 3/2.0 | 1,270 (-8%) | 9mo | $148,000 | $117 | 58 |
| 307 Main St | 0.55mi | 3/2.0 | 1,279 (-7%) | 8mo | $156,000 | $122 | 56 |
Match score weights: distance 35% · size 25% · config 20% · recency 20%. Top-matched comps best support the ARV.
Projected returns pro-forma
3.0% appreciation · 3.0% rent growth · sell at horizon
- IRR
- 6.8%
- Equity multiple
- 1.39×
- Total profit
- $16,623
- Equity at exit
- $68,211
- IRR
- 9.6%
- Equity multiple
- 2.45×
- Total profit
- $61,421
- Equity at exit
- $105,121
Cash invested: $42,476 (down + closing). Projections, not guarantees.
Landlord ↔ Tenant lean methodology
- Overall (STATE)
- 83 Strongly Landlord-Friendly
- State Oklahoma
- 83 Strongly Landlord-Friendly · R+20
- County
- — inherits STATE
- City
- — inherits STATE
ZIP-level market 73433
- Active inventory
- 49
- Price-to-rent
- 10.6×
Monthly cashflow live
- Estimated rent
- $1,189 medium interval (Pro) →
- Mortgage (P&I)
- −$796
- Tax from tax record
- −$106 /mo · $1,269/yr
- Insurance
- −$63
- HOA
- −$0
- Vacancy / Maint / Mgmt
- −$250
- Net cashflow
- $-25
Break-even live
UW: 25.0% down · 7.5% · 30yr · 1.5% tax · 5.0% vac · 8.0% maint · 8.0% mgmt
Financing live
Cash to close
- Down payment
- $37,925
- Closing costs
- $4,551
- Reserves months
- —
- Total cash needed
- —
Loan-product check · same deal, 3 products live
Conventional
25% down · 7.5% · 30yr
- Down + closing
- —
- Monthly P&I
- —
- Monthly cashflow
- —
- DSCR
- —
- Eligible?
- —
Personal DTI + credit; lowest rate.
DSCR
20% down · 8.5% · 30yr
- Down + closing
- —
- Monthly P&I
- —
- Monthly cashflow
- —
- DSCR
- —
- Eligible?
- —
No personal income docs; deal must DSCR.
Hard money
10% down · 12.0% · 12mo
- Down + closing
- —
- Monthly P&I
- —
- Monthly cashflow
- —
- DSCR
- —
- Eligible?
- —
Short-term bridge; refi at stabilization.
Listing history 9 events
-
2026-05-04status Pending
-
2026-05-01$151,700 Active
-
2024-04-26soldstatus $136,000
-
2024-02-12soldstatus $136,000 Closed 343-char remark
Show marketing remark (343 chars)
Don’t let this hard to come by 3 bedroom- 2 bath - 2 car garage cozy home in Elmore City pass you buy! Wonderful street and located easy on and off the Highway - and it backs up to the ball park! Large lot with trees and nice back patio! This house is the perfect buy and is in such a great price range! You won’t want to miss out!
-
2024-01-31status Pending 343-char remark
Show marketing remark (343 chars)
Don’t let this hard to come by 3 bedroom- 2 bath - 2 car garage cozy home in Elmore City pass you buy! Wonderful street and located easy on and off the Highway - and it backs up to the ball park! Large lot with trees and nice back patio! This house is the perfect buy and is in such a great price range! You won’t want to miss out!
-
2024-01-24$146,000 Active 343-char remark
Show marketing remark (343 chars)
Don’t let this hard to come by 3 bedroom- 2 bath - 2 car garage cozy home in Elmore City pass you buy! Wonderful street and located easy on and off the Highway - and it backs up to the ball park! Large lot with trees and nice back patio! This house is the perfect buy and is in such a great price range! You won’t want to miss out!
-
2019-05-02soldstatus $95,000
-
2014-05-20soldstatus $78,600
-
2003-05-30soldstatus $54,000
ⓘ Source: listings_history table (triggers on properties + properties_extension) + one-shot
backfill from property_details.listing_events for pre-trigger history.
Tax reassessment forecast OK · Resets to sale price
- Current annual tax
- $1,269 · $106/mo
- Projected year-2 tax
- $1,365 · $114/mo
- Expected delta
- +$96/yr (+$8/mo · 7.6%)
ⓘ Screening estimate from a state-policy table — verify with the county assessor before closing.
Climate risk First Street
- Flood 1/10 Low FEMA zone X (unshaded) · 0% chance over 30 yrs
- Wildfire 6/10 Major
- Heat 6/10 Major 7 d/yr ≥110°F today · 19 d/yr by 30 yrs out
- Wind 4/10 Moderate 10% chance of damaging wind over 30 yrs
- Air quality 2/10 Low 1 unhealthy d/yr today · 2 by 30 yrs out
Nearby sold comps map
Loading sold comps map…
Walkable amenities ~0.75 mi
Loading nearby amenities…
Taxation est. · year 1
- Rental income
- $14,265
- − Mortgage interest
- −$8,498
- − Property taxes
- −$1,269
- − Insurance
- −$758
- − Repairs & maintenance
- −$1,141
- − Management
- −$1,141
- − Depreciation
- −$4,413
- Taxable loss
- −$2,956
- Est. tax savings @ 24.0%
- +$709
- After-tax cash flow
- $405/yr
For passive investors: Depreciation is non-cash, so a rental often shows a tax loss while cash-flowing — sheltering income. Rental losses are passive: they offset passive income freely, and up to $25,000/yr can offset ordinary (W-2) income if you actively participate and your MAGI is under $100k (phasing out to $0 by $150k); unused losses carry forward. On sale, claimed depreciation is recaptured at up to 25%, and gains may owe capital-gains tax (a 1031 exchange can defer both). Figures are a year-1 estimate at your 24.0% rate — not tax advice; consult a CPA.
Schools (NCES district)
- District
- Elmore City-Pernell
- NCES district ID
- 4010860
- Math proficiency
- 12% ▼ -11.00%
- Reading proficiency
- 20% ▼ -5.00%
- Median HH income
- $43,345
- Composite
- 13.93/100
- National rank
- #9480
- State rank
- #210 of 270 in OK
Livability — Elmore City
- Score
- 58/100
- State rank
- #434
- US rank
- #21202
Category grades
Schools grade is shown separately in the Schools card above.
Census & demographics
- Census place
- Elmore City, OK
- Population (ZIP)
- 2,647
Population outlook (Garvin County) Hauer SSP2
- Today (2025)
- 28,277 people
- By 2030
- 28,619 · +1.2%
- By 2040
- 29,478 · +4.2%
- By 2050
- 30,384 · +7.5%
- By 2075
- 34,074 · +20.5%
- By 2100
- 36,099 · +27.7%
Race, ethnicity, and origin ACS 2023
- Neighborhood character
- Predominantly White (79%)
- Race & ethnicity
- White 79% Two or more races 12% Hispanic / Latino 6% Native American 4%
- Hispanic origin (detail)
- Mexican 5%
- Common ancestry
- Slovak 4% Lithuanian 2% European 2%
- Foreign-born
- 1% · Canada
- Languages at home
- 96% English-only · Spanish 3% Russian/Polish/Slavic 1%
Political lean MEDSL · Garvin
- 2024 margin
- Solid R (+66.1) · D 16.4% · R 82.5% · Other 1.1%
- 2008→2024 swing
- -22.5pp toward R · 2008: -43.6pp · 2024: -66.1pp
- All cycles
- 2024: R+66.1 2020: R+64.2 2016: R+60.7 2012: R+46.1 2008: R+43.6
Not yet ingested
- Civics
- —
Market trends
- HPI YoY
- —
- Current HPI
- —
- Rent YoY
- —
- Metro
- —
- State GDP YoY
- ▲ 1.55%
- F500 in state
- 6
Industry mix (Fortune 500 HQ in OK)
| Industry | F500 HQs | Revenue |
|---|---|---|
| Energy | 3 | $48B |
|
||
Price history
+180.9% since first listed9 events — show timeline
- 2026-05-04 Pending — MLSOK
- 2026-05-01 Listed $151,700 MLSOK
- 2024-04-26 Sold (Public Records) $136,000 Public Records
- 2024-02-12 Sold (MLS) $136,000 MLSOK
- 2024-01-31 Pending — MLSOK
- 2024-01-24 Listed $146,000 MLSOK
- 2019-05-02 Sold (Public Records) $95,000 Public Records
- 2014-05-20 Sold (Public Records) $78,600 Public Records
- 2003-05-30 Sold (Public Records) $54,000 Public Records
Property tax history
+10.1%/yrLatest (2025): $1,269 · +91.4% YoY. Source: county tax records.
Cash-flow waterfall
monthlySold comps — $/sqft
last 12 mo · ≤1 miLoading sold comps…