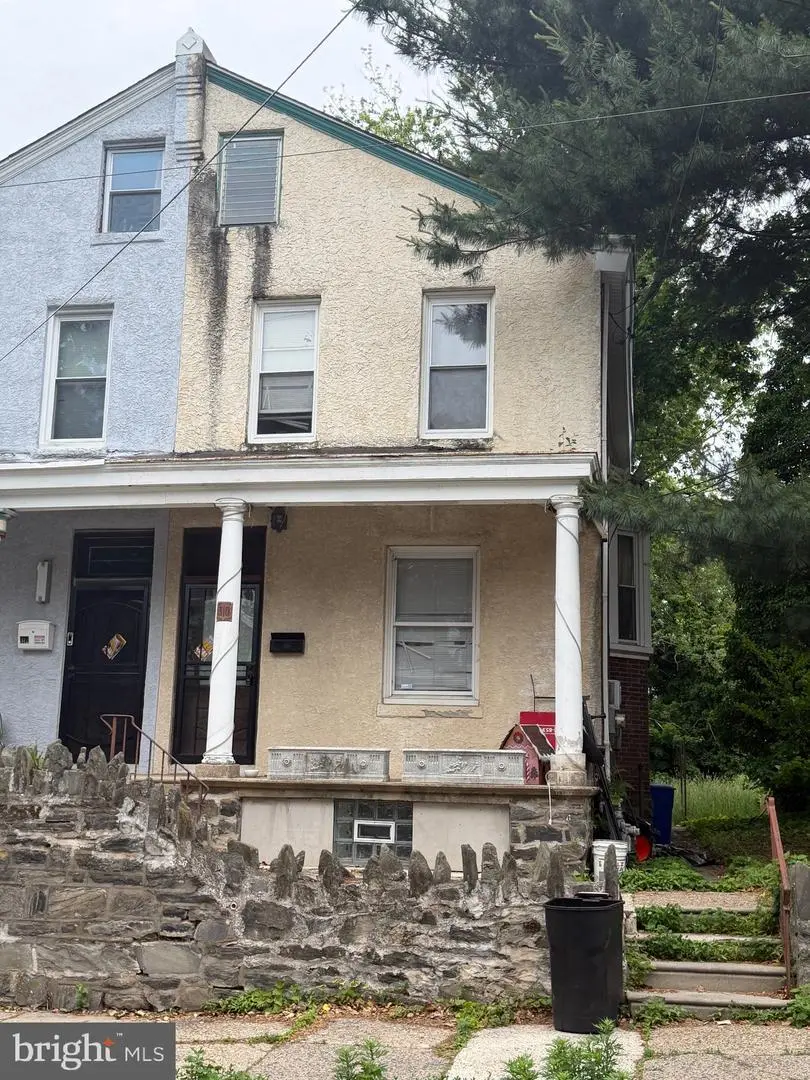
310 S 6th St S #710 · Darby, PA
Flood risk 1/10 · Minimal
- FEMA flood zone
- X (unshaded)
- Chance of flooding over 30 yrs
- 0.0%
- Est. flood insurance / yr
- $507 – $1,088
Fire risk 1/10 · Minimal
- Est. fire insurance / yr
- $511 – $949
Heat risk 7/10 · Major
- Hot days now (above 103°F)
- 7 days/yr
- Hot days in 30 yrs
- 15 days/yr
Wind risk 6/10 · Moderate
- Chance of severe wind over 30 yrs
- 27.0%
Air-quality risk 4/10 · Minor
- Unhealthy air days now
- 3 days/yr
- Unhealthy air days in 30 yrs
- 6 days/yr
Risk factors via First Street. Map © Google.
Why this score? — see what drove the B+ grade
The composite is a weighted blend of 9 inputs, each scored 0–100. Each bar is that input's sub-score; the figure is the points it added to the 100-point composite (weight × sub-score).
- Cash flow +30.0/30.0
- ARV discount +15.0/15.0
- DSCR +10.0/10.0
- 1% rule +8.8/10.0
- Rent growth +5.0/5.0
- Livability +3.7/5.0
- Condition / age +2.2/5.0
- Schools +1.7/10.0
- Appreciation +0.0/10.0
$139,900
🖨 Deal sheet 📄 Offer letter ✓ Due diligence
Listing remarks
Welcome to 310 S 6th St — a charming twin home full of character, space, and opportunity. This inviting property offers a functional layout with generous living spaces, abundant natural light, and the perfect blend of comfort and convenience. The main level features a welcoming living area, spacious dining room, and kitchen with plenty of cabinet and counter space for everyday living and entertaining. Upstairs, you’ll find comfortable bedrooms with ample closet space and a full bathroom designed for practicality and comfort. Additional living space provides flexibility for a home office, playroom, guest area, or hobby space. Outside, enjoy a private backyard perfect for relaxin
Key facts
- Private backyard
- Ample closet space
- Functional layout
Tags
Property features AI
Exterior
- Parking: On-street parking
- Utilities: Public water; Public sewer; Electric available; Natural gas available; Cable TV available; Phone service available
- Home design: Semi-detached property; Main entrance faces south; Effective year of major renovation: 2019; Fee simple ownership
- Construction: Stucco exterior; Concrete perimeter foundation; Shingle and tar/gravel roof; Built/recorded year from assessor; Basement present (fully finished footprint; partially finished details recorded)
- Exterior features: Play area; Side yard(s)
Interior
- Kitchen: Built-in microwave; Built-in range; Oven/Range - Gas; Microwave; Dishwasher; Refrigerator; Pantry; Upgraded countertops
- Bedrooms: Three bedrooms on the first upper level; One bedroom on the second upper level
- Flooring: Engineered wood; Wood floors
- Bathrooms: One full bathroom (upper level); One half bathroom (lower level)
- Heating & cooling: 90% efficient forced air heating (natural gas); Window air conditioning units; 200+ amp electrical service
- Interior features: Attic; Tub with shower; Built-ins; Ceiling fans; Traditional floor plan; Country-style kitchen; Pantry; Upgraded countertops; Wood floors; Drywall walls and ceilings; Storm door(s)
- Laundry & utility: Washer and dryer (laundry in basement); Electric water heater
Neighborhood map
What this means for you Summary
Snapshot
- This is a 4-bed/1.5-bath townhouse listed at $140k. Condition is rated fair.
Deal economics
- At list price, monthly cash flow is $557 ($7k/yr) — positive.
- The deal already cash-flows at list — no discount required.
- Meets the 1% rule at list price ($2k rent vs $140k).
- Cap rate 11.1% vs local median 6.3% in Darby — top-decile yield for the area; either an underpriced asset or a hidden risk that comps aren't pricing in. Stress-test before assuming the spread holds.
Location & tenants
- Location reads 74/100 on livability (#485 in PA, #4,468 nationally) — a middle-class / working-renter tenant base. Strengths: commute A+, cost of living A+, housing A+; Watch: amenities D+, employment D, schools F.
- William Penn SD (suburban): math 11% / reading 28% proficiency, ranked #491 of 539 in PA (top 91%) — low school quality limits family demand, transient renter base, plan for 1-2y turnover; 69% free/reduced lunch — lower-income household profile, screen leases tightly.
- Market conditions: Rents rising fast (+13.1%/yr); 99 active listings in the ZIP; 8 comparable units currently listed for rent nearby; rentals at typical pace (median 21d on market — plan ~3-4 weeks tenant-placement turnaround); 299 units permitted in Delaware County in 2024 (5 in 5+ unit buildings).
- At $1,929/mo this rent would consume 50% of the median local household income ($46k/yr) (locally 1468% of renters already pay >50% of income on rent) — very limited rent-growth headroom before tenants either downsize or default.
Forward outlook
- Local home prices are declining (-3.0%/yr); year-one equity from $967 of loan paydown is wiped out by about $4k of value loss. Plan a longer hold.
- At projected returns (-3.0% appreciation + 8.0% rent growth), your $39k cash investment doubles in ~6 years — after that, you're playing with house money.
Negotiation context
- Only 6 days on market — expect competitive offers; lowballing is unlikely to land.
Risks & watch-outs
- Watch-outs: built in 1910 — expect roof / HVAC / electrical / plumbing capex.
- Climate carrying-cost: major wind risk, 27% chance of damaging wind over 30y; extreme-heat days projected 7→15/yr by 2055 (HVAC capex compounding) — expect insurance premiums to compound above CPI over the hold.
Questions for the listing agent
- Have any recent inspections been done? Can we get a copy of the seller's disclosures and any deferred-maintenance estimates?
- Built in 1910 — when were the roof, HVAC, electrical panel, plumbing, and water heater last replaced?
- Is there a deadline driving the sale (1031 exchange, divorce, estate, relocation)? That informs how much negotiation room exists.
- Schools are F-rated, which usually means shorter tenancies and higher turnover. Who's the typical renter profile here, and what's been the actual vacancy rate?
- Crime grade is F in this area — have there been break-ins, vandalism, or insurance claims at this property in the last 3 years? What carrier currently insures it and at what premium?
- What's the average days-on-market for RENTAL listings here right now (not sales)? A rising rental-DOM trend means longer vacancies and softer asking-rent achievability than the comps imply.
- What's the recent tenant-quality profile in this submarket — average credit score on applications, eviction rate, late-payment / NSF rate, and stable-employment percentage? A property-management company in the area should have these aggregated.
- How much new for-sale + rental construction is in the pipeline within 1–3 miles? Heavy new supply typically softens prices + rents 12–24 months out; constrained supply supports both.
Investment metrics
- 1% rule
- 1.38% ✓
- Cap rate
- 11.07%
- Cash-on-cash
- 17.06%
- DSCR
- 1.76
- GRM
- 6.0
CMA / ARV
- ARV (on-the-fly)
- $244,660
- Comps found
- 12
Show comp detail 12 sales within ~0.75 mi
| Address | Dist | Beds/Ba | Sqft | Sold | Price | $/sf | Match |
|---|---|---|---|---|---|---|---|
| 223 S 6th St | 0.05mi | 4/2.0 | 1,920 (+2%) | 7mo | $103,000 | $54 | 86 |
| 221 Highland Ave | 0.34mi | 3/1.5 (-1) | 1,848 (-2%) | 7mo | $250,000 | $135 | 70 |
| 4 Creek Ave | 0.58mi | 4/2.0 | 1,872 (-0%) | 2mo | $174,900 | $93 | 69 |
| 627 Walnut St | 0.13mi | 3/1.5 (-1) | 1,710 (-9%) | 7mo | $98,000 | $57 | 68 |
| 625 Walnut St | 0.13mi | 3/1.0 (-1) | 1,710 (-9%) | 7mo | $169,000 | $99 | 66 |
| 704 Main St | 0.26mi | 5/2.5 (+1) | 1,690 (-10%) | 2mo | $220,000 | $130 | 60 |
| 421 Poplar St | 0.29mi | 3/3.0 (-1) | 1,724 (-8%) | 2mo | $300,000 | $174 | 60 |
| 121 N Front St | 0.55mi | 3/1.0 (-1) | 1,731 (-8%) | 2mo | $169,875 | $98 | 52 |
| 1143 Chestnut St | 0.70mi | 3/2.0 (-1) | 1,744 (-7%) | 2mo | $255,000 | $146 | 46 |
| 334 Mulberry St | 0.66mi | 4/2.0 | 1,632 (-13%) | 0mo | $255,000 | $156 | 45 |
| 205 N Front St | 0.57mi | 3/1.0 (-1) | 1,600 (-15%) | 5mo | $200,000 | $125 | 38 |
| 28 S 12th St | 0.72mi | 3/2.0 (-1) | 1,602 (-15%) | 5mo | $275,000 | $172 | 31 |
Match score weights: distance 35% · size 25% · config 20% · recency 20%. Top-matched comps best support the ARV.
Projected returns pro-forma
-3.0% appreciation · 8.0% rent growth · sell at horizon
- IRR
- 13.9%
- Equity multiple
- 1.59×
- Total profit
- $23,018
- Equity at exit
- $20,860
- IRR
- 26.2%
- Equity multiple
- 3.86×
- Total profit
- $112,222
- Equity at exit
- $12,096
Cash invested: $39,172 (down + closing). Projections, not guarantees.
Landlord ↔ Tenant lean methodology
- Overall (STATE)
- 62 Landlord-Friendly
- State Pennsylvania
- 62 Landlord-Friendly · EVEN
- County
- — inherits STATE
- City
- — inherits STATE
ZIP-level market 19023
- Rents YoY
- 13.1%
- Active inventory
- 99
- Price-to-rent
- 6.0×
Monthly cashflow live
- Estimated rent
- $1,929 high interval (Pro) →
- Mortgage (P&I)
- −$734
- Tax est. 1.5%
- −$175 /mo · $2,098/yr
- Insurance
- −$58
- HOA
- −$0
- Vacancy / Maint / Mgmt
- −$405
- Net cashflow
- $557
Break-even live
UW: 25.0% down · 7.5% · 30yr · 1.5% tax · 5.0% vac · 8.0% maint · 8.0% mgmt
Financing live
Cash to close
- Down payment
- $34,975
- Closing costs
- $4,197
- Reserves months
- —
- Total cash needed
- —
Loan-product check · same deal, 3 products live
Conventional
25% down · 7.5% · 30yr
- Down + closing
- —
- Monthly P&I
- —
- Monthly cashflow
- —
- DSCR
- —
- Eligible?
- —
Personal DTI + credit; lowest rate.
DSCR
20% down · 8.5% · 30yr
- Down + closing
- —
- Monthly P&I
- —
- Monthly cashflow
- —
- DSCR
- —
- Eligible?
- —
No personal income docs; deal must DSCR.
Hard money
10% down · 12.0% · 12mo
- Down + closing
- —
- Monthly P&I
- —
- Monthly cashflow
- —
- DSCR
- —
- Eligible?
- —
Short-term bridge; refi at stabilization.
Rent comps 8 comps
| Address | Beds | Baths | Sqft | Rent | $/sqft | DOM | Units | Dist |
|---|---|---|---|---|---|---|---|---|
| 94 S 6th St Darby, PA | 3.0 | 1.5 | 1666 | $2,000 | $1.20 | 24d | 1 | 0.19mi |
| 304 S 3rd St Darby, PA | 3.0 | 1.0 | 1602 | $1,595 | $1.00 | 20d | 1 | 0.21mi |
| 304 S 3rd St Darby, PA | 3.0 | 1.0 | 1602 | $1,695 | $1.06 | 43d | 1 | 0.21mi |
| 69 S 7th St Darby, PA | 3.0 | 2.0 | 1446 | $1,700 | $1.18 | 43d | 1 | 0.24mi |
| 209 Hamilton Ave Darby, PA | 4.0 | 1.0 | 1400 | $1,595 | $1.14 | 14d | 1 | 0.30mi |
| 220 N 9th St Darby, PA | 5.0 | 1.5 | 1600 | $2,800 | $1.75 | 5d | 1 | 0.53mi |
| 935 Maple Ter Darby, PA | 3.0 | 1.0 | 1266 | $1,585 | $1.25 | 5d | 1 | 0.57mi |
| 935 Maple Ter Darby, PA | 3.0 | 1.0 | 1266 | $1,585 | $1.25 | 10d | 1 | 0.57mi |
Listing history 1 events
-
2026-05-23$139,900 Active
ⓘ Source: listings_history table (triggers on properties + properties_extension) + one-shot
backfill from property_details.listing_events for pre-trigger history.
Climate risk First Street
- Flood 1/10 Low FEMA zone X (unshaded) · 0% chance over 30 yrs
- Wildfire 1/10 Low
- Heat 7/10 Severe 7 d/yr ≥103°F today · 15 d/yr by 30 yrs out
- Wind 6/10 Major 27% chance of damaging wind over 30 yrs
- Air quality 4/10 Moderate 3 unhealthy d/yr today · 6 by 30 yrs out
Nearby sold comps map
Loading sold comps map…
Walkable amenities ~0.75 mi
Loading nearby amenities…
Taxation est. · year 1
- Rental income
- $23,144
- − Mortgage interest
- −$7,837
- − Property taxes
- −$2,098
- − Insurance
- −$700
- − Repairs & maintenance
- −$1,852
- − Management
- −$1,852
- − Depreciation
- −$4,070
- Taxable income
- $4,737
- Est. tax owed @ 24.0%
- −$1,137
- After-tax cash flow
- $5,545/yr
For passive investors: Depreciation is non-cash, so a rental often shows a tax loss while cash-flowing — sheltering income. Rental losses are passive: they offset passive income freely, and up to $25,000/yr can offset ordinary (W-2) income if you actively participate and your MAGI is under $100k (phasing out to $0 by $150k); unused losses carry forward. On sale, claimed depreciation is recaptured at up to 25%, and gains may owe capital-gains tax (a 1031 exchange can defer both). Figures are a year-1 estimate at your 24.0% rate — not tax advice; consult a CPA.
Condition & rehab AI · 11 photos
This property requires moderate repairs and maintenance to improve its condition and value. Painting, landscaping, and updates to the kitchen and bathroom are recommended to enhance its appeal and marketability.
Repairs flagged
- Moderate Kitchen cabinets — Worn appearance
- Moderate Bathtub and fixtures — Signs of wear
- Moderate Exterior siding — Weathered appearance
- Moderate Interior walls/paint — Faded appearance
- Moderate Landscaping — Overgrown appearance
Value-add opportunities
- Both Painting interior walls — Fresh paint enhances curb appeal and interior aesthetics
- Both Landscaping and yard maintenance — A well-maintained yard improves curb appeal and property value
- Both Kitchen and bathroom updates — Fresh updates in these key areas can significantly boost both resale and rental value
Renovation cost estimate screening
| Repair item | Severity | Est. cost |
|---|---|---|
| Kitchen cabinets · Worn appearance | Moderate | $3,000–15,000 |
| Bathtub and fixtures · Signs of wear | Moderate | $3,000–15,000 |
| Exterior siding · Weathered appearance | Moderate | $3,000–15,000 |
| Interior walls/paint · Faded appearance | Moderate | $3,000–15,000 |
| Landscaping · Overgrown appearance | Moderate | $3,000–15,000 |
| Total estimated repair cost · 5 items | $15,000–75,000 |
Value-add ROI direction
- Both Painting interior walls — Fresh paint enhances curb appeal and interior aesthetics ↑
- Both Landscaping and yard maintenance — A well-maintained yard improves curb appeal and property value ↑
- Both Kitchen and bathroom updates — Fresh updates in these key areas can significantly boost both resale and rental value ↑
ⓘ Cost ranges are severity-bucket heuristics (US national rule-of-thumb). Get contractor quotes + a written scope before underwriting a rehab budget.
Schools (NCES district)
- District
- William Penn SD
- NCES district ID
- 4226390
- Math proficiency
- 11% ▼ -3.00%
- Reading proficiency
- 28% ▼ -7.00%
- Median HH income
- $48,543
- Composite
- 17.29/100
- National rank
- #9086
- State rank
- #491 of 539 in PA
Livability — Darby
- Score
- 74/100
- State rank
- #485
- US rank
- #4468
Category grades
Schools grade is shown separately in the Schools card above.
Census & demographics
- Census place
- Darby, PA
- County
- Delaware County · 399,863 people
- Metro
- Philadelphia-Camden-Wilmington, PA-NJ-DE-MD
- Population (ZIP)
- 22,247
- Household income
- $46,463
- Rent vs Own
- Severe rent burden
- 1468.0
Population outlook (Delaware County) Hauer SSP2
- Today (2025)
- 577,490 people
- By 2030
- 581,243 · +0.6%
- By 2040
- 584,700 · +1.2%
- By 2050
- 586,581 · +1.6%
- By 2075
- 598,706 · +3.7%
- By 2100
- 590,823 · +2.3%
Race, ethnicity, and origin ACS 2023
- Neighborhood character
- Predominantly Black (76%)
- Race & ethnicity
- Black 76% White 15% Two or more races 5% Hispanic / Latino 3% Asian 2%
- Common ancestry
- Swiss 5% Hispanic 1% Romanian 1%
- Foreign-born
- 18% · Canada
- Languages at home
- 84% English-only · French/Haitian/Cajun 4% Spanish 3% Other Asian/Pacific 1%
Political lean MEDSL · Delaware
- 2024 margin
- Strong D (+23.7) · D 61.4% · R 37.6% · Other 1.0%
- 2008→2024 swing
- +2.3pp toward D · 2008: 21.4pp · 2024: 23.7pp
- All cycles
- 2024: D+23.7 2020: D+26.7 2016: D+22.0 2012: D+21.8 2008: D+21.4
Not yet ingested
- Civics
- —
Market trends
- HPI YoY
- ▼ -190.50%
- Current HPI
- 277.7034
- Rent YoY
- ▲ 13.10%
- Metro
- Philadelphia-Camden-Wilmington, PA-NJ-DE-MD
- State GDP YoY
- ▲ 1.68%
- F500 in state
- 34
Industry mix (Fortune 500 HQ in PA)
| Industry | F500 HQs | Revenue |
|---|---|---|
| Healthcare | 2 | $309B |
|
||
| Insurance | 2 | $27B |
|
||
| Telecommunications / Media | 1 | $124B |
|
||
| Industrial Distribution | 1 | $22B |
|
||
| Financial Services | 1 | $20B |
|
||
| Chemicals / Materials | 1 | $18B |
|
||
Price history
1 event — show timeline
- 2026-05-23 Listed $139,900 BRIGHT MLS
Cash-flow waterfall
monthlySold comps — $/sqft
last 12 mo · ≤1 miLoading sold comps…