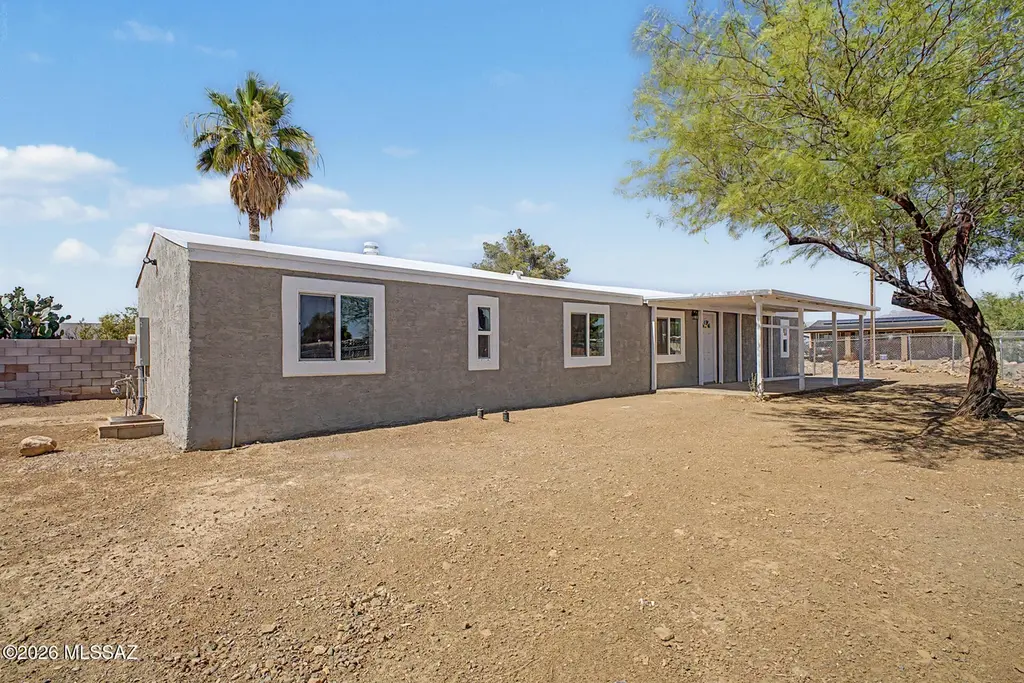
13501 W Warfield Cir · Marana, AZ
Flood risk 6/10 · Moderate
- FEMA flood zone
- AH
- Chance of flooding over 30 yrs
- 0.73%
- Est. flood insurance / yr
- $1,142 – $2,507
Fire risk 6/10 · Moderate
- Est. fire insurance / yr
- $610 – $1,132
Heat risk 8/10 · Major
- Hot days now (above 109°F)
- 7 days/yr
- Hot days in 30 yrs
- 20 days/yr
Wind risk 1/10 · Minimal
- Chance of severe wind over 30 yrs
- —
Air-quality risk 1/10 · Minimal
- Unhealthy air days now
- 0 days/yr
- Unhealthy air days in 30 yrs
- 0 days/yr
Risk factors via First Street. Map © Google.
Why this score? — see what drove the C- grade
The composite is a weighted blend of 9 inputs, each scored 0–100. Each bar is that input's sub-score; the figure is the points it added to the 100-point composite (weight × sub-score).
- Cash flow +24.4/30.0
- DSCR +7.9/10.0
- 1% rule +5.0/10.0
- ARV discount +4.9/15.0
- Livability +3.4/5.0
- Schools +3.1/10.0
- Rent growth +2.5/5.0
- Condition / age +2.5/5.0
- Appreciation +1.1/10.0
$215,000
🖨 Deal sheet (PDF) 📄 Offer letter ✓ Due diligence
Listing remarks
Completely remodeled 3 bed, 2 bath mobile home offering 1,088 sq ft on just under a quarter-acre lot! This move-in ready home features a new roof, new AC, new electric panel, and new hot water heater for peace of mind. Inside, enjoy vaulted ceilings, wood-look flooring, updated lighting, and a bright open great room. The remodeled kitchen showcases white shaker cabinets, granite countertops, and a center island with breakfast bar. Stove, microwave, and dishwasher to be installed prior to close of escrow. Spacious primary suite includes a private bath. Out back, Oversized front and back yards offer plenty of room for entertaining, storage, or future possibilities. Hurry up and check it out!
Key facts
- New hot water heater
- New electric panel
- Vaulted ceilings
Tags
Property features AI
Finance
- HOA & community: Has association; fees paid quarterly; Association lists no additional amenities
Exterior
- Security: Smoke detectors
- Utilities: Water from a company supply; Sewer connected
- Home design: Mobile home; One story; Faces east
- Construction: Stucco and wood-frame construction; Built-up roof
- Exterior features: Covered patio; Patio; Shed(s); Block and chain-link fencing; Paved street; Street lights; East/West exposure; Subdivided lot
Interior
- Flooring: Carpet; Vinyl
- Bathrooms: 2 full bathrooms
- Heating & cooling: Forced-air electric heating; Central air conditioning; Ceiling fans
- Interior features: Kitchen island; Vaulted ceilings
- Laundry & utility: Dedicated laundry room
Neighborhood map
What this means for you Summary
Snapshot
- This is a 3-bed/2.0-bath manufactured listed at $215k.
Deal economics
- At list price, monthly cash flow is $286 ($3k/yr) — positive.
- The deal already cash-flows at list — no discount required.
- To meet the 1% rule (rent ≥ 1% of price), the offer needs to be $215k (0.2% below list).
- Recommended offer: $212k (1.5% below list) — sets the bar for market timing.
- Cap rate 8.7% vs local median 3.3% in Marana — top-decile yield for the area; either an underpriced asset or a hidden risk that comps aren't pricing in. Stress-test before assuming the spread holds.
Location & tenants
- Location reads 67/100 on livability (#67 in AZ) — a middle-class / working-renter tenant base. Strengths: employment A+, housing A+, crime A; Watch: amenities F, commute F, health & safety F.
- Marana Unified District (4404) (suburban): math 31% / reading 37% proficiency, ranked #83 of 249 in AZ (top 33%) — families likely to look elsewhere, expect single-tenant / working-renter base with shorter leases.
- Zoned schools: Marjorie W Estes Elementary School (math 20% / reading 26%, grade F, #673 of 1,109 statewide, top 61%, 570 students, 49% FRL); Marana Middle School (math 24% / reading 30%, grade F, #97 of 218 statewide, top 45%, 907 students, 44% FRL); Marana High School (math 21% / reading 24%, grade F, #210 of 381 statewide, top 55%, 2,379 students, 36% FRL).
- Market conditions: 468 active listings in the ZIP; 5 comparable units currently listed for rent nearby; rentals at typical pace (median 17d on market — plan ~3-4 weeks tenant-placement turnaround); high-income renter base; 5,268 units permitted in Pima County in 2024 (996 in 5+ unit buildings).
Forward outlook
- Local home prices are declining (-3.0%/yr); year-one equity from $1k of loan paydown is wiped out by about $6k of value loss. Plan a longer hold.
- Pima County population projected at +8% by 2050 — modest demand growth; plan on rents tracking national, not racing it.
Negotiation context
- It's been on market 23 days — a 2% lower offer ($212k) is reasonable based on typical stale-listing flexibility.
- Current owner paid $55k; list at $215k implies a 291% gain — meaningful room to come down on a strong offer.
Risks & watch-outs
- Watch-outs: flood insurance adds $152/mo.
- Climate carrying-cost: in FEMA flood zone AH (mandatory federal flood insurance); major wildfire risk; extreme-heat days projected 7→20/yr by 2055 (HVAC capex compounding) — expect insurance premiums to compound above CPI over the hold.
Questions for the listing agent
- What's the actual annual flood-insurance premium (NFIP or private), and is the property in a SFHA with mandatory coverage?
- Is there a deadline driving the sale (1031 exchange, divorce, estate, relocation)? That informs how much negotiation room exists.
- Schools are D-rated, which usually means shorter tenancies and higher turnover. Who's the typical renter profile here, and what's been the actual vacancy rate?
- What's the average days-on-market for RENTAL listings here right now (not sales)? A rising rental-DOM trend means longer vacancies and softer asking-rent achievability than the comps imply.
- What's the recent tenant-quality profile in this submarket — average credit score on applications, eviction rate, late-payment / NSF rate, and stable-employment percentage? A property-management company in the area should have these aggregated.
- How much new for-sale + rental construction is in the pipeline within 1–3 miles? Heavy new supply typically softens prices + rents 12–24 months out; constrained supply supports both.
Investment metrics
- 1% rule
- 1.00% ✗
- Cap rate
- 8.74%
- Cash-on-cash
- 8.73%
- DSCR
- 1.39
- GRM
- 8.4
CMA / ARV
- ARV (on-the-fly)
- $203,456
- Comps found
- 4
Show comp detail 4 sales within ~0.75 mi
| Address | Dist | Beds/Ba | Sqft | Sold | Price | $/sf | Match |
|---|---|---|---|---|---|---|---|
| 13457 N Warfield Cir | 0.19mi | 2/2.0 (-1) | 1,024 (-6%) | 1mo | $193,000 | $188 | 75 |
| 13521 N Warfield Cir | 0.05mi | 3/2.0 | 1,250 (+15%) | 11mo | $210,000 | $168 | 63 |
| 13427 N Warfield Cir | 0.18mi | 3/2.0 | 1,232 (+13%) | 13mo | $229,900 | $187 | 58 |
| 13469 N Warfield Cir | 0.15mi | 3/2.0 | 1,232 (+13%) | 17mo | $210,000 | $170 | 57 |
Match score weights: distance 35% · size 25% · config 20% · recency 20%. Top-matched comps best support the ARV.
Projected returns pro-forma
-3.0% appreciation · 3.0% rent growth · sell at horizon
- IRR
- -7.5%
- Equity multiple
- 0.72×
- Total profit
- $-16,655
- Equity at exit
- $32,057
- IRR
- 2.1%
- Equity multiple
- 1.15×
- Total profit
- $8,872
- Equity at exit
- $18,589
Cash invested: $60,200 (down + closing). Projections, not guarantees.
Landlord ↔ Tenant lean methodology
- Overall (STATE)
- 87 Strongly Landlord-Friendly
- State Arizona
- 87 Strongly Landlord-Friendly · R+3
- County
- — inherits STATE
- City
- — inherits STATE
ZIP-level market 85658
- Home prices YoY
- -2.8%
- Active inventory
- 468
- Price-to-rent
- 8.4×
Monthly cashflow live
- Estimated rent
- $2,146 high interval (Pro) →
- Mortgage (P&I)
- −$1,127
- Tax from tax record
- −$40 /mo · $481/yr
- Insurance
- −$90
- Flood insurance flood zone
- −$152 /mo · $1,824/yr
- HOA
- −$0
- Vacancy / Maint / Mgmt
- −$451
- Net cashflow
- $286
Break-even live
Sensitivity live
| Price | -10% $407 | -5% $347 | +0% $286 | +5% $225 | +10% $164 |
|---|---|---|---|---|---|
| Rent | -10% $116 | -5% $201 | +0% $286 | +5% $370 | +10% $455 |
| Rate | -1.0pp $394 | -0.5pp $340 | base $286 | +0.5pp $230 | +1.0pp $173 |
UW: 25.0% down · 7.5% · 30yr · 1.5% tax · 5.0% vac · 8.0% maint · 8.0% mgmt
Financing live
Cash to close
- Down payment
- $53,750
- Closing costs
- $6,450
- Reserves months
- —
- Total cash needed
- —
Loan-product check · same deal, 3 products live
Conventional
25% down · 7.5% · 30yr
- Down + closing
- —
- Monthly P&I
- —
- Monthly cashflow
- —
- DSCR
- —
- Eligible?
- —
Personal DTI + credit; lowest rate.
DSCR
20% down · 8.5% · 30yr
- Down + closing
- —
- Monthly P&I
- —
- Monthly cashflow
- —
- DSCR
- —
- Eligible?
- —
No personal income docs; deal must DSCR.
Hard money
10% down · 12.0% · 12mo
- Down + closing
- —
- Monthly P&I
- —
- Monthly cashflow
- —
- DSCR
- —
- Eligible?
- —
Short-term bridge; refi at stabilization.
Rent comps 5 comps
| Address | Beds | Baths | Sqft | Rent | $/sqft | DOM | Units | Dist |
|---|---|---|---|---|---|---|---|---|
| 11377 W Folsom Point Dr Marana, AZ | 3.0 | 2.0 | 1389 | $1,800 | $1.30 | 0d | 1 | 1.02mi |
| 11379 W Burning Sage St Marana, AZ | 3.0 | 2.0 | 1265 | $1,795 | $1.42 | 25d | 1 | 1.09mi |
| 14214 N Spear Point Way Marana, AZ | 3.0 | 2.0 | 1389 | $1,855 | $1.34 | 0d | 1 | 1.10mi |
| 11629 W Despain Dr Marana, AZ | 3.0 | 2.0 | 1317 | $1,850 | $1.40 | 45d | 1 | 1.15mi |
| 10518 W Harrigan Dr Marana, AZ | 3.0 | 2.0 | 1262 | $2,000 | $1.58 | 16d | 1 | 1.19mi |
Listing history 26 events
-
2026-06-21days on market $215,000 Active 23 DOM
-
2026-06-18days on market $215,000 Active 20 DOM
-
2026-06-17statusdays on market $215,000 Active 19 DOM
-
2026-06-16days on market $215,000 Active Contingent 18 DOM
-
2026-06-15days on market $215,000 Active Contingent 17 DOM
-
2026-06-13days on market $215,000 Active Contingent 15 DOM
-
2026-06-13statusdays on market $215,000 Active Contingent 14 DOM
-
2026-06-10days on market $215,000 Active 12 DOM
-
2026-06-09days on market $215,000 Active 11 DOM
-
2026-06-08days on market $215,000 Active 10 DOM
-
2026-06-07days on market $215,000 Active 9 DOM
-
2026-06-05days on market $215,000 Active 6 DOM
-
2026-06-03days on market $215,000 Active 5 DOM
-
2026-06-02days on market $215,000 Active 4 DOM
-
2026-06-01days on market $215,000 Active 3 DOM
-
2026-05-31days on market $215,000 Active 2 DOM
-
2026-05-29$215,000 Active
-
2000-03-31soldstatus $55,000
-
2000-03-31soldstatus $55,000
-
2000-02-25soldstatus $47,500
-
1999-02-04soldstatus $55,500
-
1997-03-20soldstatus $45,000
-
1994-10-24soldstatus $49,000
-
1993-01-04soldstatus $19,000
-
1992-01-02soldstatus $19,000
-
1987-03-01soldstatus $15,500
ⓘ Source: listings_history table (triggers on properties + properties_extension) + one-shot
backfill from property_details.listing_events for pre-trigger history.
Tax reassessment forecast AZ · Resets to sale price
- Current annual tax
- $481 · $40/mo
- Projected year-2 tax
- $1,419 · $118/mo
- Expected delta
- +$938/yr (+$78/mo · 194.7%)
ⓘ Screening estimate from a state-policy table — verify with the county assessor before closing.
Climate risk First Street
- Flood 6/10 Major FEMA zone AH · 73% chance over 30 yrs
- Wildfire 6/10 Major
- Heat 8/10 Severe 7 d/yr ≥109°F today · 20 d/yr by 30 yrs out
- Wind 1/10 Low
- Air quality 1/10 Low 0 unhealthy d/yr today · 0 by 30 yrs out
Nearby sold comps map
Loading sold comps map…
Walkable amenities ~0.75 mi
Loading nearby amenities…
Taxation est. · year 1
- Rental income
- $25,746
- − Mortgage interest
- −$12,043
- − Property taxes
- −$481
- − Insurance
- −$2,900
- − Repairs & maintenance
- −$2,060
- − Management
- −$2,060
- − Depreciation
- −$6,255
- Taxable loss
- −$52
- Est. tax savings @ 24.0%
- +$12
- After-tax cash flow
- $3,441/yr
For passive investors: Depreciation is non-cash, so a rental often shows a tax loss while cash-flowing — sheltering income. Rental losses are passive: they offset passive income freely, and up to $25,000/yr can offset ordinary (W-2) income if you actively participate and your MAGI is under $100k (phasing out to $0 by $150k); unused losses carry forward. On sale, claimed depreciation is recaptured at up to 25%, and gains may owe capital-gains tax (a 1031 exchange can defer both). Figures are a year-1 estimate at your 24.0% rate — not tax advice; consult a CPA.
Schools (NCES district)
- District
- Marana Unified District (4404)
- NCES district ID
- 0404630
- Math proficiency
- 31% ▼ -11.00%
- Reading proficiency
- 37% ▼ -5.00%
- Median HH income
- $65,282
- Composite
- 30.96/100
- National rank
- #6103
- State rank
- #83 of 249 in AZ
Livability — Marana
- Score
- 67/100
- State rank
- #67
- US rank
- #11113
Category grades
Schools grade is shown separately in the Schools card above.
Census & demographics
- Census place
- Marana, AZ
- County
- Pima County · 1,012,107 people
- City population
- 39,625
- Metro
- Tucson, AZ
- Population (ZIP)
- 16,051
- Household income
- $123,415
- Rent vs Own
- Severe rent burden
- 147.0
Population outlook (Pima County) Hauer SSP2
- Today (2025)
- 1,066,056 people
- By 2030
- 1,086,684 · +1.9%
- By 2040
- 1,117,160 · +4.8%
- By 2050
- 1,149,778 · +7.9%
- By 2075
- 1,271,480 · +19.3%
- By 2100
- 1,321,160 · +23.9%
Race, ethnicity, and origin ACS 2023
- Neighborhood character
- Predominantly White (71%)
- Race & ethnicity
- White 71% Hispanic / Latino 22% Two or more races 17% Asian 3% Black 1%
- Hispanic origin (detail)
- Mexican 15% Puerto Rican 3%
- Common ancestry
- Romanian 4% Portuguese 3% Slovak 2%
- Foreign-born
- 9% · Canada, China, Vietnam
- Languages at home
- 84% English-only · Spanish 11% Other Indo-European 3% Russian/Polish/Slavic 1%
Political lean MEDSL · Pima
- 2024 margin
- D (+15.2) · D 57.0% · R 41.8% · Other 1.2%
- 2008→2024 swing
- +9.1pp toward D · 2008: 6.1pp · 2024: 15.2pp
- All cycles
- 2024: D+15.2 2020: D+18.7 2016: D+13.5 2012: D+5.8 2008: D+6.1
Not yet ingested
- Civics
- —
Market trends
- HPI YoY
- ▼ -7.72%
- Current HPI
- 272.3729
- Rent YoY
- —
- Metro
- Tucson, AZ
- State GDP YoY
- ▲ 4.54%
- F500 in state
- 20
Industry mix (Fortune 500 HQ in AZ)
| Industry | F500 HQs | Revenue |
|---|---|---|
| Technology | 2 | $13B |
|
||
| Mining / Metals | 1 | $23B |
|
||
| Environmental Services | 1 | $16B |
|
||
| Metals / Steel | 1 | $14B |
|
||
| Technology Distribution | 1 | $9B |
|
||
| Homebuilding | 1 | $8B |
|
||
Price history
+1287.1% since first listed10 events — show timeline
- 2026-05-29 Listed $215,000 MLSSAZ
- 2000-03-31 Sold (Public Records) $55,000 Public Records
- 2000-03-31 Sold (Public Records) $55,000 Public Records
- 2000-02-25 Sold (Public Records) $47,500 Public Records
- 1999-02-04 Sold (Public Records) $55,500 Public Records
- 1997-03-20 Sold (Public Records) $45,000 Public Records
- 1994-10-24 Sold (Public Records) $49,000 Public Records
- 1993-01-04 Sold (Public Records) $19,000 Public Records
- 1992-01-02 Sold (Public Records) $19,000 Public Records
- 1987-03-01 Sold (Public Records) $15,500 Public Records
Property tax history
-2.2%/yrLatest (2025): $481 · +4.7% YoY. Source: county tax records.
Cash-flow waterfall
monthlySold comps — $/sqft
last 12 mo · ≤1 miLoading sold comps…