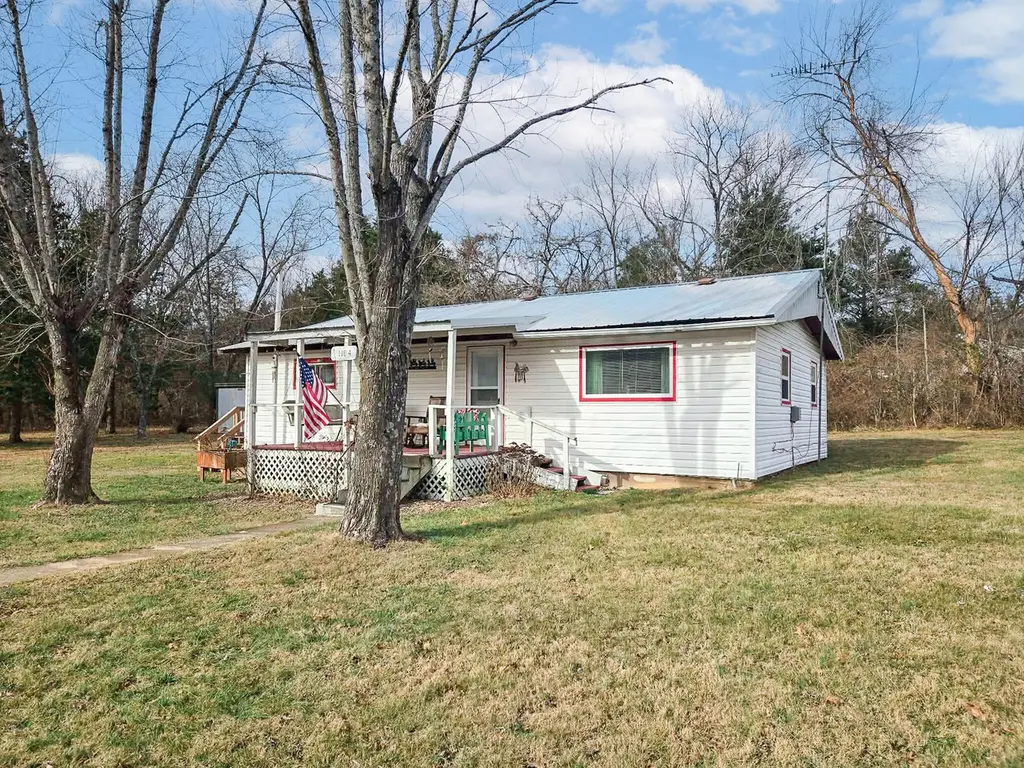
1104 Highland St · Cabool, MO
Flood risk 7/10 · Major
- FEMA flood zone
- X
- Chance of flooding over 30 yrs
- 0.99%
- Est. flood insurance / yr
- $507 – $1,088
Fire risk 4/10 · Minor
- Est. fire insurance / yr
- $1,054 – $1,958
Heat risk 4/10 · Minor
- Hot days now (above 105°F)
- 7 days/yr
- Hot days in 30 yrs
- 19 days/yr
Wind risk 2/10 · Minimal
- Chance of severe wind over 30 yrs
- 1.0%
Air-quality risk 1/10 · Minimal
- Unhealthy air days now
- 0 days/yr
- Unhealthy air days in 30 yrs
- 0 days/yr
Risk factors via First Street. Map © Google.
Why this score? — see what drove the D+ grade
The composite is a weighted blend of 9 inputs, each scored 0–100. Each bar is that input's sub-score; the figure is the points it added to the 100-point composite (weight × sub-score).
- Cash flow +12.2/30.0
- Appreciation +9.7/10.0
- ARV discount +8.6/15.0
- DSCR +3.6/10.0
- Livability +3.4/5.0
- Rent growth +2.5/5.0
- Schools +2.5/10.0
- Condition / age +2.5/5.0
- 1% rule +2.2/10.0
$120,000
🖨 Deal sheet (PDF) 📄 Offer letter ✓ Due diligence
Listing remarks MLS
Welcome to this absolutely adorable, fully remodeled charmer nestled in a well-established neighborhood. From the moment you arrive, you'll be drawn in by the inviting front porch. Inside, beautiful wood accents throughout the home create a warm, welcoming atmosphere and add just the right touch of character. The living areas feel cozy yet functional, with a layout designed to make the most of every space--perfect for relaxing evenings or hosting friends and family. The kitchen is both charming and practical, offering a comfortable flow that makes daily living easy and enjoyable. This home features two nicely sized bedrooms, along with a beautifully updated bathroom. Natural light fills the home, enhancing its warm finishes and creating an inviting feel throughout. Step outside to enjoy a nice level lot with plenty of space to unwind, garden, or entertain. The cozy front porch is the perfect spot for morning coffee or quiet evenings, while the detached garage and storage shed provide excellent space for tools, hobbies, or additional storage. This move-in-ready home is full of charm, warmth, storage space, and thoughtful updates
Key facts
- Fully remodeled
- Inviting front porch
- Level lot
Tags
Neighborhood map
What this means for you Summary
Snapshot
- This is a 2-bed/1.0-bath other listed at $120k.
Deal economics
- At list price, monthly cash flow is $-92 ($-1k/yr) — negative.
- To cash-flow at today's rent, offer at most $104k (13.5% below list).
- To meet the 1% rule (rent ≥ 1% of price), the offer needs to be $87k (27.7% below list).
- Recommended offer: $87k (27.7% below list) — sets the bar for 1% rule.
- Cap rate 6.0% vs local median 3.0% in Cabool — top-decile yield for the area; either an underpriced asset or a hidden risk that comps aren't pricing in. Stress-test before assuming the spread holds.
Location & tenants
- Location reads 67/100 on livability (#218 in MO) — a middle-class / working-renter tenant base. Strengths: cost of living A+, crime A, housing A-; Watch: amenities F, commute F, employment F.
- Cabool R-IV (rural): math 22% / reading 39% proficiency, ranked #275 of 324 in MO (top 85%) — families likely to look elsewhere, expect single-tenant / working-renter base with shorter leases.
- Zoned schools: Cabool Elem. (math 27% / reading 37%, grade F, #761 of 1,115 statewide, top 72%, 340 students, 98% FRL); Cabool Middle (math 21% / reading 40%, grade F, #283 of 391 statewide, top 74%, 222 students, 100% FRL); Cabool High (math 15% / reading 34%, grade F, #436 of 521 statewide, top 85%, 207 students, 100% FRL) — zoned schools average 99% FRL vs 57% district-wide (42 pts higher); higher-poverty schools than district average — tighter screening recommended.
- Market conditions: 63 active listings in the ZIP; 10 units permitted in Texas County in 2024 (5 in 5+ unit buildings).
Forward outlook
- In year one you build about $12k of equity ($830 loan paydown + $11k appreciation (9.5% local appreciation)).
- Texas County population projected at -11% by 2050 — secular population decline; favor cash flow + early exit over multi-decade hold.
- By year 3, paydown + projected appreciation supports a ~$31k cash-out refi (75% LTV) — recoverable capital for the next deal without selling this one.
Negotiation context
- It's been on market 154 days — a 12% lower offer ($106k) is reasonable based on typical stale-listing flexibility.
Risks & watch-outs
- Watch-outs: flood insurance adds $66/mo.
- Climate carrying-cost: major flood risk — expect insurance premiums to compound above CPI over the hold.
Questions for the listing agent
- What do current leases actually rent for vs. the listed asking? Can we see a recent rent roll and the last 12 months of T-12 income?
- It's been on market 154 days. Have you received any prior offers? Is the seller open to a 28% concession, seller financing, or rate buy-down credit?
- What's the actual annual flood-insurance premium (NFIP or private), and is the property in a SFHA with mandatory coverage?
- Why hasn't it sold? Are there any deal-killer items the seller is aware of (foundation, flood, title, zoning, code violations)?
- Is there a deadline driving the sale (1031 exchange, divorce, estate, relocation)? That informs how much negotiation room exists.
- Schools are D-rated, which usually means shorter tenancies and higher turnover. Who's the typical renter profile here, and what's been the actual vacancy rate?
- The area grade is low — what's the realistic commute time and amenity access for the typical tenant pool here? Any planned neighborhood developments (good or bad) we should know about?
- What's the average days-on-market for RENTAL listings here right now (not sales)? A rising rental-DOM trend means longer vacancies and softer asking-rent achievability than the comps imply.
- What's the recent tenant-quality profile in this submarket — average credit score on applications, eviction rate, late-payment / NSF rate, and stable-employment percentage? A property-management company in the area should have these aggregated.
- How much new for-sale + rental construction is in the pipeline within 1–3 miles? Heavy new supply typically softens prices + rents 12–24 months out; constrained supply supports both.
Investment metrics
- 1% rule
- 0.72% ✗
- Cap rate
- 6.04%
- Cash-on-cash
- -0.90%
- DSCR
- 0.96
- GRM
- 11.5
CMA / ARV
- ARV (median comp)
- $122,900
- List price
- $120,000
- Delta
- -2.36%
- Verdict
- FAIR
- Comps
- 20 within 1.0 mi
Projected returns pro-forma
9.46% appreciation · 3.0% rent growth · sell at horizon
- IRR
- 20.8%
- Equity multiple
- 2.64×
- Total profit
- $55,091
- Equity at exit
- $103,410
- IRR
- 18.9%
- Equity multiple
- 5.93×
- Total profit
- $165,737
- Equity at exit
- $218,193
Cash invested: $33,600 (down + closing). Projections, not guarantees.
Landlord ↔ Tenant lean methodology
- Overall (STATE)
- 81 Strongly Landlord-Friendly
- State Missouri
- 81 Strongly Landlord-Friendly · R+10
- County
- — inherits STATE
- City
- — inherits STATE
ZIP-level market 65689
- Home prices YoY
- 4.2%
- Active inventory
- 63
- Price-to-rent
- 11.5×
Monthly cashflow live
- Estimated rent
- $868 medium interval (Pro) →
- Mortgage (P&I)
- −$629
- Tax from tax record
- −$32 /mo · $379/yr
- Insurance
- −$50
- Flood insurance flood zone
- −$66 /mo · $798/yr
- HOA
- −$0
- Vacancy / Maint / Mgmt
- −$182
- Net cashflow
- $-92
Break-even live
Sensitivity live
| Price | -10% $-24 | -5% $-58 | +0% $-92 | +5% $-126 | +10% $-159 |
|---|---|---|---|---|---|
| Rent | -10% $-160 | -5% $-126 | +0% $-92 | +5% $-57 | +10% $-23 |
| Rate | -1.0pp $-31 | -0.5pp $-61 | base $-92 | +0.5pp $-123 | +1.0pp $-154 |
UW: 25.0% down · 7.5% · 30yr · 1.5% tax · 5.0% vac · 8.0% maint · 8.0% mgmt
Financing live
Cash to close
- Down payment
- $30,000
- Closing costs
- $3,600
- Reserves months
- —
- Total cash needed
- —
Loan-product check · same deal, 3 products live
Conventional
25% down · 7.5% · 30yr
- Down + closing
- —
- Monthly P&I
- —
- Monthly cashflow
- —
- DSCR
- —
- Eligible?
- —
Personal DTI + credit; lowest rate.
DSCR
20% down · 8.5% · 30yr
- Down + closing
- —
- Monthly P&I
- —
- Monthly cashflow
- —
- DSCR
- —
- Eligible?
- —
No personal income docs; deal must DSCR.
Hard money
10% down · 12.0% · 12mo
- Down + closing
- —
- Monthly P&I
- —
- Monthly cashflow
- —
- DSCR
- —
- Eligible?
- —
Short-term bridge; refi at stabilization.
Listing history 10 events
-
2026-06-12statusdays on market $120,000 Pending 154 DOM
-
2026-06-09days on market $120,000 Active 152 DOM
-
2026-06-08days on market $120,000 Active 151 DOM
-
2026-06-07days on market $120,000 Active 150 DOM
-
2026-06-07days on market $120,000 Active 149 DOM
-
2026-06-04days on market $120,000 Active 146 DOM
-
2026-06-02days on market $120,000 Active 145 DOM
-
2026-06-01days on market $120,000 Active 144 DOM
-
2026-05-31days on market $120,000 Active 143 DOM
-
2026-01-08$134,900 Active 1145-char remark
Show marketing remark (1145 chars)
Welcome to this absolutely adorable, fully remodeled charmer nestled in a well-established neighborhood. From the moment you arrive, you'll be drawn in by the inviting front porch. Inside, beautiful wood accents throughout the home create a warm, welcoming atmosphere and add just the right touch of character. The living areas feel cozy yet functional, with a layout designed to make the most of every space--perfect for relaxing evenings or hosting friends and family. The kitchen is both charming and practical, offering a comfortable flow that makes daily living easy and enjoyable. This home features two nicely sized bedrooms, along with a beautifully updated bathroom. Natural light fills the home, enhancing its warm finishes and creating an inviting feel throughout. Step outside to enjoy a nice level lot with plenty of space to unwind, garden, or entertain. The cozy front porch is the perfect spot for morning coffee or quiet evenings, while the detached garage and storage shed provide excellent space for tools, hobbies, or additional storage. This move-in-ready home is full of charm, warmth, storage space, and thoughtful updates
ⓘ Source: listings_history table (triggers on properties + properties_extension) + one-shot
backfill from property_details.listing_events for pre-trigger history.
Tax reassessment forecast MO · Resets to sale price
- Current annual tax
- $379 · $32/mo
- Projected year-2 tax
- $1,164 · $97/mo
- Expected delta
- +$785/yr (+$65/mo · 207.0%)
ⓘ Screening estimate from a state-policy table — verify with the county assessor before closing.
Climate risk First Street
- Flood 7/10 Severe FEMA zone X · 99% chance over 30 yrs
- Wildfire 4/10 Moderate
- Heat 4/10 Moderate 7 d/yr ≥105°F today · 19 d/yr by 30 yrs out
- Wind 2/10 Low 100% chance of damaging wind over 30 yrs
- Air quality 1/10 Low 0 unhealthy d/yr today · 0 by 30 yrs out
Nearby sold comps map
Loading sold comps map…
Walkable amenities ~0.75 mi
Loading nearby amenities…
Taxation est. · year 1
- Rental income
- $10,417
- − Mortgage interest
- −$6,722
- − Property taxes
- −$379
- − Insurance
- −$1,398
- − Repairs & maintenance
- −$833
- − Management
- −$833
- − Depreciation
- −$3,491
- Taxable loss
- −$3,239
- Est. tax savings @ 24.0%
- +$777
- After-tax cash flow
- $-321/yr
For passive investors: Depreciation is non-cash, so a rental often shows a tax loss while cash-flowing — sheltering income. Rental losses are passive: they offset passive income freely, and up to $25,000/yr can offset ordinary (W-2) income if you actively participate and your MAGI is under $100k (phasing out to $0 by $150k); unused losses carry forward. On sale, claimed depreciation is recaptured at up to 25%, and gains may owe capital-gains tax (a 1031 exchange can defer both). Figures are a year-1 estimate at your 24.0% rate — not tax advice; consult a CPA.
Schools (NCES district)
- District
- Cabool R-IV
- NCES district ID
- 2906430
- Math proficiency
- 22% ▼ -7.00%
- Reading proficiency
- 39% ▲ 1.00%
- Median HH income
- $32,537
- Composite
- 24.88/100
- National rank
- #7584
- State rank
- #275 of 324 in MO
Livability — Cabool
- Score
- 67/100
- State rank
- #218
- US rank
- #10822
Category grades
Schools grade is shown separately in the Schools card above.
Census & demographics
- Census place
- Cabool, MO
- City population
- 4,273
- Population (ZIP)
- 4,273
Population outlook (Texas County) Hauer SSP2
- Today (2025)
- 24,648 people
- By 2030
- 23,981 · -2.7%
- By 2040
- 22,840 · -7.3%
- By 2050
- 21,832 · -11.4%
- By 2075
- 19,481 · -21.0%
- By 2100
- 16,634 · -32.5%
Race, ethnicity, and origin ACS 2023
- Neighborhood character
- Predominantly White (86%)
- Race & ethnicity
- White 86% Two or more races 7% Hispanic / Latino 4% Asian 2%
- Common ancestry
- Romanian 4% Iranian 2% Lithuanian 1%
- Foreign-born
- 2% · Canada
- Languages at home
- 97% English-only · Spanish 3%
Political lean MEDSL · Texas
- 2024 margin
- Solid R (+71.7) · D 13.8% · R 85.5%
- 2008→2024 swing
- -36.7pp toward R · 2008: -35.1pp · 2024: -71.7pp
- All cycles
- 2024: R+71.7 2020: R+68.6 2016: R+65.4 2012: R+44.1 2008: R+35.1
Not yet ingested
- Civics
- —
Market trends
- HPI YoY
- ▲ 9.46%
- Current HPI
- 232.9575
- Rent YoY
- —
- Metro
- —
- State GDP YoY
- ▲ 1.84%
- F500 in state
- 20
Industry mix (Fortune 500 HQ in MO)
| Industry | F500 HQs | Revenue |
|---|---|---|
| Healthcare | 1 | $163B |
|
||
| Insurance | 1 | $21B |
|
||
| Industrial Technology | 1 | $17B |
|
||
| Retail | 1 | $16B |
|
||
| Industrial Distribution | 1 | $10B |
|
||
| Utilities | 1 | $9B |
|
||
Price history
1 event — show timeline
- 2026-01-08 Listed $134,900 SOMO
Property tax history
+6.5%/yrLatest (2025): $379 · +1.5% YoY. Source: county tax records.
Cash-flow waterfall
monthlySold comps — $/sqft
last 12 mo · ≤1 miLoading sold comps…