 🏗️ New Construction
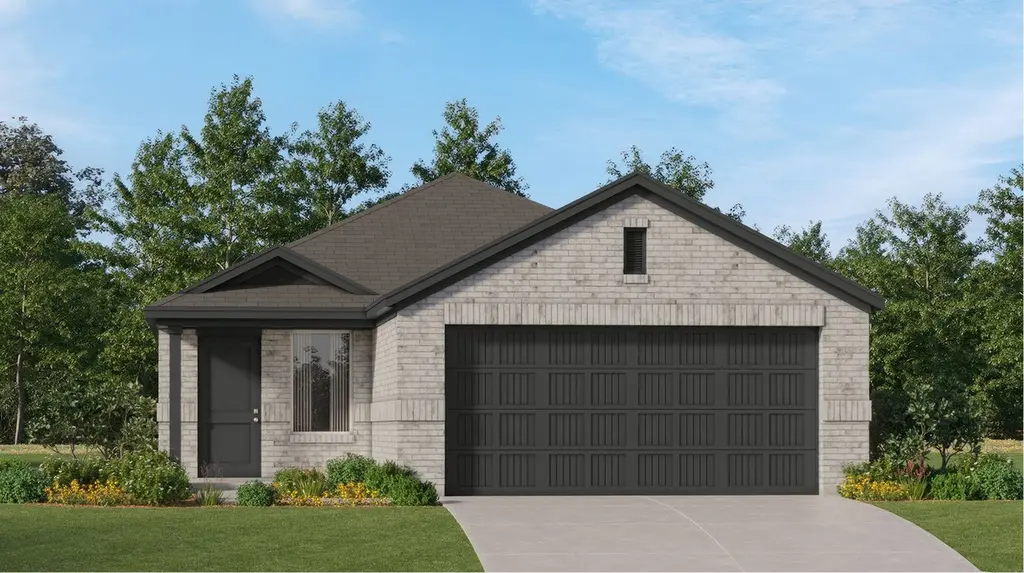
Pinehollow Plan · The Woodlands, TX
Flood risk No data
- FEMA flood zone
- —
- Chance of flooding over 30 yrs
- —
- Est. flood insurance / yr
- —
Fire risk No data
- Est. fire insurance / yr
- —
Heat risk No data
- Hot days now (above threshold)
- —
- Hot days in 30 yrs
- —
Wind risk No data
- Chance of severe wind over 30 yrs
- —
Air-quality risk No data
- Unhealthy air days now
- —
- Unhealthy air days in 30 yrs
- —
Risk factors via First Street. Map © Google.
Why this score? — see what drove the C grade
The composite is a weighted blend of 9 inputs, each scored 0–100. Each bar is that input's sub-score; the figure is the points it added to the 100-point composite (weight × sub-score).
- Cash flow +16.2/30.0
- Appreciation +10.0/10.0
- ARV discount +7.5/15.0
- DSCR +5.0/10.0
- Livability +4.5/5.0
- 1% rule +4.4/10.0
- Condition / age +4.0/5.0
- Schools +3.9/10.0
- Rent growth +2.6/5.0
$282,990
🖨 Deal sheet 📄 Offer letter ✓ Due diligence
Listing remarks MLS
This single-level home showcases a spacious open floorplan shared between the kitchen, dining area and family room for easy entertaining. An owner's suite enjoys a private location in a rear corner of the home, complemented by an en-suite bathroom and walk-in closet. There are three secondary bedrooms along the side of the home, which are comfortable spaces for household members and overnight guests.
Key facts
- Walk-in closet
- Open floorplan
- Secondary bedrooms
Tags
Neighborhood map
What this means for you Summary
Snapshot
- This is a 4-bed/2.0-bath single-family listed at $283k. Condition is rated good.
Deal economics
- At list price, monthly cash flow is $144 ($2k/yr) — positive.
- The deal already cash-flows at list — no discount required.
- To meet the 1% rule (rent ≥ 1% of price), the offer needs to be $252k (11.0% below list).
- Recommended offer: $249k (12.0% below list) — sets the bar for market timing.
- Cap rate 6.9% vs local median 2.3% in The Woodlands — top-decile yield for the area; either an underpriced asset or a hidden risk that comps aren't pricing in. Stress-test before assuming the spread holds.
Location & tenants
- Location reads 91/100 on livability (#1 in TX, #47 nationally) — a professional / high-income tenant draw. Strengths: schools A+, amenities A+, commute A+; Watch: cost of living D-.
- Magnolia ISD (rural): math 42% / reading 45% proficiency, ranked #247 of 826 in TX (top 30%) — families likely to look elsewhere, expect single-tenant / working-renter base with shorter leases.
- Market conditions: Rents flat; 1604 active listings in the ZIP; 2 comparable units currently listed for rent nearby; high-income renter base; 13,259 units permitted in Montgomery County in 2024 (1,402 in 5+ unit buildings).
Forward outlook
- In year one you build about $29k of equity ($2k loan paydown + $27k appreciation (10.0% local appreciation)).
- Montgomery County population projected at +65% by 2050 — long-run rental-demand tailwind backs the buy-and-hold thesis.
- At projected returns (10.0% appreciation + 0.3% rent growth), your $75k cash investment doubles in ~3 years — after that, you're playing with house money.
- By year 2, paydown + projected appreciation supports a ~$46k cash-out refi (75% LTV) — recoverable capital for the next deal without selling this one.
Negotiation context
- It's been on market 379 days — a 12% lower offer ($249k) is reasonable based on typical stale-listing flexibility.
Questions for the listing agent
- It's been on market 379 days. Have you received any prior offers? Is the seller open to a 12% concession, seller financing, or rate buy-down credit?
- Why hasn't it sold? Are there any deal-killer items the seller is aware of (foundation, flood, title, zoning, code violations)?
- Is there a deadline driving the sale (1031 exchange, divorce, estate, relocation)? That informs how much negotiation room exists.
- Schools are A-rated — typically a magnet for longer-tenancy family renters. What's the average tenant stay here, and is there a school-zone premium baked into asking?
- What's the average days-on-market for RENTAL listings here right now (not sales)? A rising rental-DOM trend means longer vacancies and softer asking-rent achievability than the comps imply.
- What's the recent tenant-quality profile in this submarket — average credit score on applications, eviction rate, late-payment / NSF rate, and stable-employment percentage? A property-management company in the area should have these aggregated.
- How much new for-sale + rental construction is in the pipeline within 1–3 miles? Heavy new supply typically softens prices + rents 12–24 months out; constrained supply supports both.
Investment metrics
- 1% rule
- 0.94% ✗
- Cap rate
- 6.94%
- Cash-on-cash
- 2.31%
- DSCR
- 1.10
- GRM
- 8.8
CMA / ARV
- ARV (median comp)
- $267,014
- List price
- $282,990
- Delta
- 5.98%
- Verdict
- FAIR
- Comps
- 20 within 1.0 mi
Show comp detail 12 sales within ~0.75 mi
| Address | Dist | Beds/Ba | Sqft | Sold | Price | $/sf | Match |
|---|---|---|---|---|---|---|---|
| 11998 Noble Wood Village Dr | 0.43mi | 4/2.0 | 1,607 (0%) | 1mo | $232,040 | $144 | 79 |
| 11681 Lazy Oak Creek Dr | 0.37mi | 3/2.0 (-1) | 1,635 (+2%) | 0mo | $266,990 | $163 | 75 |
| 11677 Lazy Oak Creek Dr | 0.38mi | 3/2.0 (-1) | 1,572 (-2%) | 0mo | $256,990 | $163 | 74 |
| 11716 Lazy Oak Creek Dr | 0.64mi | 4/2.0 | 1,655 (+3%) | 1mo | $238,990 | $144 | 64 |
| 29961 Stony Forest Dr | 0.52mi | 3/2.5 (-1) | 1,722 (+7%) | 1mo | $349,900 | $203 | 56 |
| 12010 Noble Wood Village Dr | 0.41mi | 3/2.0 (-1) | 1,409 (-12%) | 1mo | $213,040 | $151 | 54 |
| 11708 Lazy Oak Creek Dr | 0.55mi | 3/2.0 (-1) | 1,749 (+9%) | 1mo | $279,990 | $160 | 54 |
| 11995 Noble Wood Village Dr | 0.45mi | 3/2.0 (-1) | 1,418 (-12%) | 1mo | $215,340 | $152 | 54 |
| 11990 Noble Wood Village Dr | 0.44mi | 3/2.0 (-1) | 1,409 (-12%) | 1mo | $224,990 | $160 | 53 |
| 29934 Stony Forest Dr | 0.60mi | 4/3.0 | 1,785 (+11%) | 1mo | $314,900 | $176 | 49 |
| 12039 Noble Wood Village Dr | 0.65mi | 3/2.0 (-1) | 1,418 (-12%) | 0mo | $223,590 | $158 | 45 |
| 11986 Noble Wood Village Dr | 0.65mi | 3/2.0 (-1) | 1,418 (-12%) | 1mo | $222,440 | $157 | 44 |
Match score weights: distance 35% · size 25% · config 20% · recency 20%. Top-matched comps best support the ARV.
Projected returns pro-forma
10.0% appreciation · 0.32% rent growth · sell at horizon
- IRR
- 25.0%
- Equity multiple
- 2.98×
- Total profit
- $148,005
- Equity at exit
- $240,548
- IRR
- 21.4%
- Equity multiple
- 6.57×
- Total profit
- $416,724
- Equity at exit
- $518,750
Cash invested: $74,764 (down + closing). Projections, not guarantees.
Landlord ↔ Tenant lean methodology
- Overall (STATE)
- 87 Strongly Landlord-Friendly
- State Texas
- 87 Strongly Landlord-Friendly · R+5
- County
- — inherits STATE
- City
- — inherits STATE
ZIP-level market 77354
- Home prices YoY
- 2.4%
- Rents YoY
- 0.3%
- Active inventory
- 1604
- Price-to-rent
- 9.4×
Monthly cashflow live
- Estimated rent
- $2,518 medium interval (Pro) →
- Mortgage (P&I)
- −$1,400
- Tax est. 1.5%
- −$334 /mo · $4,005/yr
- Insurance
- −$111
- HOA
- −$0
- Vacancy / Maint / Mgmt
- −$529
- Net cashflow
- $144
Break-even live
UW: 25.0% down · 7.5% · 30yr · 1.5% tax · 5.0% vac · 8.0% maint · 8.0% mgmt
Financing live
Cash to close
- Down payment
- $66,754
- Closing costs
- $8,010
- Reserves months
- —
- Total cash needed
- —
Loan-product check · same deal, 3 products live
Conventional
25% down · 7.5% · 30yr
- Down + closing
- —
- Monthly P&I
- —
- Monthly cashflow
- —
- DSCR
- —
- Eligible?
- —
Personal DTI + credit; lowest rate.
DSCR
20% down · 8.5% · 30yr
- Down + closing
- —
- Monthly P&I
- —
- Monthly cashflow
- —
- DSCR
- —
- Eligible?
- —
No personal income docs; deal must DSCR.
Hard money
10% down · 12.0% · 12mo
- Down + closing
- —
- Monthly P&I
- —
- Monthly cashflow
- —
- DSCR
- —
- Eligible?
- —
Short-term bridge; refi at stabilization.
Rent comps 2 comps
| Address | Beds | Baths | Sqft | Rent | $/sqft | DOM | Units | Dist |
|---|---|---|---|---|---|---|---|---|
| 30314 Ruby Forest Ct Magnolia, TX | 3.0 | 2.0 | 1650 | $2,595 | $1.57 | 43d | 1 | 0.46mi |
| 12035 Noble Wood Village DR Magnolia, TX | 4.0 | 2.5 | 1979 | $2,150 | $1.09 | 43d | 1 | 0.65mi |
Listing history 14 events
-
2026-06-18days on market $282,990 Active 379 DOM
-
2026-06-17days on market $282,990 Active 378 DOM
-
2026-06-16days on market $282,990 Active 377 DOM
-
2026-06-15days on market $282,990 Active 376 DOM
-
2026-06-13days on market $282,990 Active 374 DOM
-
2026-06-09days on market $282,990 Active 370 DOM
-
2026-06-08days on market $282,990 Active 369 DOM
-
2026-06-07days on market $282,990 Active 368 DOM
-
2026-06-04days on market $282,990 Active 365 DOM
-
2026-06-03days on market $282,990 Active 364 DOM
-
2026-06-02days on market $282,990 Active 363 DOM
-
2026-06-01days on market $282,990 Active 362 DOM
-
2026-05-31days on market $282,990 Active 361 DOM
-
2025-06-04$282,990 Active 403-char remark
Show marketing remark (403 chars)
This single-level home showcases a spacious open floorplan shared between the kitchen, dining area and family room for easy entertaining. An owner's suite enjoys a private location in a rear corner of the home, complemented by an en-suite bathroom and walk-in closet. There are three secondary bedrooms along the side of the home, which are comfortable spaces for household members and overnight guests.
ⓘ Source: listings_history table (triggers on properties + properties_extension) + one-shot
backfill from property_details.listing_events for pre-trigger history.
Nearby sold comps map
Loading sold comps map…
Walkable amenities ~0.75 mi
Loading nearby amenities…
Taxation est. · year 1
- Rental income
- $30,213
- − Mortgage interest
- −$14,957
- − Property taxes
- −$4,005
- − Insurance
- −$1,335
- − Repairs & maintenance
- −$2,417
- − Management
- −$2,417
- − Depreciation
- −$7,768
- Taxable loss
- −$2,686
- Est. tax savings @ 24.0%
- +$645
- After-tax cash flow
- $2,370/yr
For passive investors: Depreciation is non-cash, so a rental often shows a tax loss while cash-flowing — sheltering income. Rental losses are passive: they offset passive income freely, and up to $25,000/yr can offset ordinary (W-2) income if you actively participate and your MAGI is under $100k (phasing out to $0 by $150k); unused losses carry forward. On sale, claimed depreciation is recaptured at up to 25%, and gains may owe capital-gains tax (a 1031 exchange can defer both). Figures are a year-1 estimate at your 24.0% rate — not tax advice; consult a CPA.
Condition & rehab AI · 12 photos
This single-family home in The Woodlands, TX, is in good condition with a good condition score of 80. It offers a spacious open floorplan and modern finishes. The property is move-in ready with minor cosmetic updates that can further enhance its value.
Value-add opportunities
- Both Painting exterior and interior walls — Fresh paint can enhance curb appeal and interior aesthetics.
- Both Landscaping improvements — Enhanced landscaping can increase curb appeal and property value.
- Both Add smart home features — Smart home features can increase property value and attract tech-savvy buyers/tenants.
- Both Upgrade kitchen appliances — Modern appliances can improve functionality and attract more buyers/tenants.
- Both Add a smart thermostat — A smart thermostat can improve energy efficiency and attract eco-conscious buyers/tenants.
Renovation cost estimate screening
Value-add ROI direction
- Both Painting exterior and interior walls — Fresh paint can enhance curb appeal and interior aesthetics. ↑
- Both Landscaping improvements — Enhanced landscaping can increase curb appeal and property value. ↑
- Both Add smart home features — Smart home features can increase property value and attract tech-savvy buyers/tenants. ↑
- Both Upgrade kitchen appliances — Modern appliances can improve functionality and attract more buyers/tenants. ↑
- Both Add a smart thermostat — A smart thermostat can improve energy efficiency and attract eco-conscious buyers/tenants. ↑
ⓘ Cost ranges are severity-bucket heuristics (US national rule-of-thumb). Get contractor quotes + a written scope before underwriting a rehab budget.
Schools (NCES district)
- District
- Magnolia ISD
- NCES district ID
- 4828740
- Math proficiency
- 42% ▼ -7.00%
- Reading proficiency
- 45% ▼ -4.00%
- Median HH income
- $71,692
- Composite
- 39.46/100
- National rank
- #3958
- State rank
- #247 of 826 in TX
Livability — The Woodlands
- Score
- 91/100
- State rank
- #1
- US rank
- #47
Category grades
Schools grade is shown separately in the Schools card above.
Census & demographics
- County
- Montgomery County · 663,713 people
- City population
- 106,505
- Metro
- Houston-The Woodlands-Sugar Land, TX
- Population (ZIP)
- 44,900
- Household income
- $112,504
- Rent vs Own
- Severe rent burden
- 586.0
Population outlook (Montgomery County) Hauer SSP2
- Today (2025)
- 713,896 people
- By 2030
- 805,263 · +12.8%
- By 2040
- 992,708 · +39.1%
- By 2050
- 1,179,590 · +65.2%
- By 2075
- 1,628,084 · +128.1%
- By 2100
- 1,937,880 · +171.5%
Race, ethnicity, and origin ACS 2023
- Neighborhood character
- Predominantly White (66%)
- Race & ethnicity
- White 66% Hispanic / Latino 25% Two or more races 18% Black 3% Asian 1%
- Hispanic origin (detail)
- Mexican 14% Puerto Rican 1%
- Common ancestry
- Lithuanian 4% Slovak 2% Italian 2%
- Foreign-born
- 11% · Canada, Vietnam
- Languages at home
- 83% English-only · Spanish 15% Other Indo-European 1% German/W. Germanic 1%
Political lean MEDSL · Montgomery
- 2024 margin
- Solid R (+45.5) · D 26.8% · R 72.3%
- 2008→2024 swing
- +7.2pp toward D · 2008: -52.7pp · 2024: -45.5pp
- All cycles
- 2024: R+45.5 2020: R+43.8 2016: R+51.4 2012: R+60.7 2008: R+52.7
Not yet ingested
- Civics
- —
Market trends
- HPI YoY
- ▲ 12.09%
- Current HPI
- 512.87
- Rent YoY
- ▲ 0.32%
- Metro
- Houston-The Woodlands-Sugar Land, TX
- State GDP YoY
- ▲ 3.95%
- F500 in state
- 110
Industry mix (Fortune 500 HQ in TX)
| Industry | F500 HQs | Revenue |
|---|---|---|
| Energy | 16 | $1,198B |
|
||
| Technology | 5 | $198B |
|
||
| Engineering / Construction | 4 | $72B |
|
||
| Energy Services | 3 | $60B |
|
||
| Utilities | 3 | $41B |
|
||
| Healthcare | 2 | $330B |
|
||
Price history
1 event — show timeline
- 2025-06-04 Listed $282,990 Zillow
Cash-flow waterfall
monthlySold comps — $/sqft
last 12 mo · ≤1 miLoading sold comps…