11-3290 Mokuna St · Royal Hawaiian Estates, HI
Flood risk 1/10 · Minimal
- FEMA flood zone
- X (unshaded)
- Chance of flooding over 30 yrs
- 0.0%
- Est. flood insurance / yr
- $507 – $1,088
Fire risk No data
- Est. fire insurance / yr
- —
Heat risk No data
- Hot days now (above threshold)
- —
- Hot days in 30 yrs
- —
Wind risk No data
- Chance of severe wind over 30 yrs
- —
Air-quality risk 1/10 · Minimal
- Unhealthy air days now
- —
- Unhealthy air days in 30 yrs
- —
Risk factors via First Street. Map © Google.
Why this score? — see what drove the D- grade
The composite is a weighted blend of 9 inputs, each scored 0–100. Each bar is that input's sub-score; the figure is the points it added to the 100-point composite (weight × sub-score).
- ARV discount +11.5/15.0
- Cash flow +5.8/30.0
- Appreciation +5.3/10.0
- Schools +3.7/10.0
- Rent growth +2.5/5.0
- Livability +2.5/5.0
- Condition / age +2.5/5.0
- 1% rule +1.2/10.0
- DSCR +0.1/10.0
$369,000
🖨 Deal sheet 📄 Offer letter ✓ Due diligence
Listing remarks MLS
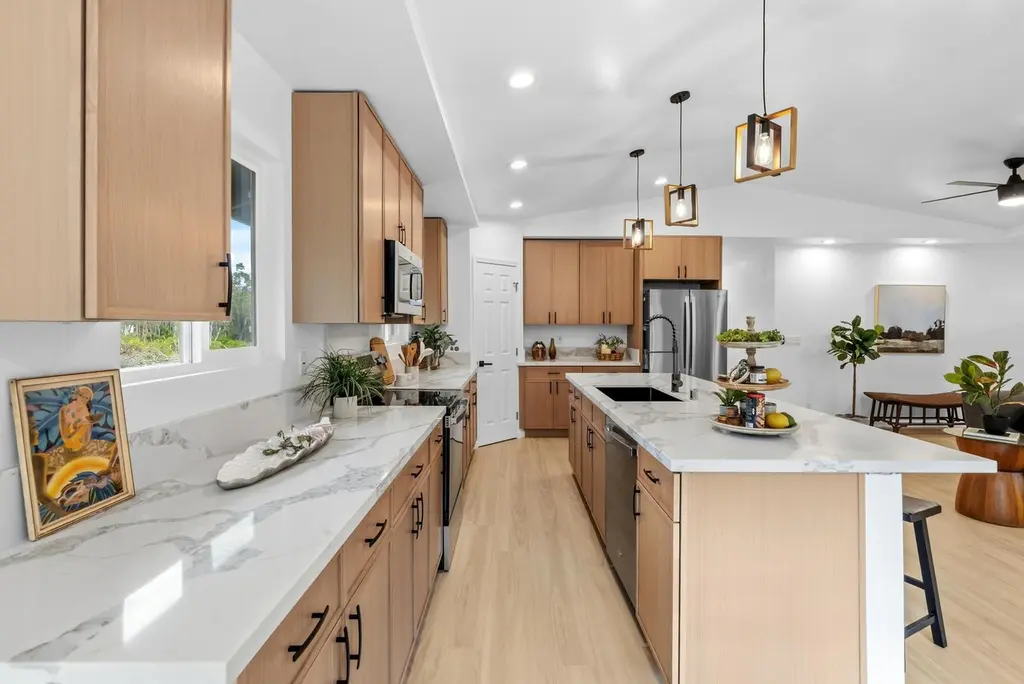
Welcome to 11-3290 Mokuna Street, a standout new listing in Royal Hawaiian Estates, one of Volcanos fastest growing subdivisions on the Big Island of Hawaii. Situated on a private flag lot, this Volcano home for sale offers added privacy and a peaceful setting surrounded by lush native landscape. The home is positioned toward the front of the approximately 24,000 sq ft lot, leaving a large backyard with endless potential, ideal for gardening, farming, outdoor living, or future expansion. This spacious 3 bedroom, 2 bath home features a thoughtfully designed open layout with a modern kitchen, complete with an oversized island, ample counter space, and a comfortable dining area perfect for entertaining or everyday living. The home offers a blend of comfort and functionality, making it an excellent option for a primary residence, second home, or Hawaii investment property. Located in the cool, elevated climate of Volcano, you’ll enjoy refreshing temperatures and a tranquil environment, just a short drive to Hawaii Volcanoes National Park. Royal Hawaiian Estates is quickly becoming the “new place to be” for buyers seeking Big Island real estate, privacy, and a growing community feel. If you’ve been searching for a home in Volcano Hawaii with land, privacy, and room to grow, this property is a must see.
Key facts
- Private flag lot
- Large backyard
- Modern kitchen
Tags
Neighborhood map
What this means for you Summary
Snapshot
- This is a 3-bed/2.0-bath single-family listed at $369k.
Deal economics
- At list price, monthly cash flow is $-746 ($-9k/yr) — negative.
- To cash-flow at today's rent, offer at most $261k (29.3% below list).
- To meet the 1% rule (rent ≥ 1% of price), the offer needs to be $228k (38.1% below list).
- Recommended offer: $228k (38.1% below list) — sets the bar for 1% rule.
Location & tenants
- Location reads: area grade D — affects rentability + tenant quality, not the cash-flow math above.
- Hawaii Department Of Education (suburban): math 32% / reading 50% proficiency, ranked #1 of 1 in HI (top 100%) — families likely to look elsewhere, expect single-tenant / working-renter base with shorter leases.
- Market conditions: 160 active listings in the ZIP; 982 units permitted in Hawaii County in 2024 (0 in 5+ unit buildings).
Forward outlook
- In year one you build about $5k of equity ($3k loan paydown + $2k appreciation (0.7% local appreciation)).
- Hawaii County population projected at +24% by 2050 — long-run rental-demand tailwind backs the buy-and-hold thesis.
- By year 7, paydown + projected appreciation supports a ~$36k cash-out refi (75% LTV) — recoverable capital for the next deal without selling this one.
Negotiation context
- It's been on market 62 days — a 6% lower offer ($347k) is reasonable based on typical stale-listing flexibility.
- 2 sale attempts; this cycle's ask has dropped $56k (13%) from the opening price — seller is motivated, your offer sets the floor, not the list.
Questions for the listing agent
- What do current leases actually rent for vs. the listed asking? Can we see a recent rent roll and the last 12 months of T-12 income?
- It's been on market 62 days. Have you received any prior offers? Is the seller open to a 38% concession, seller financing, or rate buy-down credit?
- Why hasn't it sold? Are there any deal-killer items the seller is aware of (foundation, flood, title, zoning, code violations)?
- Is there a deadline driving the sale (1031 exchange, divorce, estate, relocation)? That informs how much negotiation room exists.
- The area grade is low — what's the realistic commute time and amenity access for the typical tenant pool here? Any planned neighborhood developments (good or bad) we should know about?
- What's the average days-on-market for RENTAL listings here right now (not sales)? A rising rental-DOM trend means longer vacancies and softer asking-rent achievability than the comps imply.
- What's the recent tenant-quality profile in this submarket — average credit score on applications, eviction rate, late-payment / NSF rate, and stable-employment percentage? A property-management company in the area should have these aggregated.
- How much new for-sale + rental construction is in the pipeline within 1–3 miles? Heavy new supply typically softens prices + rents 12–24 months out; constrained supply supports both.
Investment metrics
- 1% rule
- 0.62% ✗
- Cap rate
- 3.87%
- Cash-on-cash
- -8.66%
- DSCR
- 0.61
- GRM
- 13.5
CMA / ARV
- ARV (median comp)
- $405,000
- List price
- $369,000
- Delta
- -8.89%
- Verdict
- FAIR
- Comps
- 10 within 1.0 mi
Show comp detail 6 sales within ~0.75 mi
| Address | Dist | Beds/Ba | Sqft | Sold | Price | $/sf | Match |
|---|---|---|---|---|---|---|---|
| 11-3111 Alii Koa St | 0.11mi | 3/2.0 | 1,308 (-2%) | 9mo | $435,000 | $333 | 84 |
| 11-3343 Volcano Rd | 0.27mi | 3/3.0 | 1,246 (-7%) | 6mo | $395,000 | $317 | 68 |
| 11-3122 Alii Kane St | 0.55mi | 3/2.0 | 1,304 (-2%) | 21mo | $380,000 | $291 | 53 |
| 11-3393 Volcano Rd | 0.46mi | 3/2.0 | 1,185 (-11%) | 10mo | $450,000 | $380 | 52 |
| 11-3156 PA Alii St | 0.66mi | 3/2.0 | 1,185 (-11%) | 0mo | $415,000 | $350 | 50 |
| 11-3073 Puolani St | 0.52mi | 3/3.0 | 1,246 (-7%) | 19mo | $355,000 | $285 | 45 |
Match score weights: distance 35% · size 25% · config 20% · recency 20%. Top-matched comps best support the ARV.
Projected returns pro-forma
0.66% appreciation · 3.0% rent growth · sell at horizon
- IRR
- -9.2%
- Equity multiple
- 0.55×
- Total profit
- $-46,690
- Equity at exit
- $119,464
- IRR
- -3.3%
- Equity multiple
- 0.61×
- Total profit
- $-39,821
- Equity at exit
- $153,842
Cash invested: $103,320 (down + closing). Projections, not guarantees.
Landlord ↔ Tenant lean methodology
- Overall (STATE)
- 37 Tenant-Leaning
- State Hawaii
- 37 Tenant-Leaning · D+13
- County
- — inherits STATE
- City
- — inherits STATE
ZIP-level market 96785
- Home prices YoY
- 0.4%
- Active inventory
- 160
- Price-to-rent
- 13.5×
Monthly cashflow live
- Estimated rent
- $2,284 medium interval (Pro) →
- Mortgage (P&I)
- −$1,935
- Tax est. 1.5%
- −$461 /mo · $5,535/yr
- Insurance
- −$154
- HOA
- −$0
- Vacancy / Maint / Mgmt
- −$480
- Net cashflow
- $-746
Break-even live
UW: 25.0% down · 7.5% · 30yr · 1.5% tax · 5.0% vac · 8.0% maint · 8.0% mgmt
Financing live
Cash to close
- Down payment
- $92,250
- Closing costs
- $11,070
- Reserves months
- —
- Total cash needed
- —
Loan-product check · same deal, 3 products live
Conventional
25% down · 7.5% · 30yr
- Down + closing
- —
- Monthly P&I
- —
- Monthly cashflow
- —
- DSCR
- —
- Eligible?
- —
Personal DTI + credit; lowest rate.
DSCR
20% down · 8.5% · 30yr
- Down + closing
- —
- Monthly P&I
- —
- Monthly cashflow
- —
- DSCR
- —
- Eligible?
- —
No personal income docs; deal must DSCR.
Hard money
10% down · 12.0% · 12mo
- Down + closing
- —
- Monthly P&I
- —
- Monthly cashflow
- —
- DSCR
- —
- Eligible?
- —
Short-term bridge; refi at stabilization.
Listing history 19 events
-
2026-06-19price $369,000 Active 62 DOM
-
2026-06-18days on market $390,000 Active 62 DOM
-
2026-06-17days on market $390,000 Active 61 DOM
-
2026-06-16days on market $390,000 Active 60 DOM
-
2026-06-15days on market $390,000 Active 59 DOM
-
2026-06-13days on market $390,000 Active 57 DOM
-
2026-06-13pricedays on market $390,000 Active 56 DOM
-
2026-06-10days on market $420,000 Active 54 DOM
-
2026-06-09days on market $420,000 Active 53 DOM
-
2026-06-08days on market $420,000 Active 52 DOM
-
2026-06-07days on market $420,000 Active 51 DOM
-
2026-06-05days on market $420,000 Active 48 DOM
-
2026-06-03days on market $420,000 Active 47 DOM
-
2026-06-02days on market $420,000 Active 46 DOM
-
2026-06-01days on market $420,000 Active 45 DOM
-
2026-05-31days on market $420,000 Active 44 DOM
-
2026-04-09$425,000 Active 1342-char remark
Show marketing remark (1342 chars)
Welcome to 11-3290 Mokuna Street, a standout new listing in Royal Hawaiian Estates, one of Volcanos fastest growing subdivisions on the Big Island of Hawaii. Situated on a private flag lot, this Volcano home for sale offers added privacy and a peaceful setting surrounded by lush native landscape. The home is positioned toward the front of the approximately 24,000 sq ft lot, leaving a large backyard with endless potential, ideal for gardening, farming, outdoor living, or future expansion. This spacious 3 bedroom, 2 bath home features a thoughtfully designed open layout with a modern kitchen, complete with an oversized island, ample counter space, and a comfortable dining area perfect for entertaining or everyday living. The home offers a blend of comfort and functionality, making it an excellent option for a primary residence, second home, or Hawaii investment property. Located in the cool, elevated climate of Volcano, you’ll enjoy refreshing temperatures and a tranquil environment, just a short drive to Hawaii Volcanoes National Park. Royal Hawaiian Estates is quickly becoming the “new place to be” for buyers seeking Big Island real estate, privacy, and a growing community feel. If you’ve been searching for a home in Volcano Hawaii with land, privacy, and room to grow, this property is a must see.
-
2026-03-30historical
-
2026-01-16$415,000 Active
ⓘ Source: listings_history table (triggers on properties + properties_extension) + one-shot
backfill from property_details.listing_events for pre-trigger history.
Climate risk First Street
- Flood 1/10 Low FEMA zone X (unshaded) · 0% chance over 30 yrs
- Air quality 1/10 Low
Nearby sold comps map
Loading sold comps map…
Walkable amenities ~0.75 mi
Loading nearby amenities…
Taxation est. · year 1
- Rental income
- $27,405
- − Mortgage interest
- −$20,670
- − Property taxes
- −$5,535
- − Insurance
- −$1,845
- − Repairs & maintenance
- −$2,192
- − Management
- −$2,192
- − Depreciation
- −$10,735
- Taxable loss
- −$15,764
- Est. tax savings @ 24.0%
- +$3,783
- After-tax cash flow
- $-5,168/yr
For passive investors: Depreciation is non-cash, so a rental often shows a tax loss while cash-flowing — sheltering income. Rental losses are passive: they offset passive income freely, and up to $25,000/yr can offset ordinary (W-2) income if you actively participate and your MAGI is under $100k (phasing out to $0 by $150k); unused losses carry forward. On sale, claimed depreciation is recaptured at up to 25%, and gains may owe capital-gains tax (a 1031 exchange can defer both). Figures are a year-1 estimate at your 24.0% rate — not tax advice; consult a CPA.
Schools (NCES district)
- District
- Hawaii Department Of Education
- NCES district ID
- 1500030
- Math proficiency
- 32% ▼ -10.00%
- Reading proficiency
- 50% ▼ -3.00%
- Median HH income
- $69,005
- Composite
- 37.07/100
- National rank
- #4504
- State rank
- #1 of 1 in HI
Livability — Royal Hawaiian Estates
No livability data for this city. (Only ~50 U.S. cities are tracked.)
Census & demographics
- Census place
- Royal Hawaiian Estates, HI
- Population (ZIP)
- 4,224
Population outlook (Hawaii County) Hauer SSP2
- Today (2025)
- 220,733 people
- By 2030
- 232,156 · +5.2%
- By 2040
- 252,486 · +14.4%
- By 2050
- 272,703 · +23.5%
- By 2075
- 332,113 · +50.5%
- By 2100
- 398,342 · +80.5%
Race, ethnicity, and origin ACS 2023
- Neighborhood character
- Highly diverse neighborhood (Simpson 0.76)
- Race & ethnicity
- White 46% Two or more races 39% Hispanic / Latino 16% Pacific Islander 5% Asian 5%
- Hispanic origin (detail)
- Mexican 3% Puerto Rican 6% Dominican 4%
- Common ancestry
- Russian 9% Lithuanian 4% Slovak 4%
- Foreign-born
- 2%
- Languages at home
- 89% English-only · Other Asian/Pacific 2% Spanish 1% Tagalog/Filipino 1%
Political lean MEDSL · Hawaii
- 2024 margin
- Strong D (+28.3) · D 63.0% · R 34.7% · Other 2.3%
- 2008→2024 swing
- -25.4pp toward R · 2008: 53.7pp · 2024: 28.3pp
- All cycles
- 2024: D+28.3 2020: D+36.2 2016: D+36.6 2012: D+51.3 2008: D+53.7
Not yet ingested
- Civics
- —
Market trends
- HPI YoY
- ▲ 0.66%
- Current HPI
- 185.9474
- Rent YoY
- —
- Metro
- —
- State GDP YoY
- —
- F500 in state
- 0
Price history
+2.4% since first listed3 events — show timeline
- 2026-04-09 Listed $425,000 HI Information Service
- 2026-03-30 Listing Removed — HI Information Service
- 2026-01-16 Listed $415,000 HI Information Service
Cash-flow waterfall
monthlySold comps — $/sqft
last 12 mo · ≤1 miLoading sold comps…