 Multi-family
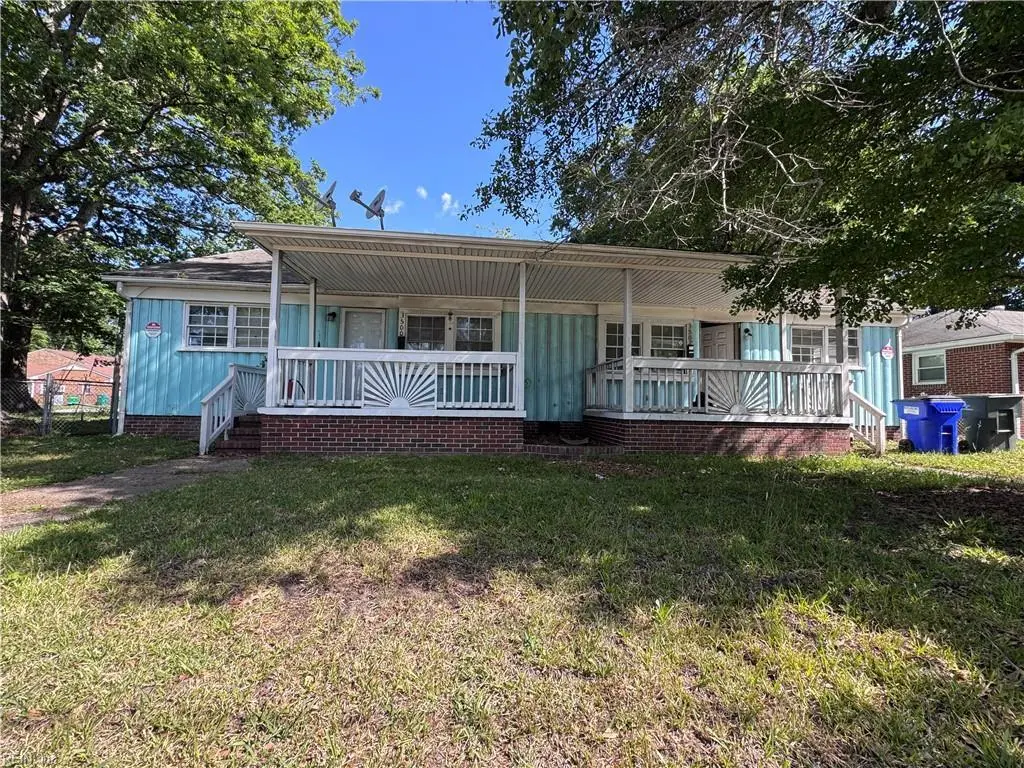
3500 Evangeline St · Norfolk, VA
Flood risk 1/10 · Minimal
- FEMA flood zone
- X (unshaded)
- Chance of flooding over 30 yrs
- 0.0%
- Est. flood insurance / yr
- $507 – $1,088
Fire risk 1/10 · Minimal
- Est. fire insurance / yr
- $666 – $1,236
Heat risk 9/10 · Severe
- Hot days now (above 106°F)
- 7 days/yr
- Hot days in 30 yrs
- 16 days/yr
Wind risk 8/10 · Major
- Chance of severe wind over 30 yrs
- 80.0%
Air-quality risk 3/10 · Minor
- Unhealthy air days now
- 2 days/yr
- Unhealthy air days in 30 yrs
- 3 days/yr
Risk factors via First Street. Map © Google.
Why this score? — see what drove the C+ grade
The composite is a weighted blend of 9 inputs, each scored 0–100. Each bar is that input's sub-score; the figure is the points it added to the 100-point composite (weight × sub-score).
- Cash flow +23.7/30.0
- DSCR +7.6/10.0
- ARV discount +7.5/15.0
- 1% rule +6.3/10.0
- Rent growth +5.0/5.0
- Livability +4.2/5.0
- Schools +3.5/10.0
- Condition / age +2.5/5.0
- Appreciation +0.0/10.0
$206,000
🖨 Deal sheet (PDF) 📄 Offer letter ✓ Due diligence
Multi-family units
County records classify this as Multi-Family (2-4 Unit). Listing-text estimate: 1 unit. estimate disagrees with records
Listing remarks
Investor special! Big Back yard and lot space! Located on a corner lot! Full Rehab needed. Cash or Rehab loan only!
Key facts
- Big back yard
- Corner lot
- Built 1956
Tags
Property features AI
Finance
- Other: Property listed as fixer upper; Each unit typically leased yearly
Exterior
- Parking: Driveway parking; Street parking
- Utilities: Separate meters for all utilities (electric and gas); City/County water; City/County sewer; Electric water heater
- Home design: Duplex; Simple ownership; Crawl foundation
- Construction: Asphalt shingle roof
- Exterior features: Wood siding; Back yard fenced with chain-link; Corner lot
Interior
- Kitchen: Each unit has a kitchen; Electric range in each unit
- Bedrooms: Two 2-bedroom units
- Flooring: Carpeted floors in each unit
- Bathrooms: Each unit has 1 bathroom
- Heating & cooling: Electric heating in each unit; Central air conditioning in each unit
- Interior features: Cable TV hookup; Utility closet; Main floor laundry (accessible)
- Laundry & utility: Washer hookup in each unit; Dryer hookup in each unit; Electric water heater
Neighborhood map
What this means for you Summary
Snapshot
- This is a 4-bed/2.0-bath multifamily listed at $206k.
Deal economics
- At list price, monthly cash flow is $393 ($5k/yr) — positive.
- The deal already cash-flows at list — no discount required.
- Meets the 1% rule at list price ($2k rent vs $206k).
- Cap rate 8.6% vs local median 4.0% in Norfolk — top-decile yield for the area; either an underpriced asset or a hidden risk that comps aren't pricing in. Stress-test before assuming the spread holds.
Location & tenants
- Location reads 83/100 on livability (#43 in VA, #1,026 nationally) — a professional / high-income tenant draw. Strengths: amenities A+, commute A+, health & safety A+; Watch: employment C-, crime F.
- Norfolk City Public School District (urban): math 27% / reading 56% proficiency, ranked #118 of 131 in VA (top 90%) — families likely to look elsewhere, expect single-tenant / working-renter base with shorter leases.
- Zoned schools: Lake Taylor High (math 38% / reading 72%, grade C, #279 of 319 statewide, top 88%, 1,030 students, 92% FRL) — zoned schools average 92% FRL vs 59% district-wide (34 pts higher); higher-poverty schools than district average — tighter screening recommended.
- Zoned-school proficiency averages 55% at this address vs 42% district-wide (+14 pts) — the actual schools serving this property are materially stronger than the Norfolk City Public School District average implies; a family-tenant draw the district grade alone would hide.
- Market conditions: Rents rising fast (+15.1%/yr); 78 active listings in the ZIP; 17 comparable units currently listed for rent nearby; rentals at typical pace (median 25d on market — plan ~3-4 weeks tenant-placement turnaround); 41% of comp listings sitting > 30 days — soft ceiling on asking rent; 438 units permitted in Norfolk city in 2024 (273 in 5+ unit buildings).
- This rent runs 44% of the median local income ($63k/yr) — at the standard rent-burdened threshold; future hikes will face affordability resistance.
Forward outlook
- Local home prices are declining (-3.0%/yr); year-one equity from $1k of loan paydown is wiped out by about $6k of value loss. Plan a longer hold.
- At projected returns (-3.0% appreciation + 8.0% rent growth), your $58k cash investment doubles in ~8 years — after that, you're playing with house money.
Negotiation context
- Only 5 days on market — expect competitive offers; lowballing is unlikely to land.
- Current owner paid $98k; list at $206k implies a 111% gain — meaningful room to come down on a strong offer.
Risks & watch-outs
- Watch-outs: built in 1956 — expect roof / HVAC / electrical / plumbing capex.
- Climate carrying-cost: severe wind risk, 80% chance of damaging wind over 30y; extreme-heat days projected 7→16/yr by 2055 (HVAC capex compounding) — expect insurance premiums to compound above CPI over the hold.
Questions for the listing agent
- Built in 1956 — when were the roof, HVAC, electrical panel, plumbing, and water heater last replaced?
- Is there a deadline driving the sale (1031 exchange, divorce, estate, relocation)? That informs how much negotiation room exists.
- Schools are A-rated — typically a magnet for longer-tenancy family renters. What's the average tenant stay here, and is there a school-zone premium baked into asking?
- Crime grade is F in this area — have there been break-ins, vandalism, or insurance claims at this property in the last 3 years? What carrier currently insures it and at what premium?
- What's the average days-on-market for RENTAL listings here right now (not sales)? A rising rental-DOM trend means longer vacancies and softer asking-rent achievability than the comps imply.
- What's the recent tenant-quality profile in this submarket — average credit score on applications, eviction rate, late-payment / NSF rate, and stable-employment percentage? A property-management company in the area should have these aggregated.
- How much new apartment / multifamily construction is in the pipeline within 1–3 miles? Heavy new supply (>2% of stock underway) typically softens rents 12–24 months out; light construction supports rent growth.
Investment metrics
- 1% rule
- 1.13% ✓
- Cap rate
- 8.58%
- Cash-on-cash
- 8.17%
- DSCR
- 1.36
- GRM
- 7.3
CMA / ARV
No comps found within radius.
Projected returns pro-forma
-3.0% appreciation · 8.0% rent growth · sell at horizon
- IRR
- 1.7%
- Equity multiple
- 1.07×
- Total profit
- $4,026
- Equity at exit
- $30,715
- IRR
- 15.8%
- Equity multiple
- 2.60×
- Total profit
- $92,144
- Equity at exit
- $17,811
Cash invested: $57,680 (down + closing). Projections, not guarantees.
Landlord ↔ Tenant lean methodology
- Overall (STATE)
- 55 Moderately Landlord-Leaning
- State Virginia
- 55 Moderately Landlord-Leaning · D+2
- County
- — inherits STATE
- City
- — inherits STATE
ZIP-level market 23502
- Home prices YoY
- -20.7%
- Rents YoY
- 15.1%
- Active inventory
- 78
- Price-to-rent
- 7.3×
Monthly cashflow live
- Estimated rent
- $2,338 high interval (Pro) →
- Mortgage (P&I)
- −$1,080
- Tax from tax record
- −$288 /mo · $3,458/yr
- Insurance
- −$86
- HOA
- −$0
- Vacancy / Maint / Mgmt
- −$491
- Net cashflow
- $393
Break-even live
Sensitivity live
| Price | -10% $509 | -5% $451 | +0% $393 | +5% $334 | +10% $276 |
|---|---|---|---|---|---|
| Rent | -10% $208 | -5% $300 | +0% $393 | +5% $485 | +10% $577 |
| Rate | -1.0pp $496 | -0.5pp $445 | base $393 | +0.5pp $339 | +1.0pp $285 |
UW: 25.0% down · 7.5% · 30yr · 1.5% tax · 5.0% vac · 8.0% maint · 8.0% mgmt
Financing live
Cash to close
- Down payment
- $51,500
- Closing costs
- $6,180
- Reserves months
- —
- Total cash needed
- —
Loan-product check · same deal, 3 products live
Conventional
25% down · 7.5% · 30yr
- Down + closing
- —
- Monthly P&I
- —
- Monthly cashflow
- —
- DSCR
- —
- Eligible?
- —
Personal DTI + credit; lowest rate.
DSCR
20% down · 8.5% · 30yr
- Down + closing
- —
- Monthly P&I
- —
- Monthly cashflow
- —
- DSCR
- —
- Eligible?
- —
No personal income docs; deal must DSCR.
Hard money
10% down · 12.0% · 12mo
- Down + closing
- —
- Monthly P&I
- —
- Monthly cashflow
- —
- DSCR
- —
- Eligible?
- —
Short-term bridge; refi at stabilization.
Rent comps 17 comps
| Address | Beds | Baths | Sqft | Rent | $/sqft | DOM | Units | Dist |
|---|---|---|---|---|---|---|---|---|
| 2841 Earlscourt Ave Norfolk, VA | 4.0 | 2.0 | 1404 | $2,000 | $1.42 | 3d | 1 | 0.85mi |
| 2841 Earlscourt Ave Norfolk, VA | 4.0 | 2.0 | 1404 | $2,000 | $1.42 | 4d | 1 | 0.85mi |
| 2808 Westminster Ave Norfolk, VA | 4.0 | 2.0 | 1988 | $2,295 | $1.15 | 25d | 1 | 0.89mi |
| 2920 Cape Henry Ave Unit A Norfolk, VA | 3.0 | 1.5 | 2331 | $1,900 | $0.82 | 3d | 1 | 0.89mi |
| 2700 Myrtle Ave Norfolk, VA | 3.0 | 3.0 | 1888 | $2,600 | $1.38 | 45d | 1 | 0.91mi |
| 2806 Kimball Ter Norfolk, VA | 3.0 | 2.5 | 1700 | $2,100 | $1.24 | 45d | 1 | 1.01mi |
| 1022 Kenton Ave Norfolk, VA | 3.0 | 2.0 | 1400 | $2,400 | $1.71 | 11d | 1 | 1.04mi |
| 2800 Chesterfield Blvd Norfolk, VA | 3.0 | 2.5 | 1760 | $2,400 | $1.36 | 5d | 1 | 1.11mi |
| 1531 Spruce St Unit B Norfolk, VA | 3.0 | 2.0 | 1304 | $1,600 | $1.23 | 25d | 1 | 1.14mi |
| 1531 Spruce St Unit B Norfolk, VA | 3.0 | 2.0 | 1304 | $1,600 | $1.23 | 45d | 1 | 1.14mi |
| 2531 Vincent Ave Norfolk, VA | 3.0 | 2.0 | 1600 | $2,195 | $1.37 | 45d | 1 | 1.20mi |
| 2624 Chesterfield Blvd Norfolk, VA | 4.0 | 1.5 | 1512 | $2,000 | $1.32 | 45d | 1 | 1.23mi |
| 1323 W Norcova Dr Norfolk, VA | 3.0 | 1.0 | 1410 | $2,500 | $1.77 | 45d | 1 | 1.26mi |
| 2537 McKann Ave Norfolk, VA | 4.0 | 2.5 | 2321 | $2,695 | $1.16 | 16d | 1 | 1.28mi |
| 1403 Lead St Norfolk, VA | 4.0 | 2.5 | 1854 | $2,550 | $1.38 | 45d | 1 | 1.32mi |
| 1562 Norcova Ave Norfolk, VA | 3.0 | 1.0 | 1288 | $2,000 | $1.55 | 18d | 1 | 1.49mi |
| 2660 Chesapeake Blvd Norfolk, VA | 3.0 | 2.0 | 1375 | $2,100 | $1.53 | 18d | 1 | 1.49mi |
Listing history 4 events
-
2026-05-21$206,000 Active
-
2002-01-31soldstatus $97,500
-
1999-11-17soldstatus $45,000
-
1994-10-04soldstatus $40,000
ⓘ Source: listings_history table (triggers on properties + properties_extension) + one-shot
backfill from property_details.listing_events for pre-trigger history.
Tax reassessment forecast VA · Resets to sale price
- Current annual tax
- $3,458 · $288/mo
- Projected year-2 tax
- $3,458 · $288/mo
- Expected delta
- $0/yr ($0/mo · 0.0%)
ⓘ Screening estimate from a state-policy table — verify with the county assessor before closing.
Climate risk First Street
- Flood 1/10 Low FEMA zone X (unshaded) · 0% chance over 30 yrs
- Wildfire 1/10 Low
- Heat 9/10 Extreme 7 d/yr ≥106°F today · 16 d/yr by 30 yrs out
- Wind 8/10 Severe 80% chance of damaging wind over 30 yrs
- Air quality 3/10 Moderate 2 unhealthy d/yr today · 3 by 30 yrs out
Nearby sold comps map
Loading sold comps map…
Walkable amenities ~0.75 mi
Loading nearby amenities…
Taxation est. · year 1
- Rental income
- $28,052
- − Mortgage interest
- −$11,539
- − Property taxes
- −$3,458
- − Insurance
- −$1,030
- − Repairs & maintenance
- −$2,244
- − Management
- −$2,244
- − Depreciation
- −$5,993
- Taxable income
- $1,544
- Est. tax owed @ 24.0%
- −$371
- After-tax cash flow
- $4,339/yr
For passive investors: Depreciation is non-cash, so a rental often shows a tax loss while cash-flowing — sheltering income. Rental losses are passive: they offset passive income freely, and up to $25,000/yr can offset ordinary (W-2) income if you actively participate and your MAGI is under $100k (phasing out to $0 by $150k); unused losses carry forward. On sale, claimed depreciation is recaptured at up to 25%, and gains may owe capital-gains tax (a 1031 exchange can defer both). Figures are a year-1 estimate at your 24.0% rate — not tax advice; consult a CPA.
Schools (NCES district)
- District
- Norfolk City Public School District
- NCES district ID
- 5102670
- Math proficiency
- 27% ▼ -44.00%
- Reading proficiency
- 56% ▼ -10.00%
- Median HH income
- $44,358
- Composite
- 35.08/100
- National rank
- #5026
- State rank
- #118 of 131 in VA
Livability — Norfolk
- Score
- 83/100
- State rank
- #43
- US rank
- #1026
Category grades
Schools grade is shown separately in the Schools card above.
Census & demographics
- Census place
- Norfolk, VA
- County
- Norfolk City · 214,042 people
- City population
- 214,042
- Metro
- Virginia Beach-Norfolk-Newport News, VA-NC
- Population (ZIP)
- 20,399
- Household income
- $63,208
- Rent vs Own
- Severe rent burden
- 1255.0
Population outlook (Norfolk County) Hauer SSP2
- Today (2025)
- 249,032 people
- By 2030
- 252,347 · +1.3%
- By 2040
- 253,644 · +1.9%
- By 2050
- 251,913 · +1.2%
- By 2075
- 245,281 · -1.5%
- By 2100
- 219,548 · -11.8%
Race, ethnicity, and origin ACS 2023
- Neighborhood character
- Diverse neighborhood (Simpson 0.67)
- Race & ethnicity
- Black 46% White 31% Hispanic / Latino 12% Two or more races 9% Asian 4%
- Hispanic origin (detail)
- Mexican 4% Puerto Rican 2% Dominican 2%
- Common ancestry
- Portuguese 1% Romanian 1% Slovak 1%
- Foreign-born
- 9% · Canada, Jamaica
- Languages at home
- 88% English-only · Spanish 6% Tagalog/Filipino 3% Other Indo-European 1%
Political lean MEDSL · Norfolk
- 2024 margin
- Solid D (+41.5) · D 70.0% · R 28.5% · Other 1.6%
- 2008→2024 swing
- -1.4pp toward R · 2008: 43.0pp · 2024: 41.5pp
- All cycles
- 2024: D+41.5 2020: D+45.6 2016: D+42.0 2012: D+44.0 2008: D+43.0
Not yet ingested
- Civics
- —
Market trends
- HPI YoY
- ▼ -83.50%
- Current HPI
- 320.4522
- Rent YoY
- ▲ 15.10%
- Metro
- Virginia Beach-Norfolk-Newport News, VA-NC
- State GDP YoY
- ▲ 2.40%
- F500 in state
- 50
Industry mix (Fortune 500 HQ in VA)
| Industry | F500 HQs | Revenue |
|---|---|---|
| Aerospace / Defense | 4 | $236B |
|
||
| Technology / Defense | 3 | $32B |
|
||
| Financial Services | 2 | $176B |
|
||
| Utilities | 2 | $27B |
|
||
| Insurance | 2 | $25B |
|
||
| Technology | 2 | $15B |
|
||
Price history
+415.0% since first listed4 events — show timeline
- 2026-05-21 Listed $206,000 REINMLS
- 2002-01-31 Sold (Public Records) $97,500 Public Records
- 1999-11-17 Sold (Public Records) $45,000 Public Records
- 1994-10-04 Sold (Public Records) $40,000 Public Records
Property tax history
+4.5%/yrLatest (2025): $3,458 · +14.8% YoY. Source: county tax records.
Cash-flow waterfall
monthlySold comps — $/sqft
last 12 mo · ≤1 miLoading sold comps…