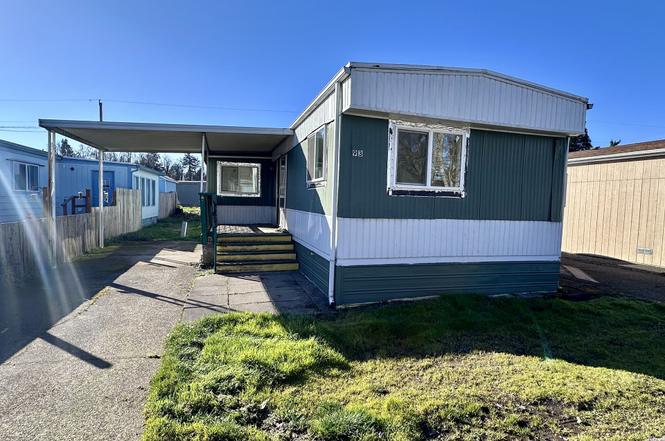
4475 Daisy St · Springfield, OR
Flood risk 1/10 · Minimal
- FEMA flood zone
- X (unshaded)
- Chance of flooding over 30 yrs
- 0.0%
- Est. flood insurance / yr
- $507 – $1,088
Fire risk 5/10 · Moderate
- Est. fire insurance / yr
- $498 – $926
Heat risk 4/10 · Minor
- Hot days now (above 91°F)
- 7 days/yr
- Hot days in 30 yrs
- 15 days/yr
Wind risk 1/10 · Minimal
- Chance of severe wind over 30 yrs
- —
Air-quality risk 10/10 · Severe
- Unhealthy air days now
- 16 days/yr
- Unhealthy air days in 30 yrs
- 19 days/yr
Risk factors via First Street. Map © Google.
Why this score? — see what drove the B- grade
The composite is a weighted blend of 9 inputs, each scored 0–100. Each bar is that input's sub-score; the figure is the points it added to the 100-point composite (weight × sub-score).
- Cash flow +30.0/30.0
- 1% rule +10.0/10.0
- DSCR +10.0/10.0
- ARV discount +7.5/15.0
- Livability +4.2/5.0
- Rent growth +3.3/5.0
- Condition / age +2.5/5.0
- Schools +2.4/10.0
- Appreciation +0.0/10.0
$49,500
🖨 Deal sheet 📄 Offer letter ✓ Due diligence
Listing remarks MLS
Check out this well maintained 2 bed, 1 bath home in a all age park. Close to shopping, dining & schools. Space rent includes water & sewer. Don't wait. Come make this your home.
Key facts
- Flooring
- Paint
- Bathroom updates
Tags
Property features AI
Finance
- Other: Property listed as residential, resale; Main level living area approximately 1,008
- HOA & community: Located in Country Manor Mobile Home Park; Park is not a senior-only community; Monthly lot rent of $1,079; Land lease in place (expires June 29, 2026)
Exterior
- Parking: Carport
- Utilities: Public water; Public sewer; Electric service (fuel: electricity)
- Home design: Manufactured home in park; Single-story (main level living); Broadmore manufactured home; Built in 1979; No notable view
- Construction: Metal siding; Membrane roof; Manufactured home construction; Unit dimensions approximately 66' x 14'
- Exterior features: Covered deck and deck; Tool shed; Yard; Level lot; Paved road access
Interior
- Kitchen: Free-standing range; Kitchen open to living/dining area
- Bedrooms: Primary bedroom with closet and en-suite features (main level); Second bedroom (main level); Third bedroom (main level)
- Flooring: Laminate flooring
- Bathrooms: Two full bathrooms (both on the main level)
- Heating & cooling: No heating system listed; No cooling system listed; Electric water heater
- Interior features: Laundry hookup available; Laminate flooring throughout; Aluminum and vinyl window frames
- Laundry & utility: Laundry hookup available
Neighborhood map
What this means for you Summary
Snapshot
- This is a 3-bed/2.0-bath manufactured listed at $50k.
Deal economics
- At list price, monthly cash flow is $1k ($14k/yr) — positive.
- The deal already cash-flows at list — no discount required.
- Meets the 1% rule at list price ($2k rent vs $50k).
- Recommended offer: $48k (3.0% below list) — sets the bar for market timing.
- Cap rate 33.8% vs local median 3.0% in Springfield — top-decile yield for the area; either an underpriced asset or a hidden risk that comps aren't pricing in. Stress-test before assuming the spread holds.
Location & tenants
- Location reads 83/100 on livability (#40 in OR, #934 nationally) — a professional / high-income tenant draw. Strengths: amenities A+, commute A+, housing A+; Watch: crime D+, employment D+.
- Springfield SD 19 (suburban): math 19% / reading 38% proficiency, ranked #48 of 58 in OR (top 83%) — low school quality limits family demand, transient renter base, plan for 1-2y turnover.
- Zoned schools: Maple Elementary School (math 15% / reading 30%, grade F, #343 of 412 statewide, top 83%, 255 students, 72% FRL); Agnes Stewart Middle School (math 16% / reading 36%, grade F, #101 of 128 statewide, top 80%, 513 students, 63% FRL); Springfield High School (math 30% / reading 54%, grade F, #64 of 143 statewide, top 46%, 1,317 students, 65% FRL).
- Market conditions: Rents rising (+3.4%/yr); 263 active listings in the ZIP; 20 comparable units currently listed for rent nearby; rentals leasing fast (median 14d on market — plan ~1-2 weeks tenant-placement turnaround); solid renter incomes; 1,808 units permitted in Lane County in 2024 (972 in 5+ unit buildings).
Forward outlook
- Local home prices are declining (-3.0%/yr); year-one equity from $342 of loan paydown is wiped out by about $1k of value loss. Plan a longer hold.
- Lane County population projected at +15% by 2050 — long-run rental-demand tailwind backs the buy-and-hold thesis.
- At projected returns (-3.0% appreciation + 3.4% rent growth), your $14k cash investment doubles in ~2 years — after that, you're playing with house money.
Negotiation context
- It's been on market 44 days — a 3% lower offer ($48k) is reasonable based on typical stale-listing flexibility.
- 3 sale attempts since 4y ago; this cycle's ask has dropped $10k (18%) from the opening price — seller is motivated, your offer sets the floor, not the list.
- Current owner paid $30k; list at $50k implies a 65% gain — meaningful room to come down on a strong offer.
Risks & watch-outs
- Climate carrying-cost: moderate wildfire risk — expect insurance premiums to compound above CPI over the hold.
Questions for the listing agent
- It's been on market 44 days. Have you received any prior offers? Is the seller open to a 3% concession, seller financing, or rate buy-down credit?
- Built in 1979 — when were the roof, HVAC, electrical panel, plumbing, and water heater last replaced?
- Is there a deadline driving the sale (1031 exchange, divorce, estate, relocation)? That informs how much negotiation room exists.
- Schools are D-rated, which usually means shorter tenancies and higher turnover. Who's the typical renter profile here, and what's been the actual vacancy rate?
- Crime grade is D in this area — have there been break-ins, vandalism, or insurance claims at this property in the last 3 years? What carrier currently insures it and at what premium?
- What's the average days-on-market for RENTAL listings here right now (not sales)? A rising rental-DOM trend means longer vacancies and softer asking-rent achievability than the comps imply.
- What's the recent tenant-quality profile in this submarket — average credit score on applications, eviction rate, late-payment / NSF rate, and stable-employment percentage? A property-management company in the area should have these aggregated.
- How much new for-sale + rental construction is in the pipeline within 1–3 miles? Heavy new supply typically softens prices + rents 12–24 months out; constrained supply supports both.
Investment metrics
- 1% rule
- 3.78% ✓
- Cap rate
- 33.84%
- Cash-on-cash
- 98.39%
- DSCR
- 5.38
- GRM
- 2.2
CMA / ARV
- ARV (on-the-fly)
- $294,336
- Comps found
- 2
Show comp detail 2 sales within ~0.75 mi
| Address | Dist | Beds/Ba | Sqft | Sold | Price | $/sf | Match |
|---|---|---|---|---|---|---|---|
| 4475 Daisy St | 0.00mi | 3/2.0 | 1,008 (0%) | 2mo | $41,500 | $41 | 99 |
| 463 S 46th St | 0.20mi | 2/2.0 (-1) | 975 (-3%) | 14mo | $285,000 | $292 | 68 |
Match score weights: distance 35% · size 25% · config 20% · recency 20%. Top-matched comps best support the ARV.
Projected returns pro-forma
-3.0% appreciation · 3.38% rent growth · sell at horizon
- IRR
- 99.8%
- Equity multiple
- 5.70×
- Total profit
- $65,105
- Equity at exit
- $7,381
- IRR
- —
- Equity multiple
- 12.04×
- Total profit
- $152,977
- Equity at exit
- $4,280
Cash invested: $13,860 (down + closing). Projections, not guarantees.
Landlord ↔ Tenant lean methodology
- Overall (STATE)
- 28 Tenant-Leaning
- State Oregon
- 28 Tenant-Leaning · D+6
- County
- — inherits STATE
- City
- — inherits STATE
ZIP-level market 97478
- Rents YoY
- 3.4%
- Active inventory
- 263
- Price-to-rent
- 2.2×
Monthly cashflow live
- Estimated rent
- $1,872 high interval (Pro) →
- Mortgage (P&I)
- −$260
- Tax est. 1.5%
- −$62 /mo · $742/yr
- Insurance
- −$21
- HOA
- −$0
- Vacancy / Maint / Mgmt
- −$393
- Net cashflow
- $1,136
Break-even live
UW: 25.0% down · 7.5% · 30yr · 1.5% tax · 5.0% vac · 8.0% maint · 8.0% mgmt
Financing live
Cash to close
- Down payment
- $12,375
- Closing costs
- $1,485
- Reserves months
- —
- Total cash needed
- —
Loan-product check · same deal, 3 products live
Conventional
25% down · 7.5% · 30yr
- Down + closing
- —
- Monthly P&I
- —
- Monthly cashflow
- —
- DSCR
- —
- Eligible?
- —
Personal DTI + credit; lowest rate.
DSCR
20% down · 8.5% · 30yr
- Down + closing
- —
- Monthly P&I
- —
- Monthly cashflow
- —
- DSCR
- —
- Eligible?
- —
No personal income docs; deal must DSCR.
Hard money
10% down · 12.0% · 12mo
- Down + closing
- —
- Monthly P&I
- —
- Monthly cashflow
- —
- DSCR
- —
- Eligible?
- —
Short-term bridge; refi at stabilization.
Rent comps 20 comps
| Address | Beds | Baths | Sqft | Rent | $/sqft | DOM | Units | Dist |
|---|---|---|---|---|---|---|---|---|
| 4173 Glacier View Dr Springfield, OR | 3.0 | 2.5 | 1250 | $2,175 | $1.74 | 13d | 1 | 0.32mi |
| 339 S 42nd St Unit 317 Springfield, OR | 3.0 | 2.5 | 1444 | $1,895 | $1.31 | 13d | 1 | 0.34mi |
| 274 S 47th St Unit B Springfield, OR | 2.0 | 1.0 | 940 | $1,150 | $1.22 | 21d | 1 | 0.35mi |
| 617 S 41st Ct Unit 610 Springfield, OR | 3.0 | 2.5 | 1500 | $2,050 | $1.37 | 13d | 1 | 0.40mi |
| 617 S 41st Ct Unit 606 Springfield, OR | 3.0 | 2.5 | 1500 | $2,100 | $1.40 | 13d | 1 | 0.40mi |
| 4885 Aster St Springfield, OR | 2.0 | 1.5 | 1000 | $1,734 | $1.73 | 13d | 18 | 0.50mi |
| 4830 Elderberry Loop Springfield, OR | 2.0 | 1.0 | 950 | $1,595 | $1.68 | 43d | 1 | 0.50mi |
| 4800 B St Springfield, OR | 2.0 | 2.0 | 968 | $1,662 | $1.72 | 13d | 1 | 0.67mi |
| 219 S 40th St Unit 221s40th Springfield, OR | 3.0 | 1.5 | 1042 | $1,645 | $1.58 | 13d | 1 | 0.69mi |
| 4086 B St Springfield, OR | 2.0–3.0 | 1.0–2.0 | 901 | $2,100 | $2.33 | 13d | 6 | 0.74mi |
| 403 S 37th Pl Springfield, OR | 3.0 | 1.0 | 980 | $1,995 | $2.04 | 21d | 1 | 0.81mi |
| 3785 Main St Springfield, OR | 2.0 | 1.0 | 850 | $1,645 | $1.94 | 21d | 1 | 0.84mi |
| 5040 E St #1 Springfield, OR | 3.0 | 1.0 | 1000 | $1,895 | $1.90 | 13d | 1 | 0.99mi |
| 5040 E St #12 Springfield, OR | 3.0 | 1.0 | 912 | $1,895 | $2.08 | 43d | 1 | 0.99mi |
| 5040 E St #21 Springfield, OR | 3.0 | 1.0 | 1000 | $1,795 | $1.79 | 13d | 1 | 0.99mi |
| 176 S 53rd St Unit 04 Springfield, OR | 2.0 | 1.5 | 971 | $1,250 | $1.29 | 43d | 1 | 1.00mi |
| 5312 Main St Unit 14 Springfield, OR | 2.0 | 1.0 | 780 | $1,199 | $1.54 | 43d | 1 | 1.07mi |
| 5312 Main St Unit 13 Springfield, OR | 2.0 | 1.0 | 780 | $1,299 | $1.67 | 43d | 1 | 1.08mi |
| 317 30th St Springfield, OR | 2.0–3.0 | 2.0 | 1200 | $2,405 | $2.00 | 13d | 19 | 1.38mi |
| 1012 53rd St Springfield, OR | 3.0 | 2.0 | 1249 | $2,195 | $1.76 | 13d | 1 | 1.45mi |
Listing history 11 events
-
2026-04-16status Pending
-
2026-04-12price $49,500
-
2026-04-02price $52,000
-
2026-03-16price $55,000
-
2026-03-11price $58,000
-
2026-03-02$60,000 Active
-
2023-12-22soldstatus $30,000 Closed 190-char remark
Show marketing remark (190 chars)
Check out this well maintained 2 bed, 1 bath home in a all age park. Close to shopping, dining & schools. Space rent includes water & sewer. Don't wait. Come make this your home.
-
2023-12-05status Pending 190-char remark
Show marketing remark (190 chars)
Check out this well maintained 2 bed, 1 bath home in a all age park. Close to shopping, dining & schools. Space rent includes water & sewer. Don't wait. Come make this your home.
-
2023-11-15$30,000 Active 190-char remark
Show marketing remark (190 chars)
Check out this well maintained 2 bed, 1 bath home in a all age park. Close to shopping, dining & schools. Space rent includes water & sewer. Don't wait. Come make this your home.
-
2022-07-08soldstatus $50,000
-
2022-06-27$50,000
ⓘ Source: listings_history table (triggers on properties + properties_extension) + one-shot
backfill from property_details.listing_events for pre-trigger history.
Climate risk First Street
- Flood 1/10 Low FEMA zone X (unshaded) · 0% chance over 30 yrs
- Wildfire 5/10 Major
- Heat 4/10 Moderate 7 d/yr ≥91°F today · 15 d/yr by 30 yrs out
- Wind 1/10 Low
- Air quality 10/10 Extreme 16 unhealthy d/yr today · 19 by 30 yrs out
Nearby sold comps map
Loading sold comps map…
Walkable amenities ~0.75 mi
Loading nearby amenities…
Taxation est. · year 1
- Rental income
- $22,458
- − Mortgage interest
- −$2,773
- − Property taxes
- −$742
- − Insurance
- −$248
- − Repairs & maintenance
- −$1,797
- − Management
- −$1,797
- − Depreciation
- −$1,440
- Taxable income
- $13,662
- Est. tax owed @ 24.0%
- −$3,279
- After-tax cash flow
- $10,358/yr
For passive investors: Depreciation is non-cash, so a rental often shows a tax loss while cash-flowing — sheltering income. Rental losses are passive: they offset passive income freely, and up to $25,000/yr can offset ordinary (W-2) income if you actively participate and your MAGI is under $100k (phasing out to $0 by $150k); unused losses carry forward. On sale, claimed depreciation is recaptured at up to 25%, and gains may owe capital-gains tax (a 1031 exchange can defer both). Figures are a year-1 estimate at your 24.0% rate — not tax advice; consult a CPA.
Schools (NCES district)
- District
- Springfield SD 19
- NCES district ID
- 4111670
- Math proficiency
- 19% ▼ -13.00%
- Reading proficiency
- 38% ▼ -10.00%
- Median HH income
- $42,236
- Composite
- 24.14/100
- National rank
- #7746
- State rank
- #48 of 58 in OR
Livability — Springfield
- Score
- 83/100
- State rank
- #40
- US rank
- #934
Category grades
Schools grade is shown separately in the Schools card above.
Census & demographics
- Census place
- Springfield, OR
- County
- Lane County · 310,476 people
- City population
- 76,907
- Metro
- Eugene-Springfield, OR
- Population (ZIP)
- 39,373
- Household income
- $80,086
- Rent vs Own
- Severe rent burden
- 904.0
Population outlook (Lane County) Hauer SSP2
- Today (2025)
- 391,933 people
- By 2030
- 405,860 · +3.6%
- By 2040
- 429,386 · +9.6%
- By 2050
- 452,016 · +15.3%
- By 2075
- 508,825 · +29.8%
- By 2100
- 531,208 · +35.5%
Race, ethnicity, and origin ACS 2023
- Neighborhood character
- Predominantly White (79%)
- Race & ethnicity
- White 79% Hispanic / Latino 12% Two or more races 9% Native American 1% Asian 1%
- Hispanic origin (detail)
- Mexican 9%
- Common ancestry
- Slovak 4% Lithuanian 3% Portuguese 3%
- Foreign-born
- 4% · Canada
- Languages at home
- 94% English-only · Spanish 5% Tagalog/Filipino 1%
Political lean MEDSL · Lane
- 2024 margin
- Strong D (+23.1) · D 60.0% · R 36.9% · Other 3.1%
- 2008→2024 swing
- -4.3pp toward R · 2008: 27.4pp · 2024: 23.1pp
- All cycles
- 2024: D+23.1 2020: D+24.3 2016: D+18.9 2012: D+23.4 2008: D+27.4
Not yet ingested
- Civics
- —
Market trends
- HPI YoY
- ▼ -395.83%
- Current HPI
- 302.9203
- Rent YoY
- ▲ 3.38%
- Metro
- Eugene-Springfield, OR
- State GDP YoY
- ▲ 2.05%
- F500 in state
- 2
Industry mix (Fortune 500 HQ in OR)
| Industry | F500 HQs | Revenue |
|---|---|---|
| Consumer Goods | 1 | $51B |
|
||
Price history
-1.0% since first listed11 events — show timeline
- 2026-04-16 Pending — RMLS
- 2026-04-12 Price Changed $49,500 RMLS
- 2026-04-02 Price Changed $52,000 RMLS
- 2026-03-16 Price Changed $55,000 RMLS
- 2026-03-11 Price Changed $58,000 RMLS
- 2026-03-02 Listed $60,000 RMLS
- 2023-12-22 Sold (MLS) $30,000 RMLS
- 2023-12-05 Pending — RMLS
- 2023-11-15 Listed $30,000 RMLS
- 2022-07-08 Sold (MLS) $50,000 RMLS
- 2022-06-27 Listed $50,000 RMLS
Cash-flow waterfall
monthlySold comps — $/sqft
last 12 mo · ≤1 miLoading sold comps…