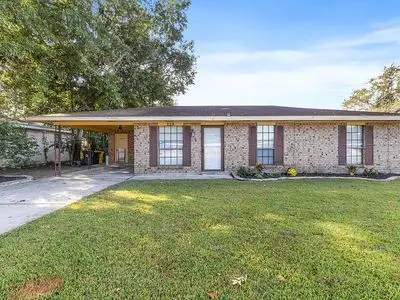
229 Auburn Dr · Carencro, LA
Flood risk 1/10 · Minimal
- FEMA flood zone
- X (unshaded)
- Chance of flooding over 30 yrs
- 0.0%
- Est. flood insurance / yr
- $507 – $1,088
Fire risk 2/10 · Minimal
- Est. fire insurance / yr
- $1,269 – $2,357
Heat risk 8/10 · Major
- Hot days now (above 109°F)
- 7 days/yr
- Hot days in 30 yrs
- 20 days/yr
Wind risk 9/10 · Severe
- Chance of severe wind over 30 yrs
- 99.0%
Air-quality risk 2/10 · Minimal
- Unhealthy air days now
- 1 days/yr
- Unhealthy air days in 30 yrs
- 1 days/yr
Risk factors via First Street. Map © Google.
Why this score? — see what drove the B grade
The composite is a weighted blend of 9 inputs, each scored 0–100. Each bar is that input's sub-score; the figure is the points it added to the 100-point composite (weight × sub-score).
- Cash flow +27.8/30.0
- ARV discount +15.0/15.0
- DSCR +9.8/10.0
- 1% rule +6.7/10.0
- Schools +3.6/10.0
- Livability +3.5/5.0
- Rent growth +2.5/5.0
- Condition / age +2.5/5.0
- Appreciation +0.0/10.0
$150,000
🖨 Deal sheet (PDF) 📄 Offer letter ✓ Due diligence
Listing remarks MLS
Enjoy this cozy 3 bed 2 bath home located in the heart of Carenrco. Upon entering you will find an open floor-plan with beautiful hardwood floors in the main living area and spacious bedrooms. Tile in the kitchen and bathroom areas. Relax and entertain under the large covered backyard patio. This home is well maintained with all of the important features updated recently. New roof, AC unit, electrical panel and privacy fence! Perfect opportunity for investors and first time home buyers. The property is located in Flood Zone X and qualifies as rural development.
Key facts
- New roof
- New hvac system
- Built 1985
Tags
Neighborhood map
What this means for you Summary
Snapshot
- This is a 3-bed/2.0-bath single-family listed at $150k.
Deal economics
- At list price, monthly cash flow is $459 ($6k/yr) — positive.
- The deal already cash-flows at list — no discount required.
- Meets the 1% rule at list price ($2k rent vs $150k).
- Recommended offer: $146k (3.0% below list) — sets the bar for market timing.
- Cap rate 10.0% vs local median 5.3% in Carencro — top-decile yield for the area; either an underpriced asset or a hidden risk that comps aren't pricing in. Stress-test before assuming the spread holds.
Location & tenants
- Location reads 69/100 on livability (#65 in LA) — a middle-class / working-renter tenant base. Strengths: cost of living A+, housing A+, health & safety A+; Watch: schools C-, employment C-, crime D.
- Lafayette Parish (urban): math 38% / reading 46% proficiency, ranked #19 of 98 in LA (top 19%) — families likely to look elsewhere, expect single-tenant / working-renter base with shorter leases.
- Market conditions: 280 active listings in the ZIP; 4 comparable units currently listed for rent nearby; rentals lingering (median 45d on market — plan ~5-8 weeks vacancy on turnover, expect pricing pressure); 75% of comp listings sitting > 30 days — soft ceiling on asking rent; 1,585 units permitted in Lafayette Parish in 2024 (10 in 5+ unit buildings).
Forward outlook
- Local home prices are declining (-3.0%/yr); year-one equity from $1k of loan paydown is wiped out by about $4k of value loss. Plan a longer hold.
- Lafayette County population projected at +34% by 2050 — long-run rental-demand tailwind backs the buy-and-hold thesis.
- At projected returns (-3.0% appreciation + 3.0% rent growth), your $42k cash investment doubles in ~9 years — after that, you're playing with house money.
Negotiation context
- It's been on market 35 days — a 3% lower offer ($146k) is reasonable based on typical stale-listing flexibility.
- 10 sale attempts since 24y ago with the ask held roughly flat each time — persistent listings suggest the price (not the market) is what's stuck; bring a comps-based counter.
- Current owner paid $109k; 38% above their basis — modest negotiation headroom, anchor on the comps not their cost.
Risks & watch-outs
- Climate carrying-cost: severe wind risk, 99% chance of damaging wind over 30y; extreme-heat days projected 7→20/yr by 2055 (HVAC capex compounding) — expect insurance premiums to compound above CPI over the hold.
Questions for the listing agent
- It's been on market 35 days. Have you received any prior offers? Is the seller open to a 3% concession, seller financing, or rate buy-down credit?
- Is there a deadline driving the sale (1031 exchange, divorce, estate, relocation)? That informs how much negotiation room exists.
- Crime grade is D in this area — have there been break-ins, vandalism, or insurance claims at this property in the last 3 years? What carrier currently insures it and at what premium?
- What's the average days-on-market for RENTAL listings here right now (not sales)? A rising rental-DOM trend means longer vacancies and softer asking-rent achievability than the comps imply.
- What's the recent tenant-quality profile in this submarket — average credit score on applications, eviction rate, late-payment / NSF rate, and stable-employment percentage? A property-management company in the area should have these aggregated.
- How much new for-sale + rental construction is in the pipeline within 1–3 miles? Heavy new supply typically softens prices + rents 12–24 months out; constrained supply supports both.
Investment metrics
- 1% rule
- 1.17% ✓
- Cap rate
- 9.97%
- Cash-on-cash
- 13.13%
- DSCR
- 1.58
- GRM
- 7.1
CMA / ARV
- ARV (on-the-fly)
- $194,835
- Comps found
- 12
Show comp detail 12 sales within ~0.75 mi
| Address | Dist | Beds/Ba | Sqft | Sold | Price | $/sf | Match |
|---|---|---|---|---|---|---|---|
| 214 Hester Way | 0.23mi | 3/2.0 | 1,283 (+2%) | 3mo | $210,700 | $164 | 84 |
| 215 Hester Way | 0.22mi | 3/2.0 | 1,225 (-2%) | 3mo | $207,775 | $170 | 83 |
| 218 Hester Way | 0.24mi | 3/2.0 | 1,283 (+2%) | 8mo | $209,895 | $164 | 79 |
| 405 Auburn Dr | 0.26mi | 3/2.0 | 1,345 (+7%) | 2mo | $135,000 | $100 | 74 |
| 209 Hester Way | 0.21mi | 2/2.0 (-1) | 1,190 (-5%) | 6mo | $205,695 | $173 | 71 |
| 129 Bradford Dr | 0.25mi | 3/1.5 | 1,362 (+8%) | 3mo | $72,800 | $53 | 70 |
| 209 Cainwood Ct | 0.46mi | 3/2.0 | 1,321 (+5%) | 3mo | $210,787 | $160 | 68 |
| 302 Auburn Dr | 0.12mi | 3/1.0 | 1,100 (-12%) | 7mo | $75,000 | $68 | 64 |
| 314 Auburn Dr | 0.18mi | 3/1.0 | 1,100 (-12%) | 7mo | $75,000 | $68 | 61 |
| 102 Linares St | 0.32mi | 3/2.0 | 1,427 (+14%) | 2mo | $162,000 | $114 | 61 |
| 211 Cainwood Ct | 0.47mi | 3/2.0 | 1,422 (+13%) | 2mo | $220,177 | $155 | 54 |
| 902 Pelican Ridge Cv | 0.70mi | 3/2.0 | 1,410 (+12%) | 1mo | $200,000 | $142 | 46 |
Match score weights: distance 35% · size 25% · config 20% · recency 20%. Top-matched comps best support the ARV.
Projected returns pro-forma
-3.0% appreciation · 3.0% rent growth · sell at horizon
- IRR
- 3.0%
- Equity multiple
- 1.12×
- Total profit
- $4,918
- Equity at exit
- $22,365
- IRR
- 12.6%
- Equity multiple
- 2.00×
- Total profit
- $41,806
- Equity at exit
- $12,969
Cash invested: $42,000 (down + closing). Projections, not guarantees.
Landlord ↔ Tenant lean methodology
- Overall (STATE)
- 90 Strongly Landlord-Friendly
- State Louisiana
- 90 Strongly Landlord-Friendly · R+12
- County
- — inherits STATE
- City
- — inherits STATE
ZIP-level market 70520
- Home prices YoY
- -17.6%
- Active inventory
- 280
- Price-to-rent
- 7.1×
Monthly cashflow live
- Estimated rent
- $1,759 medium interval (Pro) →
- Mortgage (P&I)
- −$787
- Tax from tax record
- −$81 /mo · $976/yr
- Insurance
- −$62
- HOA
- −$0
- Vacancy / Maint / Mgmt
- −$369
- Net cashflow
- $459
Break-even live
Sensitivity live
| Price | -10% $544 | -5% $502 | +0% $459 | +5% $417 | +10% $375 |
|---|---|---|---|---|---|
| Rent | -10% $320 | -5% $390 | +0% $459 | +5% $529 | +10% $598 |
| Rate | -1.0pp $535 | -0.5pp $498 | base $459 | +0.5pp $421 | +1.0pp $381 |
UW: 25.0% down · 7.5% · 30yr · 1.5% tax · 5.0% vac · 8.0% maint · 8.0% mgmt
Financing live
Cash to close
- Down payment
- $37,500
- Closing costs
- $4,500
- Reserves months
- —
- Total cash needed
- —
Loan-product check · same deal, 3 products live
Conventional
25% down · 7.5% · 30yr
- Down + closing
- —
- Monthly P&I
- —
- Monthly cashflow
- —
- DSCR
- —
- Eligible?
- —
Personal DTI + credit; lowest rate.
DSCR
20% down · 8.5% · 30yr
- Down + closing
- —
- Monthly P&I
- —
- Monthly cashflow
- —
- DSCR
- —
- Eligible?
- —
No personal income docs; deal must DSCR.
Hard money
10% down · 12.0% · 12mo
- Down + closing
- —
- Monthly P&I
- —
- Monthly cashflow
- —
- DSCR
- —
- Eligible?
- —
Short-term bridge; refi at stabilization.
Rent comps 4 comps
| Address | Beds | Baths | Sqft | Rent | $/sqft | DOM | Units | Dist |
|---|---|---|---|---|---|---|---|---|
| 219 Oak Path Dr Carencro, LA | 3.0 | 2.0 | 1615 | $1,900 | $1.18 | 44d | 1 | 0.58mi |
| 115 Northpointe Dr Carencro, LA | 3.0 | 2.0 | 1696 | $1,650 | $0.97 | 44d | 1 | 1.18mi |
| 124 Saint Fabian Dr Carencro, LA | 3.0 | 2.0 | 1450 | $1,700 | $1.17 | 44d | 1 | 1.21mi |
| 124 Saint Fabian Dr Carencro, LA | 3.0 | 2.0 | 1441 | $1,650 | $1.15 | 21d | 1 | 1.21mi |
Listing history 36 events
-
2026-06-18days on market $150,000 Active 35 DOM
-
2026-06-17days on market $150,000 Active 34 DOM
-
2026-06-16days on market $150,000 Active 33 DOM
-
2026-06-15days on market $150,000 Active 32 DOM
-
2026-06-14days on market $150,000 Active 30 DOM
-
2026-06-13days on market $150,000 Active 29 DOM
-
2026-06-10days on market $150,000 Active 27 DOM
-
2026-06-09days on market $150,000 Active 26 DOM
-
2026-06-08days on market $150,000 Active 25 DOM
-
2026-06-07days on market $150,000 Active 24 DOM
-
2026-06-05days on market $150,000 Active 21 DOM
-
2026-06-03days on market $150,000 Active 20 DOM
-
2026-06-02days on market $150,000 Active 19 DOM
-
2026-06-01days on market $150,000 Active 18 DOM
-
2026-05-31days on market $150,000 Active 17 DOM
-
2026-05-30days on market $150,000 Active 16 DOM
-
2026-05-14$150,000 Active 178-char remark
-
2025-02-26historical $1,200
-
2025-02-21$1,200
-
2024-12-21price $149,500
-
2024-11-01price $155,000
-
2024-11-01status Active
-
2024-10-28status Pending
-
2024-10-23$150,000 Active
-
2018-07-27soldstatus $109,000
-
2018-07-27soldstatus $109,000
-
2018-01-19$108,000
-
2011-04-29soldstatus $107,500
-
2011-04-27soldstatus $107,500
-
2010-09-11$105,500
-
2007-12-26soldstatus $93,000
-
2007-12-26soldstatus
-
2007-06-08$99,700
-
2007-06-08$120,000
-
2003-02-12soldstatus $63,800
-
2002-12-07$63,800
ⓘ Source: listings_history table (triggers on properties + properties_extension) + one-shot
backfill from property_details.listing_events for pre-trigger history.
Tax reassessment forecast LA · Resets to sale price
- Current annual tax
- $976 · $81/mo
- Projected year-2 tax
- $976 · $81/mo
- Expected delta
- $0/yr ($0/mo · 0.0%)
ⓘ Screening estimate from a state-policy table — verify with the county assessor before closing.
Climate risk First Street
- Flood 1/10 Low FEMA zone X (unshaded) · 0% chance over 30 yrs
- Wildfire 2/10 Low
- Heat 8/10 Severe 7 d/yr ≥109°F today · 20 d/yr by 30 yrs out
- Wind 9/10 Extreme 99% chance of damaging wind over 30 yrs
- Air quality 2/10 Low 1 unhealthy d/yr today · 1 by 30 yrs out
Nearby sold comps map
Loading sold comps map…
Walkable amenities ~0.75 mi
Loading nearby amenities…
Taxation est. · year 1
- Rental income
- $21,112
- − Mortgage interest
- −$8,402
- − Property taxes
- −$976
- − Insurance
- −$750
- − Repairs & maintenance
- −$1,689
- − Management
- −$1,689
- − Depreciation
- −$4,364
- Taxable income
- $3,242
- Est. tax owed @ 24.0%
- −$778
- After-tax cash flow
- $4,735/yr
For passive investors: Depreciation is non-cash, so a rental often shows a tax loss while cash-flowing — sheltering income. Rental losses are passive: they offset passive income freely, and up to $25,000/yr can offset ordinary (W-2) income if you actively participate and your MAGI is under $100k (phasing out to $0 by $150k); unused losses carry forward. On sale, claimed depreciation is recaptured at up to 25%, and gains may owe capital-gains tax (a 1031 exchange can defer both). Figures are a year-1 estimate at your 24.0% rate — not tax advice; consult a CPA.
Schools (NCES district)
- District
- Lafayette Parish
- NCES district ID
- 2200870
- Math proficiency
- 38% ▼ -32.00%
- Reading proficiency
- 46% ▼ -24.00%
- Median HH income
- $50,238
- Composite
- 36.15/100
- National rank
- #4741
- State rank
- #19 of 98 in LA
Livability — Carencro
- Score
- 69/100
- State rank
- #65
- US rank
- #8277
Category grades
Schools grade is shown separately in the Schools card above.
Census & demographics
- City population
- 20,134
- Population (ZIP)
- 20,134
Population outlook (Lafayette County) Hauer SSP2
- Today (2025)
- 280,930 people
- By 2030
- 301,092 · +7.2%
- By 2040
- 339,456 · +20.8%
- By 2050
- 375,156 · +33.5%
- By 2075
- 451,672 · +60.8%
- By 2100
- 497,203 · +77.0%
Race, ethnicity, and origin ACS 2023
- Neighborhood character
- Diverse neighborhood (Simpson 0.56)
- Race & ethnicity
- White 58% Black 32% Two or more races 5% Hispanic / Latino 3% Asian 2%
- Common ancestry
- Lithuanian 13% Scotch-Irish 2% Italian 1%
- Foreign-born
- 2% · Canada
- Languages at home
- 92% English-only · French/Haitian/Cajun 5% Spanish 1% Other Indo-European 1%
Political lean MEDSL · Lafayette
- 2024 margin
- Solid R (+31.4) · D 33.5% · R 64.8% · Other 1.7%
- 2008→2024 swing
- -0.1pp no change · 2008: -31.3pp · 2024: -31.4pp
- All cycles
- 2024: R+31.4 2020: R+28.7 2016: R+33.6 2012: R+33.7 2008: R+31.3
Not yet ingested
- Civics
- —
Market trends
- HPI YoY
- ▼ -33.62%
- Current HPI
- 157.0194
- Rent YoY
- —
- Metro
- —
- State GDP YoY
- ▲ 3.29%
- F500 in state
- 10
Industry mix (Fortune 500 HQ in LA)
| Industry | F500 HQs | Revenue |
|---|---|---|
| Telecommunications | 2 | $23B |
|
||
| Utilities | 1 | $12B |
|
||
| Wholesale / Distribution | 1 | $5B |
|
||
| Advertising | 1 | $2B |
|
||
Price history
+135.1% since first listed21 events — show timeline
- 2026-06-04 Listed $150,000 ForSaleByOwner.com
- 2026-05-14 Listed $150,000 FSBO.com
- 2025-02-26 Rental Removed $1,200 RAAMLS
- 2025-02-21 Listed for Rent $1,200 RAAMLS
- 2024-12-21 Price Changed $149,500 AcadianaMLS
- 2024-11-01 Price Changed $155,000 AcadianaMLS
- 2024-11-01 Relisted — AcadianaMLS
- 2024-10-28 Pending — AcadianaMLS
- 2024-10-23 Listed $150,000 AcadianaMLS
- 2018-07-27 Sold (Public Records) $109,000 Public Records
- 2018-07-27 Sold (MLS) $109,000 AcadianaMLS
- 2018-01-19 Listed $108,000 AcadianaMLS
- 2011-04-29 Sold (Public Records) $107,500 Public Records
- 2011-04-27 Sold (MLS) $107,500 AcadianaMLS
- 2010-09-11 Listed $105,500 AcadianaMLS
- 2007-12-26 Sold (Public Records) — Public Records
- 2007-12-26 Sold (MLS) $93,000 AcadianaMLS
- 2007-06-08 Listed $120,000 AcadianaMLS
- 2007-06-08 Listed $99,700 AcadianaMLS
- 2003-02-12 Sold (MLS) $63,800 AcadianaMLS
- 2002-12-07 Listed $63,800 AcadianaMLS
Property tax history
+16.4%/yrLatest (2025): $976 · -1.3% YoY. Source: county tax records.
Cash-flow waterfall
monthlySold comps — $/sqft
last 12 mo · ≤1 miLoading sold comps…