 Duplex
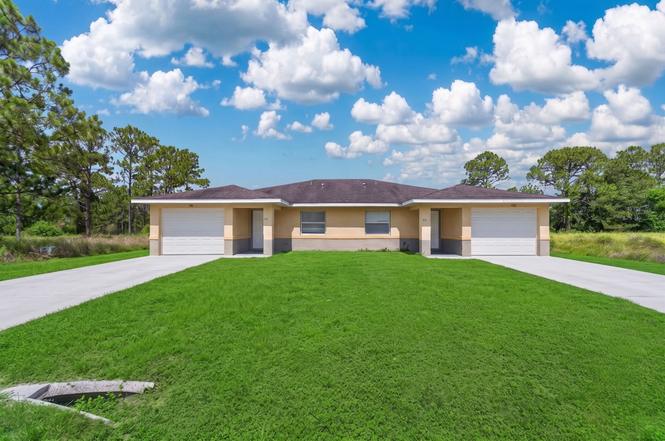
772-774 Holmes Ave · Lehigh Acres, FL
Flood risk No data
- FEMA flood zone
- —
- Chance of flooding over 30 yrs
- —
- Est. flood insurance / yr
- —
Fire risk No data
- Est. fire insurance / yr
- —
Heat risk No data
- Hot days now (above threshold)
- —
- Hot days in 30 yrs
- —
Wind risk No data
- Chance of severe wind over 30 yrs
- —
Air-quality risk No data
- Unhealthy air days now
- —
- Unhealthy air days in 30 yrs
- —
Risk factors via First Street. Map © Google.
Why this score? — see what drove the C grade
The composite is a weighted blend of 9 inputs, each scored 0–100. Each bar is that input's sub-score; the figure is the points it added to the 100-point composite (weight × sub-score).
- Cash flow +17.4/30.0
- Appreciation +10.0/10.0
- ARV discount +7.5/15.0
- DSCR +5.4/10.0
- 1% rule +4.7/10.0
- Schools +4.1/10.0
- Livability +3.0/5.0
- Condition / age +2.5/5.0
- Rent growth +1.3/5.0
$367,000
🖨 Deal sheet 📄 Offer letter ✓ Due diligence
Multi-family units
County records classify this as Multi-Family (2-4 Unit). Listing-text estimate: 2 units. confirmed
Listing remarks
Excellent investment opportunity at 772/774 Holmes Ave in Lehigh Acres! This well-maintained duplex, built in 2015, offers two spacious 3-bedroom, 2-bath units—each with its own 1-car garage and private entrance, providing both comfort and privacy. Each unit features an open-concept floor plan with tile flooring throughout, large rooms and functional kitchens complete with solid surface countertops, breakfast bars, and ample cabinetry. The primary suites include dual closets, and both units offer open rear patios—perfect for relaxing or entertaining. One side is currently tenant-occupied, providing immediate rental income, while the other unit is ready for occupancy—ideal
Key facts
- Cathedral ceilings
- Private entrance
- Tile flooring
Tags
Property features AI
Exterior
- Parking: Garage
- Home design: Multi-family property; 2 total units
Interior
- Bedrooms: 6 bedrooms
- Bathrooms: 4 bathrooms
- Interior features: Air conditioning
Neighborhood map
What this means for you Summary
Snapshot
- This is a 2 × 3-bed/2.0-bath units multifamily listed at $367k.
Deal economics
- At list price, monthly cash flow is $273 ($3k/yr) — positive. Per door: $136/mo.
- The deal already cash-flows at list — no discount required.
- To meet the 1% rule (rent ≥ 1% of price), the offer needs to be $356k (3.1% below list).
- Recommended offer: $356k (3.1% below list) — sets the bar for 1% rule.
- Cap rate 7.2% vs local median 4.7% in Lehigh Acres — top-decile yield for the area; either an underpriced asset or a hidden risk that comps aren't pricing in. Stress-test before assuming the spread holds.
Location & tenants
- Location reads 59/100 on livability (#826 in FL) — a working-class tenant base; expect higher turnover. Strengths: cost of living A+, housing A+; Watch: crime C-, employment D+, schools D-.
- Lee (suburban): math 47% / reading 50% proficiency, ranked #42 of 73 in FL (top 58%) — families likely to look elsewhere, expect single-tenant / working-renter base with shorter leases.
- Market conditions: Rents falling (-4.7%/yr); 2460 active listings in the ZIP; 27 comparable units currently listed for rent nearby; rentals leasing fast (median 12d on market — plan ~1-2 weeks tenant-placement turnaround); 15,411 units permitted in Lee County in 2024 (4,686 in 5+ unit buildings).
- At $3,556/mo this rent would consume 59% of the median local household income ($72k/yr) (locally 434% of renters already pay >50% of income on rent) — very limited rent-growth headroom before tenants either downsize or default.
Forward outlook
- In year one you build about $39k of equity ($3k loan paydown + $37k appreciation (10.0% local appreciation)).
- Lee County population projected at +44% by 2050 — long-run rental-demand tailwind backs the buy-and-hold thesis.
- At projected returns (10.0% appreciation + 0.0% rent growth), your $103k cash investment doubles in ~3 years — after that, you're playing with house money.
- By year 2, paydown + projected appreciation supports a ~$63k cash-out refi (75% LTV) — recoverable capital for the next deal without selling this one.
Negotiation context
- Only 1 days on market — expect competitive offers; lowballing is unlikely to land.
Questions for the listing agent
- Can we see the unit-by-unit rent roll, current vacancy, and any below-market leases? What's the average tenancy length?
- What capital expenditures (roof, boiler, parking lot, exteriors) have been made in the last 5 years, and what's planned in the next 2?
- Is there a deadline driving the sale (1031 exchange, divorce, estate, relocation)? That informs how much negotiation room exists.
- Schools are D-rated, which usually means shorter tenancies and higher turnover. Who's the typical renter profile here, and what's been the actual vacancy rate?
- What's the average days-on-market for RENTAL listings here right now (not sales)? A rising rental-DOM trend means longer vacancies and softer asking-rent achievability than the comps imply.
- What's the recent tenant-quality profile in this submarket — average credit score on applications, eviction rate, late-payment / NSF rate, and stable-employment percentage? A property-management company in the area should have these aggregated.
- How much new apartment / multifamily construction is in the pipeline within 1–3 miles? Heavy new supply (>2% of stock underway) typically softens rents 12–24 months out; light construction supports rent growth.
Investment metrics
- 1% rule
- 0.97% ✗
- Cap rate
- 7.19%
- Cash-on-cash
- 3.19%
- DSCR
- 1.14
- GRM
- 8.6
CMA / ARV
No comps found within radius.
Projected returns pro-forma
10.0% appreciation · 0.0% rent growth · sell at horizon
- IRR
- 25.5%
- Equity multiple
- 3.01×
- Total profit
- $206,897
- Equity at exit
- $330,623
- IRR
- 21.7%
- Equity multiple
- 6.62×
- Total profit
- $577,051
- Equity at exit
- $713,000
Cash invested: $102,760 (down + closing). Projections, not guarantees.
Landlord ↔ Tenant lean methodology
- Overall (STATE)
- 87 Strongly Landlord-Friendly
- State Florida
- 87 Strongly Landlord-Friendly · R+3
- County
- — inherits STATE
- City
- — inherits STATE
ZIP-level market 33974
- Home prices YoY
- 5.8%
- Rents YoY
- -4.7%
- Active inventory
- 2460
- Price-to-rent
- 17.2×
Monthly cashflow live
- Estimated rent
- $3,556 high interval (Pro) →
- Mortgage (P&I)
- −$1,925
- Tax est. 1.5%
- −$459 /mo · $5,505/yr
- Insurance
- −$153
- HOA
- −$0
- Vacancy / Maint / Mgmt
- −$747
- Net cashflow
- $273
Break-even live
2-unit breakdown (identical units grouped — click to expand)
| Units | Beds | Baths | Est. rent |
|---|---|---|---|
| 2× units | 3 | 2 | $3,556 |
| #1 | 3 | 2 | $1,778 |
| #2 | 3 | 2 | $1,778 |
| Total (2 units) | $3,556 | ||
UW: 25.0% down · 7.5% · 30yr · 1.5% tax · 5.0% vac · 8.0% maint · 8.0% mgmt
Financing live
Cash to close
- Down payment
- $91,750
- Closing costs
- $11,010
- Reserves months
- —
- Total cash needed
- —
Loan-product check · same deal, 3 products live
Conventional
25% down · 7.5% · 30yr
- Down + closing
- —
- Monthly P&I
- —
- Monthly cashflow
- —
- DSCR
- —
- Eligible?
- —
Personal DTI + credit; lowest rate.
DSCR
20% down · 8.5% · 30yr
- Down + closing
- —
- Monthly P&I
- —
- Monthly cashflow
- —
- DSCR
- —
- Eligible?
- —
No personal income docs; deal must DSCR.
Hard money
10% down · 12.0% · 12mo
- Down + closing
- —
- Monthly P&I
- —
- Monthly cashflow
- —
- DSCR
- —
- Eligible?
- —
Short-term bridge; refi at stabilization.
Rent comps 27 comps
| Address | Beds | Baths | Sqft | Rent | $/sqft | DOM | Units | Dist |
|---|---|---|---|---|---|---|---|---|
| 827 Eisenhower Blvd Lehigh Acres, FL | 3.0 | 2.5 | 1640 | $1,780 | $1.09 | 11d | 1 | 0.28mi |
| 851 Eisenhower Blvd Lehigh Acres, FL | 3.0 | 2.0 | 2330 | $1,450 | $0.62 | 10d | 1 | 0.40mi |
| 851 Bedford Dr Lehigh Acres, FL | 3.0 | 2.0 | 2364 | $1,600 | $0.68 | 23d | 1 | 0.46mi |
| 828 Genoa Ave S Lehigh Acres, FL | 4.0 | 2.5 | 1632 | $2,400 | $1.47 | 23d | 1 | 0.65mi |
| 862 Charles Sise St E Lehigh Acres, FL | 3.0 | 2.0 | 1582 | $2,664 | $1.68 | 23d | 1 | 0.67mi |
| 710 Godwid Ave S Lehigh Acres, FL | 3.0 | 2.0 | 1758 | $2,150 | $1.22 | 2d | 1 | 0.76mi |
| 710 Godwid Ave S Lehigh Acres, FL | 3.0 | 2.0 | 1758 | $2,150 | $1.22 | 3d | 1 | 0.76mi |
| 710 Godwid Ave S Lehigh Acres, FL | 3.0 | 2.0 | 1758 | $2,150 | $1.22 | 21d | 1 | 0.76mi |
| 908 Winters St E Lehigh Acres, FL | 3.0 | 2.0 | 1639 | $2,200 | $1.34 | 10d | 1 | 0.76mi |
| 708 Godwid Ave S Lehigh Acres, FL | 3.0 | 2.0 | 1758 | $2,150 | $1.22 | 21d | 1 | 0.76mi |
| 847 Genoa Ave Lehigh Acres, FL | 3.0 | 2.0 | 1600 | $2,000 | $1.25 | 3d | 1 | 0.77mi |
| 760 Festival Ave S Lehigh Acres, FL | 3.0 | 2.0 | 1650 | $2,000 | $1.21 | 23d | 1 | 0.86mi |
| 928 Milwaukee Blvd Lehigh Acres, FL | 4.0 | 2.0 | 1719 | $1,990 | $1.16 | 23d | 1 | 0.87mi |
| 941 Elgin St Lehigh Acres, FL | 3.0 | 2.0 | 1582 | $2,664 | $1.68 | 23d | 1 | 0.95mi |
| 1147 Antonio St E Lehigh Acres, FL | 3.0 | 2.0 | 1713 | $2,300 | $1.34 | 1d | 1 | 1.01mi |
| 936 Joponica Ave S Lehigh Acres, FL | 4.0 | 2.0 | 2101 | $2,500 | $1.19 | 23d | 1 | 1.05mi |
| 814 Crystal Ave S Lehigh Acres, FL | 3.0 | 2.0 | 1865 | $1,815 | $0.97 | 23d | 1 | 1.13mi |
| 556 Sherwood Ave S Lehigh Acres, FL | 3.0 | 2.0 | 1582 | $2,175 | $1.37 | 23d | 1 | 1.14mi |
| 765 Aprile Ave S Lehigh Acres, FL | 4.0 | 2.0 | 1712 | $2,100 | $1.23 | 1d | 1 | 1.16mi |
| 541 Hawthorne Ave S Lehigh Acres, FL | 3.0 | 2.0 | 1634 | $1,921 | $1.18 | 3d | 1 | 1.21mi |
| 728 Crestline Ave S Lehigh Acres, FL | 4.0 | 3.0 | 1904 | $2,000 | $1.05 | 21d | 1 | 1.21mi |
| 751 Milano Ave S Lehigh Acres, FL | 4.0 | 3.0 | 2263 | $2,500 | $1.10 | 1d | 1 | 1.23mi |
| 934 Marilyn Ave S Lehigh Acres, FL | 4.0 | 2.0 | 1577 | $2,000 | $1.27 | 2d | 1 | 1.29mi |
| 934 Marilyn Ave S Lehigh Acres, FL | 4.0 | 2.0 | 1577 | $2,000 | $1.27 | 11d | 1 | 1.29mi |
| 715 Bering Ave S Lehigh Acres, FL | 3.0 | 2.0 | 1835 | $1,895 | $1.03 | 21d | 1 | 1.34mi |
| 1089 Eisenhower Blvd Lehigh Acres, FL | 4.0 | 2.0 | 1639 | $2,000 | $1.22 | 3d | 1 | 1.46mi |
| 530 Kilgour Ave Lehigh Acres, FL | 3.0 | 2.0 | 2214 | $1,795 | $0.81 | 3d | 1 | 1.47mi |
Listing history 2 events
-
2026-06-19remarks 681-char remark
-
2026-06-19$367,000 Coming Soon 1 DOM
ⓘ Source: listings_history table (triggers on properties + properties_extension) + one-shot
backfill from property_details.listing_events for pre-trigger history.
Nearby sold comps map
Loading sold comps map…
Walkable amenities ~0.75 mi
Loading nearby amenities…
Taxation est. · year 1
- Rental income
- $42,672
- − Mortgage interest
- −$20,558
- − Property taxes
- −$5,505
- − Insurance
- −$1,835
- − Repairs & maintenance
- −$3,414
- − Management
- −$3,414
- − Depreciation
- −$10,676
- Taxable loss
- −$2,730
- Est. tax savings @ 24.0%
- +$655
- After-tax cash flow
- $3,931/yr
For passive investors: Depreciation is non-cash, so a rental often shows a tax loss while cash-flowing — sheltering income. Rental losses are passive: they offset passive income freely, and up to $25,000/yr can offset ordinary (W-2) income if you actively participate and your MAGI is under $100k (phasing out to $0 by $150k); unused losses carry forward. On sale, claimed depreciation is recaptured at up to 25%, and gains may owe capital-gains tax (a 1031 exchange can defer both). Figures are a year-1 estimate at your 24.0% rate — not tax advice; consult a CPA.
Schools (NCES district)
- District
- Lee
- NCES district ID
- 1201080
- Math proficiency
- 47% ▼ -11.00%
- Reading proficiency
- 50% ▼ -4.00%
- Median HH income
- $49,518
- Composite
- 41.49/100
- National rank
- #3458
- State rank
- #42 of 73 in FL
Livability — Lehigh Acres
- Score
- 59/100
- State rank
- #826
- US rank
- #20055
Category grades
Schools grade is shown separately in the Schools card above.
Census & demographics
- Census place
- Lehigh Acres, FL
- County
- Lee County · 788,662 people
- City population
- 130,638
- Metro
- Cape Coral-Fort Myers, FL
- Population (ZIP)
- 19,927
- Household income
- $72,192
- Rent vs Own
- Severe rent burden
- 434.0
Population outlook (Lee County) Hauer SSP2
- Today (2025)
- 871,946 people
- By 2030
- 955,468 · +9.6%
- By 2040
- 1,113,587 · +27.7%
- By 2050
- 1,256,891 · +44.1%
- By 2075
- 1,560,270 · +78.9%
- By 2100
- 1,726,848 · +98.0%
Race, ethnicity, and origin ACS 2023
- Neighborhood character
- Diverse neighborhood (Simpson 0.64)
- Race & ethnicity
- Hispanic / Latino 52% Two or more races 31% White 26% Black 18%
- Hispanic origin (detail)
- Mexican 12% Puerto Rican 7% Cuban 20% Dominican 4%
- Common ancestry
- Hispanic 7% Italian 1% Portuguese 1%
- Foreign-born
- 32% · Canada, Jamaica
- Languages at home
- 48% English-only · Spanish 43% French/Haitian/Cajun 7% Other Indo-European 1%
Political lean MEDSL · Lee
- 2024 margin
- Strong R (+28.4) · D 35.5% · R 63.9%
- 2008→2024 swing
- -18.0pp toward R · 2008: -10.4pp · 2024: -28.4pp
- All cycles
- 2024: R+28.4 2020: R+19.2 2016: R+20.4 2012: R+16.6 2008: R+10.4
Not yet ingested
- Civics
- —
Market trends
- HPI YoY
- ▲ 16.53%
- Current HPI
- 303.3399
- Rent YoY
- ▼ -4.68%
- Metro
- Cape Coral-Fort Myers, FL
- State GDP YoY
- ▲ 3.28%
- F500 in state
- 36
Industry mix (Fortune 500 HQ in FL)
| Industry | F500 HQs | Revenue |
|---|---|---|
| Industrial Technology | 2 | $29B |
|
||
| Insurance | 2 | $17B |
|
||
| Retail | 1 | $60B |
|
||
| Technology Distribution | 1 | $58B |
|
||
| Homebuilding | 1 | $35B |
|
||
| Technology Manufacturing | 1 | $35B |
|
||
Cash-flow waterfall
monthlySold comps — $/sqft
last 12 mo · ≤1 miLoading sold comps…