 🌊 Lakefront
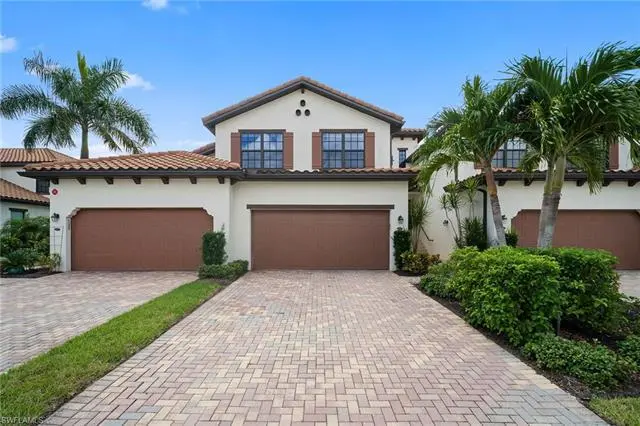
11879 Arboretum Run Dr #201 · Fort Myers, FL
Flood risk 1/10 · Minimal
- FEMA flood zone
- X (unshaded)
- Chance of flooding over 30 yrs
- 0.0%
- Est. flood insurance / yr
- $507 – $1,088
Fire risk 4/10 · Minor
- Est. fire insurance / yr
- $947 – $1,759
Heat risk 9/10 · Severe
- Hot days now (above 107°F)
- 7 days/yr
- Hot days in 30 yrs
- 28 days/yr
Wind risk 10/10 · Severe
- Chance of severe wind over 30 yrs
- 99.0%
Air-quality risk 2/10 · Minimal
- Unhealthy air days now
- 1 days/yr
- Unhealthy air days in 30 yrs
- 1 days/yr
Risk factors via First Street. Map © Google.
Why this score? — see what drove the C+ grade
The composite is a weighted blend of 9 inputs, each scored 0–100. Each bar is that input's sub-score; the figure is the points it added to the 100-point composite (weight × sub-score).
- Cash flow +23.7/30.0
- 1% rule +7.6/10.0
- DSCR +7.6/10.0
- ARV discount +7.5/15.0
- Livability +4.3/5.0
- Schools +4.1/10.0
- Rent growth +2.6/5.0
- Condition / age +2.5/5.0
- Appreciation +0.0/10.0
$435,000
🖨 Deal sheet 📄 Offer letter ✓ Due diligence
Listing remarks
Experience resort-style Southwest Florida living with this spacious lake-front Coach style home built in 2019. Developed by Lennar and nestled in the desirable Arborwood Preserve community, this home is a 3 bed 2 bath residence that offers over 2,200 square feet featuring an open-concept layout that is abundant in natural light and space- perfect for both entertaining and comfort. The expansive layout flows seamlessly from the kitchen into the oversized living and dining areas and is up to date both in appliances and appearance. Inside contains a remodeled stairway, a gorgeous ten foot glass chandelier, and porcelain tile throughout. The kitchen features quartz countertops, upgraded cabinet
Key facts
- $935 HOA
- 2 garage spots
- Community pool
Property features AI
Finance
- Other: Unit in a 4-unit building (1 unit per floor); 4 units in complex; 2 total floors in building; Possession at closing
- Financial info: Total annual recurring fees reported; Total one-time fees reported
- HOA & community: Mandatory HOA/Condo association; Quarterly master HOA fee; Quarterly condo fee; Master HOA fee charged quarterly; Condo management; Community amenities include: Bocce court, business center, clubhouse, community pool, exercise room, attended fitness center, internet access, pickleball, restaurant, tennis court, theater; Community type: Condo/hotel
Exterior
- Parking: Attached 2-car garage
- Security: Gated community
- Utilities: Central water; Central sewer; Cable available
- Home design: Residential property; 2-story carriage/coach style; Low rise (1-3) building; Rear exposure faces SE; Located in Arborwood Preserve
- Construction: Concrete block construction; Built in 2019
- Exterior features: Tile roof; Stucco exterior; Impact resistant windows; Pond view; Lake waterfront/irrigation; See remarks for windows
Interior
- Kitchen: Dishwasher; Disposal; Microwave; Range; Refrigerator
- Bedrooms: 3 bedrooms
- Flooring: Tile
- Bathrooms: 2 full bathrooms; Master bathroom with dual sinks and shower (no tub)
- Heating & cooling: Central electric heat; Central electric cooling
- Interior features: Pantry; Walk-in closet; Dining area (family); Family room; Guest room; Guest bath; Home office; Screened lanai/porch; Unfurnished
- Laundry & utility: Laundry in residence
Neighborhood map
What this means for you Summary
Snapshot
- This is a 3-bed/2.0-bath condo listed at $435k.
Deal economics
- At list price, monthly cash flow is $831 ($10k/yr) — positive.
- The deal already cash-flows at list — no discount required.
- Meets the 1% rule at list price ($5k rent vs $435k).
- Recommended offer: $422k (3.0% below list) — sets the bar for market timing.
- Cap rate 8.6% vs local median 3.0% in Fort Myers — top-decile yield for the area; either an underpriced asset or a hidden risk that comps aren't pricing in. Stress-test before assuming the spread holds.
Location & tenants
- Location reads 86/100 on livability (#14 in FL, #383 nationally) — a professional / high-income tenant draw. Strengths: amenities A+, commute A+, housing A+.
- Lee (suburban): math 47% / reading 50% proficiency, ranked #42 of 73 in FL (top 58%) — families likely to look elsewhere, expect single-tenant / working-renter base with shorter leases.
- Market conditions: Rents flat; 811 active listings in the ZIP; 20 comparable units currently listed for rent nearby; rentals at typical pace (median 24d on market — plan ~3-4 weeks tenant-placement turnaround); high-income renter base; 15,411 units permitted in Lee County in 2024 (4,686 in 5+ unit buildings).
- At $5,484/mo this rent would consume 60% of the median local household income ($110k/yr) (locally 276% of renters already pay >50% of income on rent) — very limited rent-growth headroom before tenants either downsize or default.
Forward outlook
- Local home prices are declining (-3.0%/yr); year-one equity from $3k of loan paydown is wiped out by about $13k of value loss. Plan a longer hold.
- Lee County population projected at +44% by 2050 — long-run rental-demand tailwind backs the buy-and-hold thesis.
Negotiation context
- It's been on market 51 days — a 3% lower offer ($422k) is reasonable based on typical stale-listing flexibility.
- 2 sale attempts with the ask held roughly flat each time — persistent listings suggest the price (not the market) is what's stuck; bring a comps-based counter.
Risks & watch-outs
- Climate carrying-cost: severe wind risk, 99% chance of damaging wind over 30y; extreme-heat days projected 7→28/yr by 2055 (HVAC capex compounding) — expect insurance premiums to compound above CPI over the hold.
Questions for the listing agent
- It's been on market 51 days. Have you received any prior offers? Is the seller open to a 3% concession, seller financing, or rate buy-down credit?
- What does the HOA fee cover, when was the last increase, and are there any pending special assessments or reserve-fund shortfalls?
- Any open or pending special assessments — roof, HVAC, plumbing, elevator, façade? What's the per-unit balance and payoff schedule, and is the seller paying it off at close or rolling it to the buyer?
- Is there a deadline driving the sale (1031 exchange, divorce, estate, relocation)? That informs how much negotiation room exists.
- This sits on a lake — are riparian / water-frontage rights deeded with the parcel? Any dock permits, shoreline easements, or HOA water-use restrictions?
- What's the documented flood / surge / shoreline-erosion history here (FEMA AND non-FEMA — e.g., storm surge, creek backup, septic-field saturation)?
- Any water-quality or seasonal algae-bloom issues that affect tenant satisfaction or short-term-rental demand?
- What's the average days-on-market for RENTAL listings here right now (not sales)? A rising rental-DOM trend means longer vacancies and softer asking-rent achievability than the comps imply.
- What's the recent tenant-quality profile in this submarket — average credit score on applications, eviction rate, late-payment / NSF rate, and stable-employment percentage? A property-management company in the area should have these aggregated.
- How much new apartment / multifamily construction is in the pipeline within 1–3 miles? Heavy new supply (>2% of stock underway) typically softens rents 12–24 months out; light construction supports rent growth.
Investment metrics
- 1% rule
- 1.26% ✓
- Cap rate
- 8.59%
- Cash-on-cash
- 8.19%
- DSCR
- 1.36
- GRM
- 6.6
CMA / ARV
No comps found within radius.
Projected returns pro-forma
-3.0% appreciation · 0.37% rent growth · sell at horizon
- IRR
- -7.2%
- Equity multiple
- 0.74×
- Total profit
- $-31,303
- Equity at exit
- $64,860
- IRR
- -1.7%
- Equity multiple
- 0.90×
- Total profit
- $-12,568
- Equity at exit
- $37,611
Cash invested: $121,800 (down + closing). Projections, not guarantees.
Landlord ↔ Tenant lean methodology
- Overall (STATE)
- 87 Strongly Landlord-Friendly
- State Florida
- 87 Strongly Landlord-Friendly · R+3
- County
- — inherits STATE
- City
- — inherits STATE
ZIP-level market 33913
- Home prices YoY
- -10.3%
- Rents YoY
- 0.4%
- Active inventory
- 811
- Price-to-rent
- 6.6×
Monthly cashflow live
- Estimated rent
- $5,484 high interval (Pro) →
- Mortgage (P&I)
- −$2,281
- Tax from tax record
- −$104 /mo · $1,246/yr
- Insurance
- −$181
- HOA
- −$935
- Vacancy / Maint / Mgmt
- −$1,152
- Net cashflow
- $831
Break-even live
UW: 25.0% down · 7.5% · 30yr · 1.5% tax · 5.0% vac · 8.0% maint · 8.0% mgmt
Financing live
Cash to close
- Down payment
- $108,750
- Closing costs
- $13,050
- Reserves months
- —
- Total cash needed
- —
Loan-product check · same deal, 3 products live
Conventional
25% down · 7.5% · 30yr
- Down + closing
- —
- Monthly P&I
- —
- Monthly cashflow
- —
- DSCR
- —
- Eligible?
- —
Personal DTI + credit; lowest rate.
DSCR
20% down · 8.5% · 30yr
- Down + closing
- —
- Monthly P&I
- —
- Monthly cashflow
- —
- DSCR
- —
- Eligible?
- —
No personal income docs; deal must DSCR.
Hard money
10% down · 12.0% · 12mo
- Down + closing
- —
- Monthly P&I
- —
- Monthly cashflow
- —
- DSCR
- —
- Eligible?
- —
Short-term bridge; refi at stabilization.
Rent comps 20 comps
| Address | Beds | Baths | Sqft | Rent | $/sqft | DOM | Units | Dist |
|---|---|---|---|---|---|---|---|---|
| 12062 Via Lighthouse Ln Fort Myers, FL | 3.0 | 2.5 | 1879 | $1,995 | $1.06 | 3d | 1 | 0.67mi |
| 12096 Ledgewood Cir Fort Myers, FL | 3.0 | 2.0 | 1798 | $2,850 | $1.59 | 23d | 1 | 0.72mi |
| 11801 Pine Timber Ln Fort Myers, FL | 3.0 | 2.5 | 2508 | $8,000 | $3.19 | 23d | 1 | 0.88mi |
| 11442 Tiverton Trce Fort Myers, FL | 3.0 | 2.0 | 2010 | $9,500 | $4.73 | 23d | 1 | 0.95mi |
| 11012 Castlereagh St Fort Myers, FL | 3.0 | 3.0 | 2517 | $12,000 | $4.77 | 23d | 1 | 0.96mi |
| 12797 Vista Pine Cir Fort Myers, FL | 4.0 | 2.0 | 2146 | $2,705 | $1.26 | 3d | 1 | 1.04mi |
| 11343 Tiverton Trce Fort Myers, FL | 2.0 | 2.0 | 1685 | $4,000 | $2.37 | 3d | 1 | 1.06mi |
| 10952 Clarendon St Fort Myers, FL | 2.0 | 2.0 | 1582 | $4,000 | $2.53 | 23d | 1 | 1.06mi |
| 11761 Pinewood Lakes Dr Fort Myers, FL | 4.0 | 3.0 | 2528 | $3,200 | $1.27 | 3d | 1 | 1.06mi |
| 12021 Brassie Cir #201 Fort Myers, FL | 3.0 | 2.0 | 2343 | $2,700 | $1.15 | 3d | 1 | 1.24mi |
| 11225 Lithgow Ln Fort Myers, FL | 2.0 | 2.0 | 2153 | $8,000 | $3.72 | 23d | 1 | 1.28mi |
| 10529 Casella Way #102 Fort Myers, FL | 3.0 | 2.0 | 1722 | $4,500 | $2.61 | 23d | 1 | 1.31mi |
| 12525 Astor Pl Unit 1049698P Fort Myers, FL | 3.0 | 2.0 | 2174 | $6,065 | $2.79 | 14d | 1 | 1.35mi |
| 10520 Casella Way #101 Fort Myers, FL | 3.0 | 2.0 | 1722 | $7,000 | $4.07 | 23d | 1 | 1.37mi |
| 11619 Meadowrun Cir Fort Myers, FL | 3.0 | 2.5 | 2242 | $2,495 | $1.11 | 23d | 1 | 1.38mi |
| 12908 New Market St #201 Fort Myers, FL | 3.0 | 2.5 | 2198 | $3,000 | $1.36 | 23d | 1 | 1.46mi |
| 11081 Lakeland Cir Fort Myers, FL | 4.0 | 2.0 | 2136 | $2,600 | $1.22 | 23d | 1 | 1.49mi |
| 10455 Casella Way #202 Fort Myers, FL | 3.0 | 2.0 | 2319 | $7,200 | $3.10 | 23d | 1 | 1.49mi |
| 11082 Lakeland Cir Fort Myers, FL | 3.0 | 2.0 | 1883 | $2,095 | $1.11 | 23d | 1 | 1.50mi |
| 12016 Five Waters Cir Fort Myers, FL | 3.0 | 2.0 | 1646 | $4,500 | $2.73 | 23d | 1 | 1.50mi |
HOA detail condo
- Monthly dues
- $935 · $11,220/yr
- Assessments
- None detected in remarks — confirm with the listing agent.
Listing history 16 events
-
2026-06-17days on market $435,000 Active 51 DOM
-
2026-06-16days on market $435,000 Active 50 DOM
-
2026-06-15days on market $435,000 Active 49 DOM
-
2026-06-13days on market $435,000 Active 47 DOM
-
2026-06-10days on market $435,000 Active 44 DOM
-
2026-06-09days on market $435,000 Active 43 DOM
-
2026-06-08days on market $435,000 Active 42 DOM
-
2026-06-07days on market $435,000 Active 41 DOM
-
2026-06-03days on market $435,000 Active 37 DOM
-
2026-06-02days on market $435,000 Active 36 DOM
-
2026-06-01days on market $435,000 Active 35 DOM
-
2026-05-31days on market $435,000 Active 34 DOM
-
2026-04-27$435,000 Active
-
2026-04-22price $450,000
-
2026-03-21price $469,000
-
2025-11-21$485,000 Active
ⓘ Source: listings_history table (triggers on properties + properties_extension) + one-shot
backfill from property_details.listing_events for pre-trigger history.
Tax reassessment forecast FL · Resets to sale price
- Current annual tax
- $1,246 · $104/mo
- Projected year-2 tax
- $3,610 · $301/mo
- Expected delta
- +$2,364/yr (+$197/mo · 189.8%)
ⓘ Screening estimate from a state-policy table — verify with the county assessor before closing.
Climate risk First Street
- Flood 1/10 Low FEMA zone X (unshaded) · 0% chance over 30 yrs
- Wildfire 4/10 Moderate
- Heat 9/10 Extreme 7 d/yr ≥107°F today · 28 d/yr by 30 yrs out
- Wind 10/10 Extreme 99% chance of damaging wind over 30 yrs
- Air quality 2/10 Low 1 unhealthy d/yr today · 1 by 30 yrs out
Nearby sold comps map
Loading sold comps map…
Walkable amenities ~0.75 mi
Loading nearby amenities…
Taxation est. · year 1
- Rental income
- $65,810
- − Mortgage interest
- −$24,367
- − Property taxes
- −$1,246
- − Insurance
- −$2,175
- − Repairs & maintenance
- −$5,265
- − Management
- −$5,265
- − HOA
- −$11,220
- − Depreciation
- −$12,655
- Taxable income
- $3,618
- Est. tax owed @ 24.0%
- −$868
- After-tax cash flow
- $9,106/yr
For passive investors: Depreciation is non-cash, so a rental often shows a tax loss while cash-flowing — sheltering income. Rental losses are passive: they offset passive income freely, and up to $25,000/yr can offset ordinary (W-2) income if you actively participate and your MAGI is under $100k (phasing out to $0 by $150k); unused losses carry forward. On sale, claimed depreciation is recaptured at up to 25%, and gains may owe capital-gains tax (a 1031 exchange can defer both). Figures are a year-1 estimate at your 24.0% rate — not tax advice; consult a CPA.
Schools (NCES district)
- District
- Lee
- NCES district ID
- 1201080
- Math proficiency
- 47% ▼ -11.00%
- Reading proficiency
- 50% ▼ -4.00%
- Median HH income
- $49,518
- Composite
- 41.49/100
- National rank
- #3458
- State rank
- #42 of 73 in FL
Livability — Fort Myers
- Score
- 86/100
- State rank
- #14
- US rank
- #383
Category grades
Schools grade is shown separately in the Schools card above.
Census & demographics
- Census place
- Fort Myers, FL
- County
- Lee County · 788,662 people
- City population
- 278,598
- Metro
- Cape Coral-Fort Myers, FL
- Population (ZIP)
- 31,538
- Household income
- $110,373
- Rent vs Own
- Severe rent burden
- 276.0
Population outlook (Lee County) Hauer SSP2
- Today (2025)
- 871,946 people
- By 2030
- 955,468 · +9.6%
- By 2040
- 1,113,587 · +27.7%
- By 2050
- 1,256,891 · +44.1%
- By 2075
- 1,560,270 · +78.9%
- By 2100
- 1,726,848 · +98.0%
Race, ethnicity, and origin ACS 2023
- Neighborhood character
- Predominantly White (74%)
- Race & ethnicity
- White 74% Hispanic / Latino 13% Two or more races 11% Black 5% Asian 2%
- Hispanic origin (detail)
- Mexican 3% Puerto Rican 3% Cuban 2%
- Common ancestry
- Romanian 5% Lithuanian 3% Slovak 2%
- Foreign-born
- 14% · Canada, Vietnam, China
- Languages at home
- 84% English-only · Spanish 10% Other Indo-European 2% French/Haitian/Cajun 2%
Political lean MEDSL · Lee
- 2024 margin
- Strong R (+28.4) · D 35.5% · R 63.9%
- 2008→2024 swing
- -18.0pp toward R · 2008: -10.4pp · 2024: -28.4pp
- All cycles
- 2024: R+28.4 2020: R+19.2 2016: R+20.4 2012: R+16.6 2008: R+10.4
Not yet ingested
- Civics
- —
Market trends
- HPI YoY
- ▼ -25.45%
- Current HPI
- 221.7115
- Rent YoY
- ▲ 0.37%
- Metro
- Cape Coral-Fort Myers, FL
- State GDP YoY
- ▲ 3.28%
- F500 in state
- 36
Industry mix (Fortune 500 HQ in FL)
| Industry | F500 HQs | Revenue |
|---|---|---|
| Industrial Technology | 2 | $29B |
|
||
| Insurance | 2 | $17B |
|
||
| Retail | 1 | $60B |
|
||
| Technology Distribution | 1 | $58B |
|
||
| Homebuilding | 1 | $35B |
|
||
| Technology Manufacturing | 1 | $35B |
|
||
Price history
-10.3% since first listed4 events — show timeline
- 2026-04-27 Listed $435,000 BEARMLS
- 2026-04-22 Price Changed $450,000 BEARMLS
- 2026-03-21 Price Changed $469,000 BEARMLS
- 2025-11-21 Listed $485,000 BEARMLS
Property tax history
+27.0%/yrLatest (2025): $1,246 · -4.9% YoY. Source: county tax records.
Cash-flow waterfall
monthlySold comps — $/sqft
last 12 mo · ≤1 miLoading sold comps…